Backblaze released its Q4 2017 hard drive failure statistics, and they continue to confound on the topic of enterprise-versus-consumer drive reliability.
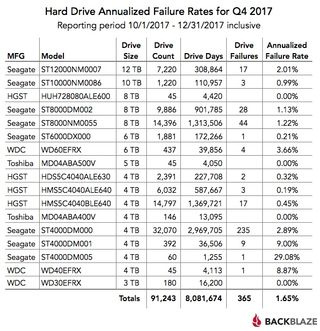
Cloud-backup provider Backblaze publishes hard drive reliability statistics from its data center every quarter. The startup has been keeping track of its statistics since 2013 and has now amassed over 93,000 hard drives of different makes in its data centers. These statistics are controversial, and we’ve commented on Backblaze’s practices before. However, there aren’t many others who provide this level of insight into hard-drive failure rates, so it’s still an interesting look into a topic many buyers are concerned about. Let’s start with the Q4-only statistics:

For starters, here’s an explanation of the metrics. “Drive Count” is the total number of drives of a model at the end of Q4. “Drive Days” is the combined total running time in Q4 of all the drives that make up “Drive Count”. “Drive Failures” is the total number of drives that make up “Drive Count” that failed in Q4. “Annualized Failure Rate” (AFR) is “Drive Failures” divided by “Drive Days” (converted to years) and it’s Backblaze’s chosen metric for drive reliability.
Before you get alarmed by the 29% failure rate of the Seagate ST4000DM005, take note of its “Drive Days” and “Drive Count”. This model only has 1,255 combined days of service across 60 drives, equaling about 20 days per drive. These drives are new for this quarter, so it’s not surprising that one drive, which alone is responsible for the 29% AFR, failed. The useful data in these statistics are for those models that have high “Drive Day” per “Drive Count,” which means that the drives have been in constant use for the whole quarter.
Having said that, let’s go through some of the standout models. Among the 4TB drives, the Seagate ST4000DM000 and ST4000DM001, both consumer drives, have standout failure rates of 2.89% and 9%, respectively. These drives had comparable “Drive Days” and “Drive Count” in Backblaze’s Q3 2017 report, in which they had higher failure rates of 3.28% and 18.85%. On the other hand, HGST’s 4TB consumer hard drive, the HDS5C4040ALE630, only suffered an AFR of 0.32% and 0.59% in Q4 and Q3, respectively. It’s not all bad for Seagate, though. Its 6TB ST6000DX000 consumer drive consistently outperformed its NAS-certified rival from WDC, the WD60EFRX. The former had an AFR of 0.21% and 0.42% in Q4 and Q3, compared to the 3.66% and 1.8% of the latter.
When we reported on Backblaze’s Q3 2017 report, we took note of a pair of 8TB Seagate hard drives: the ST8000DM002 (consumer) and the ST8000NM0055 (enterprise). In Q3, the enterprise drive actually had a higher failure rate of 1.04% compared to the 0.72% of the consumer drive. This led Backblaze to question the value of enterprise drives over consumer drives. Some of the enterprise drives were new back then, though. In Q4, the same 14,000 enterprise drives had a higher combined service time and saw their failure rate grow to 1.22%, while the consumer drive, which saw no change in its combined service time, had a failure rate of 1.13%. At the end of 2017, the enterprise drives had a cumulative-lifetime AFR of 1.23%, compared to the consumer drive’s 1.1%.

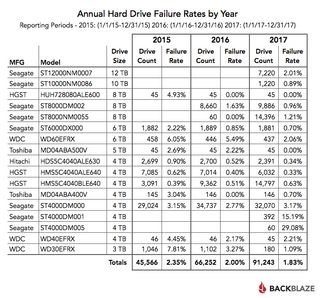
Though neither quarterly nor cumulative statistics are in favor of the enterprise drive, there are signs of improvements. First, the 14,000 enterprise drives saw more use in Q4 than they did in Q3, but they only saw an AFR increase of 0.18%, while the consumer drives, which had equal use in Q3, saw an AFR increase of 0.41%. This could be due to the age of the drives or a change in the conditions of the datacenter. If it’s the latter, then the lower increase of the enterprise drives’ AFR might mean that they’re more resistant. Also, looking at the annual failure rates presented above, it can be seen that in 2016, the year that the majority of the consumer drives were added, they suffered a 1.63% failure rate, which fell to 0.96% in 2017, their first full year of service. For the enterprise drives, however, 2017 was the year that the majority of them entered service, and they only saw a 1.21% failure rate. If they follow the same trend as the consumer drives in their first full year of service, then their annual failure rate could fall below the consumer drives’.
Stay on the Cutting Edge
Join the experts who read Tom's Hardware for the inside track on enthusiast PC tech news — and have for over 25 years. We'll send breaking news and in-depth reviews of CPUs, GPUs, AI, maker hardware and more straight to your inbox.
Turning our attention to two HGST drives, the HDS5C4040ALE630 (consumer) and the HMS5C4040ALE640 (enterprise), a slightly different trend can be seen. Here we have two batches of hard drives, both going through three years of successive service. The consumer drive had a significantly higher failure rate in 2015, 0.9% compared to the 0.62% of the enterprise drive, which eventually fell to 0.34%, equivalent to the 0.33% of the enterprise drive, after three years of service. Going further, looking at the 6TB consumer Seagate ST6000DX000 and NAS-certified WDC WD60EFRX, we see that the consumer Seagate sees a significant improvement in failure rate between 2015 and 2016, but this is followed by significantly less improvement in 2017. For the WDC, it sees little improvement between 2015 and 2016, but significant improvement in 2017. It never overtakes the consumer Seagate, however.
There isn’t enough data here to answer the question of whether enterprise drives are more reliable than consumer drives, but it does paint a picture that’s different from what one might expect. Many enterprise drives are certainly not showing standout durability, while many consumer drives are showing surprising reliability. If there’s something we and Backblaze can agree on, it’s that the HGST drives, consumer or enterprise, have standout reliability. We’re not saying you should generalize any of these results, but if you’re searching for your next NAS drive, you might want to choose one of the better ones in Backblaze’s list.
-
phobicsq Lol... Seagate and failure. Backblaze is way too slow to backup large amounts of data though.Reply -
bit_user AFR is too coarse. What we really want to see are plots of failure rate vs. drive age. With enough data, it should be possible to extrapolate these mortality curves by fitting their parameters to the known data of newer drives.Reply
And I hope they're not still lumping refurbs together with new drives.
Most Popular


