AMD Radeon R9 390X, R9 380 And R7 370 Tested
AMD's 300-series Radeons dropped today, and we've got three MSI cards in the lab: the R9 390X Gaming 8G, the R9 380 Gaming 2G and the R7 370 Gaming 2G.
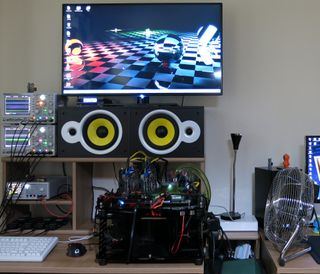
How We Test
Test System
We’ve introduced our complete methodology for graphics card benchmarking in our foundations article. Consequently, we’re just listing the main components in the table below.

| Test Methodology: | Contact-free DC Measurement at PCIe Slot (Using a Riser Card)Contact-free DC Measurement at External Auxiliary Power Supply CableDirect Voltage Measurement at Power SupplyReal-Time Infrared Monitoring and Recording |
|---|---|
| Test Equipment: | 2 x HAMEG HMO3054, 500MHz Four-Channel Oscilloscope with Data Logger4 x HAMEG HZO50 Current Probe4 x HAMEG HZ355 (10:1 Probe, 500MHz)1 x HAMEG HMC8012 DSO with Data Logger1 x Optris PI450 80Hz Infrared Camera + PI Connect |
| Test System: | Intel Core i7-5930X overclocked to 4.2GHz + Raijintek Triton All-in-One Water CoolerCrucial Ballistix Sport, 4x 4GB DDR4 2400MSI X99S XPower AC2x Crucial 512GB (System, Applications + Data, Storage)Be Quiet Dark Power Pro 850WMicrocool Banchetto 101Windows 8.1 (Fully Updated) |
| Drivers: | AMD: Catalyst 15.5 Beta / 15.15 BetaNvidia: GeForce 353.06 WHQL |
AMD’s 200-Series Comparison Graphics Cards
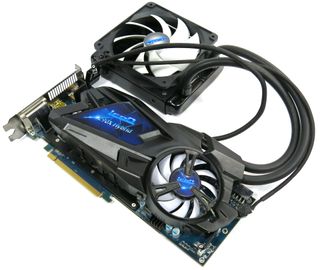
We were really interested to see how the new cards, especially the Radeon R9 390X, would stack up against their predecessors. We had to dig deep to find a model with the same stock clock rate, but eventually succeeded: HIS’ R9 290X IceQ Water Cooled 4GB doesn’t just have the same frequency as MSI’s R9 390X, but also sports a hybrid water cooling solution that managed to minimize leakage currents in spite of its high power consumption.
We want to assess if AMD has successfully optimized the new version of its Hawaii GPU or simply took a brute force approach by increasing clock rates as much as possible.

We’re comparing the MSI R9 380 Gaming G2 to Gigabyte's R9 285 Windforce with its 973MHz overclocked from the factory. The tuned R7 370 Gaming 2G goes up against HIS' R7 270 IceQ X² Turbo Boost Clock that also runs at 975MHz, as well as an older Radeon HD 7850 card based on the same Pitcairn GPU. The benchmarks are rounded out by suitable Nvidia graphics cards: the GeForce GTX 980 Ti, 980, 970 and GTX 960.
Unique Aspects Of Power Consumption Measurement
We’ve gone over our complete methodology for graphics card power consumption measurement in our foundations article, so we’ll stick with the highlights here.
In order to measure and record eight channels at the same time (4x voltage, 4x current), we need two coupled oscilloscopes (master-slave setup). We measure each of the PCIe power connectors separately. The reasons for this should be well-known by now–graphics cards like the Radeon R9 295X2 make this kind of setup unavoidable, since each of the connectors serves one of the GPUs.
The currents on the 3.3 and 12V rails are measured between the graphics card and the motherboard via two loops of a riser card that was constructed specifically for this purpose.
Stay on the Cutting Edge
Join the experts who read Tom's Hardware for the inside track on enthusiast PC tech news — and have for over 25 years. We'll send breaking news and in-depth reviews of CPUs, GPUs, AI, maker hardware and more straight to your inbox.


We’re using 1ms intervals for all of our results. These represent numbers that have been cumulated by our measurement equipment in order to get the massive amounts of data generated by these measurements under control.
Infrared Temperature Measurement With The Optris PI450
We’ve found that the temperature results aren’t just more interesting for us, but also for our readers, if we supplement the usual temperature diagrams and curves with meaningful pictures of our infrared camera.
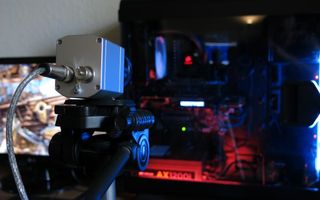
The Optris PI450 is an infrared camera that was developed specifically for process monitoring. It allows us to shoot both pictures and video at a good resolution. These don’t just show the maximum temperatures, but also any weaknesses in board or cooler design.

The Optris PI450 provides infrared pictures at a massive rate of 80Hz in real time. These can be transferred to a separate system via USB and recorded there as a video. The camera’s thermal sensitivity is 40mK, which is particularly well suited for the detection of small temperature differences, which is great for us, of course.
-
Grognak 390X at 4K is the only one showing anything that could be called an improvement and that's entirely due to the additional RAM, which you can already get on a 290X. I fear for the future.Reply -
envy14tpe Again I am left disappointed....AMD please stop doing this to me. So what I learned is the 390X is the same as the 290X at 1440p or below (which is 95% or more of gamers) and the 390X only excels at 4k but still only on par with the 980 (non ti). Looks like I'm abandoning AMD for my next GPU. damn it.Reply -
FormatC ReplyWhy did you ignore 390?
I can only test what I have. Too less samples :(
The 390X is'nt a bad card per se - it depends a lot at the price and your personal preferences. -
fudoka711 Wait, I think I'm misunderstanding something. Is the 390x a rebranding of the 290x, but costing $100 more??Reply -
HideOut ReplyNice to see 980 Ti still stomps everything, glad I bought one... a wise investment!
These are rebadge cards, their new cards are due out in days. Fanboy -
de5_Roy MSI R9 390X Gaming 8G's texture fillrate in the spec table (1st page) may have been incorrect. the gpu-z screeny shows 193.6 GTexels/sec.Reply
Most Popular

