How to Test Your Graphics Card
Here are the best GPU tests right now, so you can see how your new PC stacks up.
Running a few graphics card tests is one of the first things we do whenever we build a PC or upgrade one, perhaps with one of the best graphics cards. Not only is it a great way to find out just how much things have improved thanks to the upgrade, but it also lets you ensure you're getting the expected performance from your new hardware. Stress testing to check power, temperatures, and overall cooling on your PC is also important so that you don't run into future problems. And it's not just about GPU testing ; if you upgrade your processor with one of the best CPUs for Gaming, you can use these same techniques to check performance improvements. These are the best GPU tests: the ones we use for our reviews (or have used in the past) and our GPU benchmarks hierarchy, how we run them, and some other options you can look at to see how your PC and graphics card stacks up.
There are three primary types of GPU tests: actual games, 'synthetic' graphics card benchmarks, and compute benchmarks. Running a game you actually play, or want to play, is usually the best way to test performance. We'll cover how to do that in a moment. Synthetic tests are typically very easy to run, but they only tell you how your PC handles that specific benchmark — which may or may not equate to real-world gaming performance. Finally, GPU compute tests are usually quite different in how they work compared to games. If you're big into running Folding@Home or you use a GPU accelerated application like LuxCoreRenderer, that's great, but specific optimizations for certain GPU architectures can make a big difference in how your PC runs any specific workload.
Tools of the Trade
Before you start using one of the best GPU tests, there are a few useful utilities to install. First, for a lot of real world gaming tests, you need a tool to capture frametimes. There are three main programs we've used in the past. PresentMon is a command-line interface for logging frametimes. This is the least user friendly option and we don't recommend it (unless you really like text interfaces), and it's been supplanted by OCAT (Open Capture and Analytics Tool) and FrameView — both of which are based off of PresentMon's core functionality. If you're wondering, FRAPS hasn't been updated since 2013 and has some bugs with Windows 8/10, so it's best to use a modern utility.
OCAT was created by AMD engineers and is fully open source, while FrameView comes from Nvidia. There are minor differences in the interfaces and functionality, with the biggest being that FrameView logs power data. We've tested graphics cards power consumption using in-line hardware to measure precise loads, and the Nvidia power figures are accurate to within a few watts for Nvidia GPUs. AMD GPUs however report GPU-only power consumption, which can mean a difference of anywhere from 10W to as much as 100W, depending on the specific GPU (Vega being the worst offender). Otherwise, all three of these tools spit out the same general file format that gives frametimes, clock speeds, and a bunch of other details.
We've standardized on using OCAT for our GPU testing, but you can use FrameView or even PresentMon if you prefer. One important thing to note is that a lot of games do not like the overlay functionality built into these programs. Microsoft Store UWP apps and anything else with heavy DRM will often fail to start if the overlay is enabled, so we run without the overlay. If you want a framerate counter in the corner, you can give it a shot, but you'll know there's a problem if the game stops launching. Also note that games that use the Vulkan API aren't compatible with framerate overlays in our experience; they won't necessarily fail to run, but you won't be able to make the overlay actually appear on screen.
Because PresentMon and its derivatives already capture so much data, there's no need for additional tools like GPU-Z or HWiNFO64, though both are still handy to keep in your back pocket. HWiNFO64 is your one stop solution to monitoring just about every other component, including motherboard sensors, CPU clocks, and more. But it's not really necessary for GPU tests.
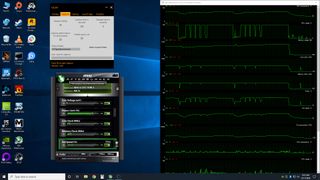
One other tool you still might want is something for overclocking or tuning your GPU, to help improve your benchmark results. Many graphics card vendors have custom software that only works with the specific brand of card you purchase, but not all of those software packs offer the same level of tuning. We generally skip the Asus, Gigabyte, ASRock, Sapphire, etc. utilities and just use MSI Afterburner, or maybe EVGA Precision X1. Afterburner works with pretty much any GPU made in the past decade or more, while Precision X1 only works with Nvidia GPUs, which means we typically prefer Afterburner. Tweaking your fan speed / cooling curve is a great way to reduce GPU temperatures and potentially improve performance, though it comes at the cost of more fan noise.
Stay on the Cutting Edge
Join the experts who read Tom's Hardware for the inside track on enthusiast PC tech news — and have for over 25 years. We'll send breaking news and in-depth reviews of CPUs, GPUs, AI, maker hardware and more straight to your inbox.
Games for GPU Tests
With OCAT in hand, any game can be used for GPU testing purposes. The main key is to find a repeatable section and test it multiple times. Also, some games have a locked framerate or a framerate cap, so benchmarking something like Cuphead isn't going to be particularly meaningful unless you're just trying to confirm that you're able to hit a steady 60 fps. We've tested Doom Eternal and Minecraft RTX using the methods we'll describe here, which can take dozens of hours if you're testing lots of different GPUs. But if you're only looking at your own PC, pre- and post-upgrade, it's pretty painless.
If you're after easy GPU tests, however, it's best to just pick one of a relatively large number of games that have built-in benchmarking tools. You can still use OCAT to log frametimes, which we recommend as a universal way of collecting performance metrics — plus it allows you to control the start/stop points for frametime logging. But if you're mostly just curious to see how much performance has changed with an upgrade, the built-in benchmarks certainly suffice.
Of course you need to own most of the games in question to be able to use them, but here are a bunch of games with built-in GPU tests. We'll stick with games released post-2015, but here's a bunch we use or have used in the past, in alphabetical order. We'll also include the download/install sizes, because if you're looking for a quick GPU test you probably don't want to download 100GB or more of data. And if you're wondering what today's state-of-the-art PC can do, we'll also provide a benchmark result for 1440p ultra on a Core i9-9900K with a GeForce RTX 2080 Ti.
Recent Games with Built-In GPU Tests

Ashes of the Singularity (22.0GB): Jokingly referred to as Ashes of the Benchmark, thanks to its widespread use in CPU and GPU reviews, AotS and its Escalation expansion are great for punishing your CPU — yes, CPU not GPU. It throws tons of units and objects on the screen, which is where low-level APIs often perform better. The game supports DirectX 11 (DX11), DirectX 12 (DX12), and Vulkan rendering, with the latter two being preferred over DX11 as they allow the CPU to process things more efficiently (DX12 performed best in our testing). The benchmark lasts about three minutes, and the built-in results browser is quite extensive, breaking down performance into various categories based on the complexity of the scene. AotS is also perhaps the only game to support explicit multi-GPU support in DX12, allowing you to try mixing and matching GPUs of different levels — like, say, RTX 2070 with RX 5700 XT! It sounds better than it works in practice. Don't focus too much on absolute framerates, especially if you choose to run at the 'Extreme' or 'Crazy' presets where the CPU becomes the primary bottleneck.
1440p Extreme performance (DX12): 108.8 average fps, 71.7 99th percentile

Assassin's Creed Odyssey (98.5GB): The built-in GPU test only takes about a minute to run, though the amount and variety of clouds in the sky can have a modest (up to 10%) impact on performance. We recommend running the test at least 3-5 times, trying to get a "clear / sunny" day for comparison purposes, or run it five times and take the average. Annoyances include the need to restart between most settings changes (not resolution), plus the benchmark drops you out to the initial loading screen between runs. Basically, you spend over a minute prepping for the test , and then 60 seconds in the actual benchmark. But Assassin's Creed is a popular series, and as the latest installment Odyssey is worth considering as a GPU test.
1440p Ultra performance (DX11): 74.5 average fps, 58.7 99th percentile

Assassin's Creed Origins (70.5GB): The previous game in the Assassin's Creed series, Origins came out in 2016. It's a bit less demanding with a GPU test sequence that lasts nearly twice as long (115 seconds). AC games tend to max out at around 120-140 fps, regardless of settings, but then they're not twitch games like CS:GO where you'd benefit from extreme refresh rates and framerates. Origins doesn't force you back to the start screen after each test either, and the weather is fixed so the benchmark results are far more consistent.
1440p Ultra performance (DX11): 96.1 average fps, 71.4 99th percentile

Batman Arkham Knight (35.2GB): Originally released in such a poor state of optimization that it was temporarily pulled from Steam before being reinstated, Arkham Knight is the most recent Batman game (though rumors of another being in the works are still swirling). The various Batman games have had some decent built-in GPU tests. They're also part of a select few games to make use of Nvidia's PhysX API in a meaningful way. RIP, PhysX — it's not technically dead, but very few games make full use of it these days. The benchmark sequence lasts about 95 seconds and is easy to run, and five years later PC hardware has reached the point where getting relatively high performance in Arkham Knight isn't nearly as challenging as it once was.
1440p Max + PhysX performance (DX11): 126.2 average fps, 63.2 99th percentile

Borderlands 3 (82.7GB): A modern game built using Unreal Engine 4, Borderlands 3's GPU test takes about two minutes from the time you press start, about 30 seconds of which is waiting for the level to load. BL3 supports DX11 and DX12 rendering, with the latter doing better on AMD cards. If you have an Nvidia card, DX12 is only better at lower settings on high-end hardware, like an RTX 2070 Super or better at 1440p medium or lower settings. Basically, use DX11 for Nvidia and DX12 for AMD. Note that the first time you launch the DX12 version of the game, there's a rather lengthy shader pre-compilation pass that can take a couple of minutes, depending on your hardware. The built-in benchmark generates a CSV file of frametimes for you, which is potentially one less thing to worry about, but the generated CSV contains about five seconds of data at the start that isn't particularly useful and should be omitted from any performance calculations. We maxed out the quality settings with the 'Badass' preset, because why not? (Actually, there's almost zero visual benefit of going from the ultra preset to badass, even though performance drops 10%, but whatever.)
1440p Badass performance (DX12): 80.7 average fps, 62.0 99th percentile
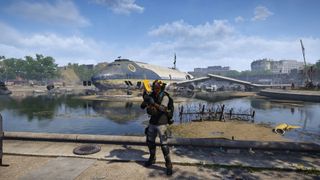
The Division 2 (65.1GB): Ubisoft's open-world post-pandemic-that-wipes-out-much-of-the-population setting might feel a bit too on the nose right now, but the built-in benchmark is still a staple of our GPU tests and reviews. Like Borderlands 3, it also generates a CSV of frametimes, with sensible start/stop points that give results nearly identical to our own OCAT logging. DX11 and DX12 are supported, with DX11 typically performing a bit better on Nvidia cards, particularly older/slower models, but we stick with the DX12 version for our testing to keep things standardized.
1440p Ultra performance (DX12): 99.7 average fps, 80.9 99th percentile

Far Cry 5 (73.0GB): Nearly every Far Cry game has included a built-in GPU testing tool. For FC5, the test sequence is quick and painless, lasting about one minute. The game comes with four presets plus a variety of other settings you can customize as needed. The first run is usually a bit more erratic than subsequent tests, so make sure you run it at least three times to get a good idea of the typical performance.
1440p Ultra HD performance (DX11): 130.2 average fps, 101.4 99th percentile

Far Cry New Dawn (41.2GB): One year newer than the above, it takes place 20 or so years after the ending of Far Cry 5. The engine is the same, but the benchmark sequence is slightly different, and performance tends to be a bit lower in New Dawn. You really only need to test one of the Far Cry games, as the results tell the same story.
1440p Ultra performance (DX11): 114.5 average fps, 85.3 99th percentile

Far Cry Primal (20.1GB): Going the other direction, FCP is a few years older and is theoretically slightly less demanding. It still uses the Dunia 2 engine, however, so again there's no need to run multiple different Far Cry tests. Somewhat ironically, performance in Primal is lower than Far Cry 5, likely because the benchmark sequence has a lot of water in it and that reduces framerates compared to some other areas in the game.
1440p Ultra performance (DX11): 115.0 average fps, 78.0 99th percentile

Final Fantasy XIV Shadowbringers Benchmark (2.2GB): This one is free, small, and easy to run. It's also quite a bit less demanding — even at maximum quality, Final Fantasy XIV doesn't need a beast of a GPU. It's a long benchmark by default, lasting about seven minutes. You can log frametimes and exit after the first few minutes, which is how we use the GPU test, and you'll want to log frametimes as the test only reports a nebulous score.
1440p Maximum performance (DX11): 151.5 average fps, 73.5 99th percentile

Forza Horizon 4 (75.8GB): If you like car racing games, Forza Horizon 4 is great and the built-in GPU test is easy enough to use. It takes about 80 seconds to complete and generates consistent results. Note that it's only available on the Microsoft Store, which remains one of the most user unfriendly digital storefronts. It also requires a DX12 compatible GPU, which means it tends to run better on AMD GPUs.
1440p Ultra performance (DX12): 159.0 average fps, 131.2 99th percentile

Grand Theft Auto V (86.3GB): The oldest game in our list, GTAV came out in 2013 on consoles, but didn't arrive on PC until 2015. It has a comprehensive set of graphics options you can adjust, and at maximum settings, with the advanced features enabled as well, it remains a fairly demanding game. (At lower settings, however, it's a piece of cake to get 60 fps on GTAV.) One major downside to GTAV is that there are no presets, so you have to make sure you manually input the same settings on each GPU you test. The benchmark takes about four minutes to run and has five different scenes, but only the last scene (116 seconds long) is truly useful as a benchmark as the others are too short. It's a lot like Red Dead Redemption 2 in that regard.
1440p Max 4xMSAA performance (DX11): 93.0 average fps, 59.1 99th percentile

Hitman / Hitman 2 (65.6GB / 149GB): The 2016 reboot of Hitman brought DX12 to the series, which can boost performance quite a bit on most GPUs. Hitman 2 initially skipped the DX12 support but later added it. Both games use the same engine, but Hitman 2 has been updated with newer rendering features, making it arguably the better choice to buy and play since it includes all the previous game's levels. It also has two different test sequences, Miami and Mumbai, both of which last a couple of minutes.
Hitman: 1440p Max (no SSAA) performance (DX12): 158.5 average fps, 104.5 99th percentile
Hitman 2 Miami: 1440p Max (no SSAA) performance (DX12): 123.6 average fps, 73.0 99th percentile

Horizon Zero Dawn (70.8GB): This is a DirectX 12 only game, and our Horizon Zero Dawn benchmarks piece covers it in extreme detail. The game appears to favor newer GPU architectures, and the built-in benchmark tends to be a bit lighter than actual gameplay (but it's more reliable in terms of consistency of results). Future patches are still planned to improve performance, and this is one to keep an eye on.
1440p Ultimate Quality performance (DX12): 94.1 average fps, 72.6 99th percentile

Metro Exodus (77.7GB): One of the first games to support Nvidia's RTX hardware via the DirectX Raytracing (DXR) API, Metro Exodus can punish even the fastest graphics cards at higher settings and resolutions — and turning on ray tracing adds insult to injury. DLSS does help mitigate the DXR tax, but this is the original DLSS, not DLSS 2.0. The built-in GPU test can be launched by browsing to the game's installation folder and running the Benchmark.exe program, which has five presets along with an RTX mode. If you purchase a graphics card with ray tracing support, this is a great benchmark to see how ray tracing runs, and the difference between rendering modes. Indoor areas with lots of shadows show the biggest difference, but the performance hit for global illumination (indirect lighting) via DXR is massive.
1440p Ultra performance (DXR+DLSS): 68.7 average fps, 43.8 99th percentile
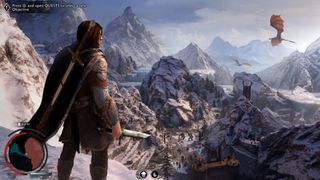
Middle-Earth Shadow of War (151GB): From 2017, Shadow of War can push GPUs with less than 8GB VRAM to their breaking point — especially if you use AMD GPUs. It also happens to be one of the fattest games we've encountered, tipping the scales at a whopping 134.7GB download in Steam and occupying 151GB of drive space. Frankly, the HD texture pack doesn't make that big of a difference and you should probably skip it. The built-in test takes about a minute to run and generates fairly consistent results, provided you don't exceed your GPU's VRAM. As usual, the first run should be ignored since your GPU is probably still warming up, plus you'll get more stuttering on the first pass while things get cached into memory.
1440p Ultra performance (DX11): 112.9 average fps, 84.1 99th percentile

Red Dead Redemption 2 (115GB): Rockstar's latest magnum opus, Red Dead Redemption 2 has a lot of similarities to GTAV. There are no proper presets (ignore the preset slider as it chooses different settings based on your GPU). There are also about 40 settings you can adjust, although only five or so make a major difference in performance. For this test, we maxed out everything except MSAA, though lesser PCs will probably need to run at much lower settings. RDR2 supports the Vulkan and DX12 APIs, with Vulkan generally performing best in our experience. We log the frametimes during the fifth test sequence, which lasts about 130 seconds and starts with Arthur robbing a cash register.
1440p Max no MSAA performance (Vulkan): 64.2 average fps, 52.8 99th percentile

Rise of the Tomb Raider (20.9GB): The built-in GPU test actually isn't very good, as especially the first scene is less complex and generates higher framerates. Still, it's easy to run and you can log frametimes from just the second and/or third sequence for a more representative benchmark. Of course, RotTR has been supplanted by its younger sibling now.
1440p Very High performance (DX12): 142.1 average fps, 105.9 99th percentile

Shadow of the Tomb Raider (35.3GB): There are several benefits to using the latest Tomb Raider as a benchmark. First, it's a newer game, so it better represents the latest trends in game engines and hardware requirements. Second, while it still has three test sequences, the first and third are relatively good representations of typical gameplay. Third, and perhaps most importantly, it supports DXR, making it another potential showcase for your RTX graphics card (or AMD RDNA 2 or Nvidia Ampere in a few months). Except, the DXR effects are only for shadows and honestly don't look that impressive, especially for the performance hit they inflict. At least DLSS mostly offsets the drop in performance.
1440p Ultra performance (DXR+DLSS): 86.2 average fps, 54.9 99th percentile

Strange Brigade (33.6GB): This is an asymmetrical co-op game sort of in the vein of Left 4 Dead, by the people behind the Sniper Elite games and using the same Asura engine. It utilizes the Vulkan or DX12 APIs, with Vulkan generally being preferred, and has a benchmark sequence that lasts around one minute. It's a quick and easy benchmark, though not of a tremendously popular game or engine. The GPU test also has no enemy AI running, as far as we know — all the players and enemies are frozen in time — which means performance in the benchmark may be higher than actually playing the game, particularly on slower/older CPUs.
1440p Ultra performance (Vulkan): 193.4average fps, 153.8 99th percentile
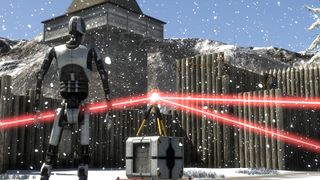
The Talos Principle (5.3GB): It's a few years old, using the Serious Sam 4 engine (which is still not out), but with puzzle gameplay. The Talos Principle is a small download and the GPU test is easy enough to run. The benchmark is under the Extras menu, and runs with the current settings. It also supports the DX 11, DX 12, and Vulkan APIs. The full test sequence takes about three minutes, and in testing the DX11 API still performs best for Nvidia GPUs. (We haven't tested AMD performance recently, but Vulkan may be the best option there.)
1440p Ultra performance 4xMSAA (DX11): 203 average fps, 137.2 99th percentile
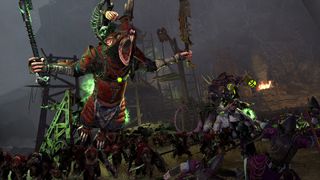
Total War Warhammer 2 (53.4GB): This is an AMD promoted game with DX12 support, but the support is listed as 'beta' even two years after the game launched. For Nvidia, you'll still get better performance from the DX11 API, while AMD sometimes performs better with DX12 — it varies by driver and GPU. There are three different benchmarks you can run: Battle, Campaign, and Skaven. We prefer the Skaven test, which seems to best represent 'realistic' gameplay and takes about 60 seconds to run (plus 20-30 seconds in load times).
1440p Ultra performance (DX11): 99.8 average fps, 62.2 99th percentile

Wolfenstein Youngblood (42.8GB): Vulkan ray tracing support for reflections was added many months after the initial launch, along with two different built-in GPU tests (Riverside and Lab X), each lasting about 30 seconds. That's a bit on the short side, unfortunately, and the ray traced reflections don't make that much of a visual difference. DLSS 2.0 support was also added, which generally undoes any performance loss from ray tracing. The Lab X test is slightly more demanding, with lots of shiny and reflective floors, so we used that. Performance is surprisingly high for a game with ray tracing effects, which makes us wonder if perhaps more games should be using VulkanRT instead of DXR.
1440p Mein Leben! with RT performance (VulkanRT+DLSS Quality): 154.9 average fps, 121.1 99th percentile

Zombie Army 4 (49.0GB): Last in our not at all complete list of games with built-in benchmarking tools, Zombie Army 4 uses the same Asura engine as Strange Brigade, generally with similar performance characteristics — though the actual test is different so you can't compare ZA4 scores with SB scores. Likewise, you can choose between DX12 and Vulkan APIs, with the latter being preferred. Performance is lower than in Strange Brigade, but again that's probably more to do with the test sequence than the actual game.
1440p Ultra performance (DX12): 146.7 average fps, 93.1 99th percentile
How to Benchmark Any Game, and Some Recommendations
What about testing games without built-in GPU test features? It can be done, and it's not super difficult. The key is to consistently use the same test sequence, as much as possible — so testing in the middle of a shootout with multiple enemies isn't a good idea, as the battle will rarely go the same way each time. We recommend using at least a 60 second test sequence, and while you could go as long as you want, anything more than two minutes usually passes the point of diminishing returns.
We use OCAT, in part because it has proven reliable with every game we've tried, and also because we like the audio cue feature — since the overlay often fails to work, having an audible start/stop sound lets you know you've properly got the frametime capture running. We also set it to capture performance for all processes, which sometimes generates extra files (e.g. for Explorer.exe) that can be deleted from the results directory. Here are some of the more recent popular games for manual GPU testing.
One important point to make is that because manual benchmarking doesn't have a preset route, you can't compare scores between different publications — unless they're all using the same sequence. If you test a game like Battlefield V on different maps, and even in different areas of the same map, performance will vary quite a bit. This is why most benchmarks stick with singleplayer testing as well, as multiplayer introduces a slew of other variables. We've included videos below of the benchmark sequences used for each of the games.
Battlefield V (88.6GB): Besides being a popular series, Battlefield V holds the perhaps dubious distinction of being the first full game to get ray tracing support. A patch was released about a month after launch … and the initial performance was pretty awful, cutting fps in half. Nvidia and DICE worked to refine the algorithms and eventually reduced the framerate drop to 20-30%, depending on the area and level. What's more, the DXR effects are only for reflections, so you mostly see them when you're specifically staring at a shiny car or window. Most of the time, we can play without DXR and not feel like we're missing much. Plus, in multiplayer mode where framerates are critical, image fidelity takes a back seat. Battlefield V was also the first game to get support for DLSS, but with restrictions, like the fact that you can't enable DLSS on an RTX 2080 Ti unless you're running at 4K. Sigh. Our test sequence is an assault on artillery fortifications in the Tirailleur mission — but other missions where there isn't so much combat might be easier for benchmarking purposes.
1440p Ultra + RT performance (DXR): 89.5 average fps, 73.8 99th percentile
Call of Duty: Modern Warfare (212GB): Ho. Ly. Crap. Over 200GB of data for a single game? Congrats, Activision, you 'win' this round. If you love the Call of Duty series, have at it, but we don't recommend downloading this game purely for GPU testing purposes. (It took about 90 minutes to download on a 350 Mbps connection!) It does support DXR effects, for shadows, and they look a bit better than in some of the other games (Shadow of the Tomb Raider). The performance hit isn't massive either, though in multiplayer mode you'll almost certainly prefer higher framerates to improved shadows.
1440p Max + RT performance (DXR): 96.3 average fps, 79.4 99th percentile
Control (41.8GB): Of all the ray tracing games, this is the one where the difference between traditional rendering and DXR is most pronounced. It uses DXR for reflections, transparent reflections, indirect diffuse lighting, and contact shadows. If you have a DXR-capable graphics card, Control might actually make you feel it was worth the added cost. Hopefully with future ray tracing hardware providing improved performance, we'll see more games offer enhanced visuals in the vein of Control rather than just slightly improved shadows or reflections.
1440p Max + RT performance (DXR + DLSS): 89.3 average fps, 71.6 99th percentile
Dishonored 2 (42.1GB): Arcane has released several great 'immersive sims,' including Prey and the Dishonored series. Performance at launch was a bit iffy for Dishonored 2, but things have improved quite a bit since then, thanks to patches, new drivers, and faster hardware. It's a game that's worth revisiting, just for the Clockwork Mansion level. For GPU testing , we ran around the dock area of Karnaca. One quick note is that after maxing out the graphics settings, you need to set vsync to enabled and then force vsync off in the Nvidia Control Panel; otherwise you end up with a 120 fps framerate cap.
1440p Ultra + HBAO+ performance (DX11): 143.3 average fps, 104.6 99th percentile
Doom Eternal (43.8GB): id Software's latest in the Doom series boasts more visceral combat than ever before. It also runs incredibly well compared to many other games that frankly don't look as good. You can see our Doom Eternal benchmarks, which also show the path we used in our test sequence. Besides being a great game and another example of a highly optimized Vulkan implementation, perhaps most interesting is the lack of ray tracing support — something that was promised but hasn’t arrived yet. It will likely come in a patch, but if Wolfenstein Youngblood is any indication, it could be months before it arrives.
1440p Ultra Nightmare performance (Vulkan): 207.4 average fps, 157.8 99th percentile

Microsoft Flight Simulator 2020 (100GB): The latest installment in the flight sim series is a beast, capable of punishing CPUs and GPUs. Even at ultra quality, in our testing many of the fastest graphics cards hit a CPU bottleneck. To ensure consistent results, we recommend using the autopilot feature and a saved position, so that the weather and other elements are the same each run. We used a 90 second clip of a plane coming in for a landing for our in-depth Microsoft Flight Simulator benchmarks. Note also that a DirectX 12 patch is supposed to be coming, which could dramatically improve performance.
1440p Ultra performance (DX11): 49.1 average fps, 41.0 99th percentile
Minecraft RTX (0.9GB): What's the most popular game in the world? Minecraft. It's also extremely easy to run on just about any relatively recent PC … until you enable the DXR path tracing effects, at which point it becomes one of the most demanding games around. Our full Minecraft RTX benchmarks provide more details. DLSS 2.0 isn't just helpful here, it's basically required — otherwise even an RTX 2080 Ti will choke at 1080p with all the DXR rendering effects enabled. There are a bunch of free sample worlds from Nvidia sponsored creators, assuming you have an RTX card and the Microsoft Store version of the game — sorry Minecraft Java users.
1440p Ultra + 24 RT render distance (DXR + DLSS): 71.4 average fps, 46.6 99th percentile
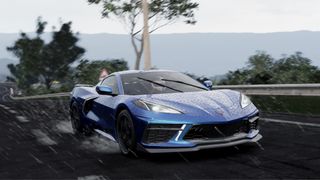
Project CARS 3 (45.5GB): As with MSFS, this game tends to hit CPU limits at lower settings, though not to the same extent. There are also no graphics presets, at least not at launch. You can see our full Project CARS 3 benchmarks for additional results, and we used the replay feature to get precisely repeatable benchmarks. Different tracks, camera selection, time of day, and weather all impact performance, so be sure to test in the same manner. Also, the replay tends to perform a bit worse (10-15%) than live gameplay.
1440p Max performance (DX11): 113.4 average fps, 87.3 99th percentile
The Witcher 3 (27.9GB): This is an oldie by goodie, now past its fifth birthday. It remains one of the better looking games around, and with a high-end gaming PC it runs quite well even at maxed out settings — though you'll still need an RTX 2080 Ti if you're hoping to run 4K at max settings with 60 fps or more. If you're looking for a demanding test sequence, riding around Novigrad or any other large city can tax both your CPU and GPU. Plus, since this is from the same studio that's making Cyberpunk 2077, it's a best estimate at what that game may require — except far less demanding since there are no DXR effects in The Witcher 3.
1440p Ultra + HBAO+ performance (DX11): 116.6 average fps, 77.7 99th percentile
That's a lot of potential gaming benchmarks, and you definitely don't need to run all of them — or even half of them. However, these benchmarks represent the 'good' games I've used for GPU testing over the past five years. More will be coming this fall, when a bunch of new games are slated to launch, and we'll see even more ray tracing games once the next generation consoles arrive. We'll keep this list updated with any interesting new additions as time rolls on, and if there's a great game for GPU tests you feel we've missed, let us know in the comments.
Synthetic GPU Tests
Testing with real games is generally preferred to testing with synthetic GPU tests that merely try to mimic games. If you want to know how well 'Game X' runs, testing with that game is the only way to get the true answer. Using a different game to try to guess performance wouldn't make sense, and using synthetic GPU tests to estimate gaming performance won't necessarily give a useful answer either. However, there are advantages to such benchmarks.
First, they're often free. You can pay for an upgraded version that allows custom benchmark runs and automation, but such features aren't necessary if you're just trying to check out how your new PC performs. Some of these tools are cross-platform, so you can compare Windows PCs with iOS, MacOS, and Android devices. This is also a weakness, as fast PC graphics cards are often an order of magnitude more powerful than mobile devices, which means the benchmarks are often very limited in order to not overtax a smartphone. Finally, synthetic benchmarks are often much smaller downloads — the largest of the test suites, 3DMark, is only 6GB, which is about the same size as the smallest game we listed above.
These are the best GPU tests , so we're leaving out tests that don't meet our criteria — simplistic graphics benchmarks that don't properly represent modern graphics hardware, for example.

3DMark: One of the oldest, most popular and best GPU tests, it generates reasonably accurate results if you want to know the overall performance difference between GPUs, at least on the more demanding tests. We recommend Time Spy and Fire Strike as the best options for PC; the cross-platform Night Raid is less useful, as it needs to scale down to mobile devices. The difference in performance between various GPUs can fluctuate by as much as 20% in either direction, depending on the test, which is more than the gap between GPU tiers. As with any single benchmark, it's merely one data point, but 3DMark is arguably the best representation of GPU performance outside of game testing.
It's by no means a universal metric, however. For example, across our test suite of nine games and six different resolutions and settings combinations, the RTX 2080 Ti ends up 14% faster than the RTX 2080 Super, and 18% faster at 4K. 3DMark Time Spy shows the 2080 Ti leading by 20% while Fire Strike shows a 15% lead. But Night Raid only shows a 5% difference — because it's more like running a lightweight game than something that will push your GPU to its limits.

Basemark GPU: Compared to 3DMark, Basemark GPU is an even faster test that feels less representative of real-world performance. It takes about 30 seconds to run is all, and you can select either the Vulkan (usually best), DirectX 12, or OpenGL rendering API. It's also cross-platform, which means it needs to run on a wide range of hardware and is thus less likely to showcase the power of high-end GPUs. Still, it gives a 21% lead to the 2080 Ti over a 2080 Super, so for a short benchmark it's not bad. Of course, our gaming suite shows a 2080 Ti beating the Radeon VII by 28%, while Basemark gives the 2080 Ti a 65% lead, and numbers are missing for the RX 5700 series for some reason.

FurMark: Less about performance and more about stress testing, FurMark is one of the best GPU tests for trying to max out power use on your graphics card. Who knew rendering a fuzzy donut could be so taxing for a GPU? It can push GPUs so far past their usual limits that most modern GPUs have protections now to prevent tools like FurMark from causing them to fail. Still, there are some GPUs that go well beyond their official limits — we use FurMark as one of the tools in our graphics card power consumption testing. What could possibly go wrong with an R9 Fury X drawing 370W of power?

Unigine Superposition Benchmark: Unigine has been creating GPU tests for over a decade, starting with Heaven back in 2009, Valley in 2013, and most recently Superposition from 2017. Superposition uses advanced rendering techniques like SSRTGI (Screen Space Ray Traced Global Illumination) to generate some impressive results — without the need for RTX hardware. Stepping through the 14 'debug' rendering modes is also pretty cool as you can see what each rendering pass focuses on. Only a handful of games have used the engine so far, with the upcoming Dual Universe perhaps being the first major game to do so.
That's it for the synthetic graphics benchmarksThere's a reason 3DMark is the most used graphics benchmark outside of games. You can't hope to properly simulate games that include 50-100GB of geometry and texture data with a test that's less than 100MiB in size.
GPU Compute Tests
Last, we have the GPU compute tests . Such workloads can be quite different from games, as they don't tend to focus on textures and geometry but instead do various scientific computations. It's also worth noting that some of these benchmarks, like FurMark, can push graphics cards well beyond their usual 'safe' limits. There's a reason data center GPUs often have lower clocks (and larger fans) than consumer graphics cards. They're designed to run 24/7 computational workloads without failing. If there's one thing we learned from the cryptocurrency mining era, it's that consumer GPUs often fall apart within a year if you run them at 100% load all day, every day.
That's not to say all compute workloads are brutal. Many applications, like Adobe's Creative Cloud suite, now have GPU acceleration. Some 3D rendering applications also use compute shaders to improve performance. It's also possible to limit how demanding some of these workloads are, like telling Folding@Home to only run your GPU at 80% load.
AIXPRT: Deep learning is a big topic these days, with AI powering everything from cars to doctors to music composition and more. How do you go about making a deep learning network, and which GPUs are best for the task? That's a seriously deep rabbit hole, but AIXPRT is one of the few deep learning training benchmarks that's not extremely difficult to get up and running. Which isn't to say it's easy — you still have to jump through quite a few hoops — but it's at least manageable. It can run on CPU or GPU, and supports Nvidia GPUs for TensorFlow and TensorRT calculations. Or you can run OpenVINO on CPUs, or MXNet if you want to use Linux instead of Windows. The tests can also take quite a while to run, because training Resnet50 is still a lengthy process.
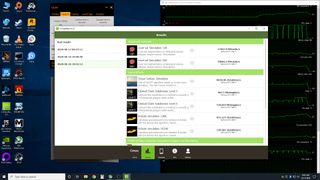
CompuBench: This is a relatively easy benchmark to get up and running, and it will run physics, graphics, video processing, face detection, and 3D rendering (path tracing). The test supports OpenCL and CUDA, with the latter only running on Nvidia GPUs while OpenCL works on 'all' GPUs (maybe not older Intel integrated graphics).
Folding@Home: If you haven't heard of Folding@Home with all the COVID-19 stuff going on, you apparently don't normally read tech publications, so welcome to Tom's Hardware! But seriously, FAH consists of a bunch of computational packages for helping scientists and researchers figure out how proteins fold, which can lead to a better understanding (and potentially cures) for a variety of diseases. It's distributed computing on a massive scale, and the FAH network now boasts more computational power than even the fastest supercomputers — about 2.6 ExaFLOPS at present. Donating your 'spare' compute cycles to the project is a nice way to test performance and also help others.
LuxMark: A 3D rendering tool that uses OpenCL to run the workload on your GPU, it's been a staple of our GPU compute tests for quite a while. It's sort of like a Cinebench tool for your graphics card.
V-Ray Next: V-Ray is a self-contained benchmark from ChaosGroup, and V-Ray Next is the latest GPU-accelerated version of the benchmark. It does path tracing via CPU or GPU, calculating the number of 'paths' your hardware can perform in a one minute benchmark. As an example, an RTX 2080 Ti managed 363 mpaths (millions of paths), a Core i9-9900K only did 80 mpaths, and together the CPU and GPU were able to compute 438 mpaths. It's a great example of why many path tracing applications are moving to support GPUs in addition to traditional CPU rendering.
Get V-Ray (309MB) — registration required
Closing Thoughts on GPU Tests
Testing the performance of your GPU is a great way to ensure everything is running properly. Your graphics card isn't the only factor, of course — the CPU, RAM, storage, and potentially display (or at least resolution) are also factors in both gaming and overall performance. But if you're playing a game and find it's running poorly, checking your benchmarks compared to what others are getting can help eliminate or confirm the root cause. Maybe it's time to upgrade to a new GPU, or maybe it's another component that's the bottleneck, or it could be software or drivers bringing down your score. Armed with some benchmark results, you'll be better equipped to determine if performance is where it should be, or if investing some time in tuning is worthwhile.
Jarred Walton is a senior editor at Tom's Hardware focusing on everything GPU. He has been working as a tech journalist since 2004, writing for AnandTech, Maximum PC, and PC Gamer. From the first S3 Virge '3D decelerators' to today's GPUs, Jarred keeps up with all the latest graphics trends and is the one to ask about game performance.
-
hotaru.hino If you also want to get metrics about the hardware, GPU-z's logging feature is convenient, especially since it formats it as a CSV so you can open it up in virtually any spreadsheet program. I've also found for more accurate VRAM utilization, you need to run PerfMon while capturing VRAM usage and isolate it by process. It's a lot of work, but it'll tell you what just the application is doing.Reply
Most Popular


