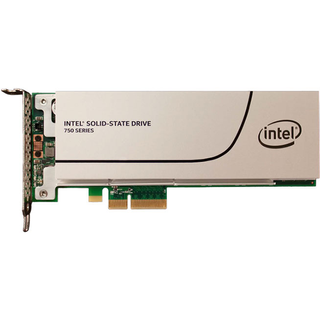
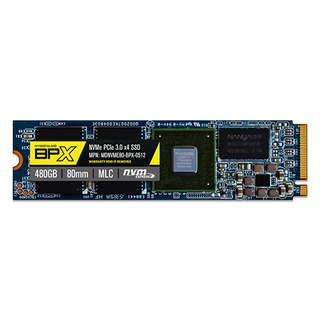
Team Group T-Force Cardea SSD Review
Why you can trust Tom's Hardware
480GB Performance Testing
Comparison Products
The NVMe 512GB-class should be the most popular of all consumer SSDs for our readers; it offers the best mix of performance, capacity, and cost. Pricing starts out at just $179.99 for the Intel 600p but escalates quickly due to NAND type and cooling options.
The MyDigitalSSD BPX 480GB is the current value leader at $199.99. It ships with a 5-year warranty, just like the Intel 600p that gained popularity due to its tier-one manufacturer. The Samsung 960 EVO is at the upper limit of the value segment. It's priced at $249.99 like the Adata SX8000. The Team Group T-Force Cardea 480GB we're testing sells for $269.99 and kicks off the upper pricing tier with the Intel SSD 750 series (with just 400GB of user capacity), the OCZ RD400, and the Plextor M8Pe.
Sequential Read Performance
To read about our storage tests in-depth, please check out How We Test HDDs And SSDs. We cover four-corner testing on page six of our How We Test guide.


The current bang-for-your-buck darling, the MyDigitalSSD BPX, and the newcomer Team Group T-Force Cardea both feature the Phison PS5007-E7 controller. The Cardea comes with a large heat sink to dissipate heat and has a newer firmware than the BPX.
The new firmware on the Cardea seems to increase sequential read performance at low queue depths (QD). We conduct this test early in our regimen, so it takes place well before any thermal throttling could impact results. The Team Group NVMe SSD is faster than the BPX up to QD16, and at that point, the BPX shows a mild advantage. It's worth mentioning that QD16 is well outside of the typical user workload.
If the Cardea can sustain a 200-300 MB/s performance lead in many of the tests, it will be easier to justify its $70 price premium.
Sequential Write Performance


The Team Group T-Force delivers another 200 MB/s lead over the BPX in the sequential write test at QD1 and QD2. The gap increases at QD4, and by QD8 the Cardea is nearly 400 MB/s faster. That puts it in range of the Samsung 960 EVO and OCZ RD400.
Random Read Performance


The new firmware appears to increase low-QD random performance. Surprisingly, the Phison PS5007-E7 finally breaks the 10,000 IOPS barrier at QD1. That feat took quite a while, but it was high on Phison's to-do list. The drive scales very well as we increase intensity by applying a heavier workload. The Cardea levels off at QD16, but that is well above what you will encounter even during heavy multitasking.
Four drives provide nearly 12,000 IOPS at QD1. These drives should all perform equally when launching applications, but we'll look at that later in the review.
Random Write Performance


The Cardea has the lowest QD1 random write performance. Random write performance is less of an issue than it was five years ago, but only because manufacturers have raised the bar so high. It's been a long time since we've seen high random read performance paired with lower random write performance. We'll have to study this more during real-world applications later in the review.
80 Percent Mixed SequentialWorkload
We describe our mixed workload testing in detail here and describe our steady state tests here.
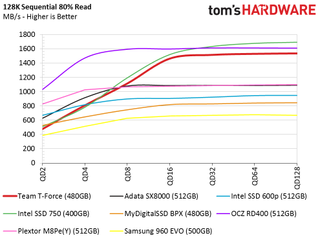
The mixed sequential test shows us that the new Phison firmware increases the 80-percent mix quite a bit over the older firmware used with the BPX 480GB. The difference measures around 150 MB/s at QD4. That is a large difference that you will certainly notice when you are loading applications and games.
80 Percent Mixed Random Workload
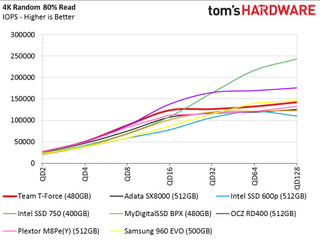
The Cardea experiences a slight increase in mixed random performance over the BPX. All of the NVMe drives are very close together, unlike what we see with SATA SSDs. The M8Pe, RD400 and T-Force Cardea drives stand out from the rest at QD8.
Sequential Steady-State


The two steady-state tests will reveal if the heat sink prevents the PS5007-E7 controller from throttling during an extended workload. This test writes sequential data to the drive for ten hours before we begin measuring performance. The charts plot 100% reads on the left side, but the test runs from right to left, starting with 100% sequential data writes.
With that in mind, follow the red (Cardea) and orange (BPX) lines from right to left. We want to stipulate these two drives run different firmware, but in steady-state conditions that plays less of a role than throttling would. The T-Force Cardea outperforms the BPX across the entire test. That is the good news. On the other side of the coin, who would write data for 10 hours straight?
Random Steady-State


This test examines performance consistency. The first graph shows 4K random writes over a two-hour period, while the second chart shows the final minutes of the test. Ideal performance is a straight line with very little change, like the Plextor M8Pe and Intel SSD 750 series. The random steady-state test reveals nearly equal performance between the two E7 SSDs. The Team Group T-Force Cardea delivers high random write performance, but it's not as consistent as some of the other products available.
PCMark 8 Real-World Software Performance
For details on our real-world software performance testing, please click here.


The Team Group T-Force Cardea is priced as a mainstream NVMe SSD, and the application performance shows it's priced appropriately. The drive falls in the middle of our chart in most applications. We hoped to see this model outperform the MyDigitalSSD BPX, but that wasn't the case. This could be related to the new firmware. We know the BPX users different NAND than the Corsair MP500, Apacer Z280, Patriot Hellfire M.2 and other E7-based drives we've tested. That may be why it performs so well in real-world application workloads.
Application Storage Bandwidth
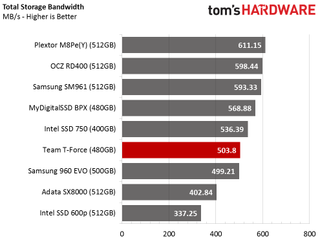
We average the test results, and the Team Group T-Force Cardea delivers just over 500 MB/s. This is a very good score, but it still trails some less expensive products.
PCMark 8 Advanced Workload Performance
To learn how we test advanced workload performance, please click here.


There are two areas we want to examine in the PCMark 8 Extended Storage Test. The first is the comparison between the MyDigitalSSD BPX 480GB ($199.99) and the Team Group T-Force Cardea 480GB ($269.99). The two E7-based products deliver identical performance results, even during the stressful steady-state portions of the test. There is very little distance between the two results. Talk about needing a feeler gauge to measure the distance.
The second focus is on the moderate bandwidth section where the drives have ample time to recover. This is the closest test we run to your real-world applications. The Cardea is in the top performance tier of existing 512GB class NVMe SSDs. There are some slightly faster NVMe SSDs, but it would be difficult to see the small improvement in real time outside of a benchmark test.
Service Time


The service time test holds more value for our readers because it's directly related to latency and the hands-on user experience. The Cardea only trails the Intel SSD 750 400GB, but it also delivers similar performance to the MyDigitalSSD BPX.
Disk Busy Time
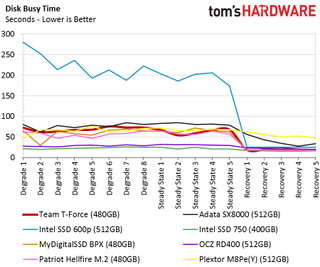
The disk busy time test measures disk activity during the test. The Intel 600p 512GB shows us exactly what we don't want to see. High results mean the drive has to work for a longer time to complete a given task, and that also leads to more power consumption. The recovery phases represent a normal user workload for most consumers. All the drives tighten up in that slice of the test. The Cardea compares well with the best 512GB NVMe SSDs on the market.
MORE: Best SSDs
MORE: How We Test HDDs And SSDs
MORE: All SSD Content
Current page: 480GB Performance Testing
Prev Page Specifications & Overview Next Page Final Analysis & VerdictStay on the Cutting Edge
Join the experts who read Tom's Hardware for the inside track on enthusiast PC tech news — and have for over 25 years. We'll send breaking news and in-depth reviews of CPUs, GPUs, AI, maker hardware and more straight to your inbox.
-
damric Just put an AIO liquid cooler on it. You know you want it.Reply
Btw typo on last page "The NAND shortage is at it speak" should be" its peak" -
bit_user ReplyI've never seen thermal throttling as a significant issue for most users.
Have you ever tried using a M.2 drive, in a laptop, for software development?
Builds can be fairly I/O intensive. Especially debug builds, where the CPU is doing little optimization and the images are bloated by debug symbols.
And laptops tend to be cramped and lack good cooling for their M.2 drives. Thus, we have a real world case for thermal throttling.
Video editing on laptops is another real world case I'd expect to trigger thermal throttling.
We test with a single thread because that's how most software addresses storage.
In normal software (i.e. not disk benchmarks, databases, or server applications), you actually have two threads. The OS kernel transparently does read prefetching and write buffering. So, even if the application is coded with a single thread that's doing blocking I/O, you should expect to see some amount of QD >= 2, in any mixed-workload scenario. About the only time you really get strictly QD=1 is for sequential reads.
That said, I'd agree that desktop users (with the possible exception of people doing lots of software builds) should care mostly about QD=1 performance and not even look at performance above QD=4. In this sense, perhaps tech journalists delving into corner cases and the I/O stress tests designed to do just that have done us all a bit of a disservice. -
bit_user Replymy grandmother always said they are not quite as audacious as RGB everything, but heat sinks do provide positive benefits ...
How I first read this.
Me: "Whoa, cool grandma."
Yeah, I read fast, mostly in a hurry to reach the benchmarks.
Seriously, you could spice up your articles with a few such devices. Maybe tech journalists would do well to cast some of their articles as short stories, in the same mold as historical fiction. You don't fictionalize the technical details - only the narrative around them.
Consider that - as odd as it might sound - it still wouldn't be quite as far out there as the Night Before Christmas pieces. The trick would be not to make it seem too forced... again, with my thoughts turning towards The Night Before Christmas pieces (as charming as they were). So, no fan fiction or Fresh Prince, please. -
bit_user ReplyWhen I started building PCs, it was common to see one fan at the bottom of the case to bring in cool air, and another on the back to exhaust warm air. I haven't seen a case with only two fans in a very long time. That doesn't mean they are not out there; it's just rare.
My workstation has a 2-fan configuration with an air-cooled 130 W CPU, 275 W GPU, quad-channel memory, the enterprise version of the Intel SSD 750, and 2 SATA drives. Front fan is 140 mm and blows cool air over the SATA drives, while rear fan is a 120 mm behind the CPU.
860 W PSU is bottom-mounted, and only spins its fan in high-load, which is rare. The graphics card has 2 axial fans. Everything stays pretty quiet, and I had no throttling issues when running multi-day CPU-intensive jobs or during the Folding @ Home contest.
In addition to that, I have an old i7-2600K that just uses the boxed CPU cooler, integrated graphics, and a single 80 mm Noctua exhaust fan, in a cheap mini-tower case. Never throttles, and I don't even hear it unless something pegs all of the CPU cores (it sits about 4' from my feet, on the other side of my UPS). It does have a top-mounted PSU, which is a Seasonic G-Series semi-modular, that I think is designed to keep its fan running full-time. It started as an experiment, but I never found a reason to increase its airflow. I haven't even dusted it in a couple years.
I'm left to conclude that you only need more than 2 big fans in cases with poor airflow, multi-GPU, or overclocking. -
mapesdhs The Comparison Products list includes the 950 Pro, but the graphs don't have results for this. Likewise, the graphs have results for the SM961, but that model is not in the Comparison Products list. A mixup here? To which model is that data actually referring?Reply
Ian.

