WD Blue 3D And SanDisk Ultra 3D SSD Review
Why you can trust Tom's Hardware
1TB Performance Testing
Comparison Products
We really like the WD Blue 3D and SanDisk Ultra 3D 1TB's price point. The SSDs come to market at $280, which is well under the Samsung 850 EVO's current $310 price point. The EVO sells for $370 at Newegg at the time of writing. The price gap provides the new WD/SanDisk drives a big enough pricing advantage to give them a little slack when it comes to performance. Many of the other products in our performance charts came to market with somewhat disappointing pricing that matches the 850 EVO.
Sequential Read Performance
To read about our storage tests in-depth, please check out How We Test HDDs And SSDs. We cover four-corner testing on page six of our How We Test guide.


It's nice to see WD/SanDisk 3D NAND products come to market at aggressive price points, but this section of the article is all about performance.
There is very little variation between the SATA 6Gb/s SSDs during the sequential read test. Surprisingly, the Mushkin Reactor, the only model with MLC flash, is the slowest. The new WD/SanDisk SSDs lead the charge with 554 MB/s of throughput, which is pretty much the limit of the SATA interface. When we tested the XG5, Toshiba told us the new flash was fast and not to focus on the TLC aspect. The underlying technology is the same for SanDisk's BiCS NAND, and it appears the impressive performance carries over to SATA products as well.
Sequential Write Performance


The two drives we're focusing on come very close to the Samsung 850 EVO in sequential write performance. The difference is small enough to overlook, but that's not the full story.
Full Usable Capacity Sequential Write Test
We wrote to the WD Blue 3D’s full addressable capacity three times, and in all three tests, we couldn't see a roll off from the SLC buffer. Unlike most other TLC-based products, the drive can write 128KB data at a queue depth (QD) of 1 up to 460 MB/s without a significant performance drop.
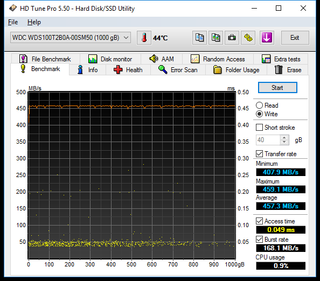
TLC BiCS NAND provides a massive improvement over older 15nm TLC, but some carry over artifacts live on. In the chart, you can see some latency outliers (yellow dots). To be fair, we also recorded outliers with Samsung's 3-bit per cell V-NAND, too.
Random Read Performance


The Blue 3D and Ultra 3D don't quite break the 10,000 IOPS watermark during the random read test. The two drives are very close and also scale well with increased intensity. Between QD4 and QD8, the two BiCS-powered SSDs surpass the 850 EVO's random read performance.
Random Write Performance


Almost all the products perform the same in low-QD random write tests. The manufacturers and controller designers have increased random write performance so much that it's not an issue for most users. There was a time when testing random write performance was a major focal point with consumer SSDs, but that day has long passed.
80% Mixed Sequential Workload
We describe our mixed workload testing in detail here and describe our steady state tests here.
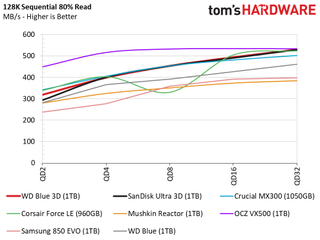
Now, mixed workload performance takes priority because your SSD is constantly reading and writing small files even without user interaction. No matter what you do on your PC, there is some mix of reads and writes. Smaller SSD manufacturers don't focus on mixed performance tuning, but larger companies have made it standard practice.
80% Mixed Random Workload
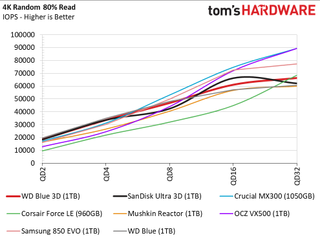
The two BiCS SSDs deliver very good sequential and mixed random performance. The drives are not always the fastest in each of the various queue depths, but they are often at the upper end of the scale.
Sequential Steady-State


We've tested the Marvell 88SS1074 4-channel controller with planar NAND and Micron's 384Gbit 3D NAND, but we came away unimpressed. You can even see two of the results in these charts with the original WD Blue and Crucial MX300. The charts show some of the better TLC (and a sole MLC) products available today. We've tested SSDs with lower 80% read results (around 120 MB/s).
The new Blue 3D and Ultra 3D stand out from the group of the best TLC-based SSDs. The drives even outperform the 850 Pro 1TB in the sequential steady-state test. Samsung designed the Pro series to address this type of workload.
Random Steady-State


The new BiCS drives do not deliver the same performance consistency that we see from MLC flash, but it is much better than most of the planar NAND SSDs we've tested. We are not keen on recommending these drives for a high-performance RAID 0 array; most will opt for faster NVMe SSDs for that task.
PCMark 8 Real-World Software Performance
For details on our real-world software performance testing, please click here.


PC Mark 8 leverages real-world software to measure performance and is such a widely used benchmark that even the SSD manufacturers recognize it as an industry standard.
The two BiCS SSDs come very close to the 850 EVO 1TB in all the tests, but they fail to overtake the EVO in any workload.
Application Storage Bandwidth
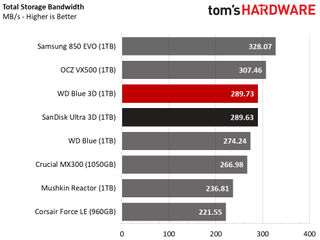
The new drives deliver around 40 MB/s less performance than the 850 EVO. On the surface, it's a loss, but once you factor in the price and "close enough" performance, it's clear that Western Digital has a winner here.
PCMark 8 Advanced Workload Performance
To learn how we test advanced workload performance, please click here.


The new BiCS SSDs obliterate the 850 EVO 1TB when they recover from a heavy workload. It's notable that the 1TB EVO is the slowest in this test compared to the other 850 EVO capacities, largely because the SSD takes longer to recover. This is actually a second-generation 850 EVO 1TB model with 48-layer V-NAND, but the drive originally came to market with 32-layer V-NAND. Samsung changed the flash to decrease costs.
Total Service Time


The service time results reveal the new WD and SanDisk drives have very tight latency numbers even under extreme duress. These are the first SATA SSDs that come within striking distance of the Samsung 850 Pro and SanDisk Extreme PRO. We've waited over three years for this day to come.
Disk Busy Time
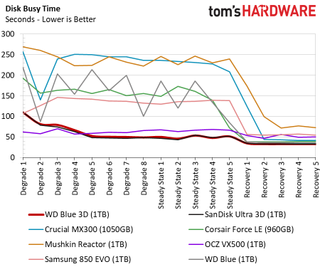
The drives delivered one of the lowest disk busy time scores we've recorded with SATA SSDs during the steady state portion of the test.
Responsiveness Test


The responsiveness score comes from a sub-test in the BAPCo SYSmark 2014 SE suite. The software uses real-world applications from Microsoft, Adobe, and others to run an office simulation and record several performance and power statistics. The responsiveness sub-test quantifies the user experience based on latency.
The new BiCS SSDs from both Western Digital and SanDisk deliver identical responsiveness scores and nearly identical power consumption results. In this section, we focus on the performance score rather than the power consumption measurement. The drives have impressive performance that beats the WD Blue released last year. The SSDs still score well under the Samsung 850 EVO, though.
Notebook Battery Life


We use BAPCo's MobileMark 2012.5 software to measure notebook battery life in a Lenovo Y700-17 gaming system. Like the SYSmark suite, MobileMark uses software from Microsoft, Adobe, and others to generate a real-world workload. In this test, we run the laptop on battery power until it expires, which allows us to test with the system buses running in a low power state. It also measures battery life with the SSD being the only variable.
MORE: Best SSDs
MORE: How We Test HDDs And SSDs
MORE: All SSD Content
Stay on the Cutting Edge
Join the experts who read Tom's Hardware for the inside track on enthusiast PC tech news — and have for over 25 years. We'll send breaking news and in-depth reviews of CPUs, GPUs, AI, maker hardware and more straight to your inbox.
-
Ne0Wolf7 Perfect timing or me, my SSD has only 20GB left. I wonder if we'll see and price changes soon...Reply -
AgentLozen Great review. You guys must think pretty highly of these SSDs if you're giving them the Editor's Choice award.Reply
A SSD that's a close competitor to the 850 EVO has been a long time coming. It's good to see that it's coming from Western Digital. When the Blue SSDs first came around, i recall that their prices were waaaay to high. WD has gotten it sorted out since then. Great for competition. Great for buyers. -
hannibal Yep... Good year!Reply
CPU competition is back because of AMD and ssd competition is coming back because of these and some other new SSDs!
Intel is going to the right direction (at last have to say, by releasing more cores to customers) I am quite sure that Samsung also have to react, so quite soon we will see better products also from there! -
Brian_R170 I just bought an Acer Spin 3 last week for my wife on Aug 7. All reviews said the laptop was good, but disk performance was abysmal, and they were right. I swapped out the 1TB Seagate 5400 RPM mechanical drive with a 1TB WD Blue on Aug 10. The difference was huge, but no way to directly compare to other SSDs. I didn't know much about the drive before purchasing, but I got a really good price on it. I was hoping I didn't make a mistake. This article puts my mind at ease.Reply -
Randall_Lind I have two WD blues 512gb one not sure they are 3D ones for a Acer laptop and HP all-in-one. The acer one life is down to 98% brought it 2/23/16. The other one is 100% brought 3/9/17/. I know Why cry over 2% but this worries me about how long it will last. if I lose 2% a year seems like a lot to me. I am using the WD SSD dashboard software. This is how I know.Reply -
Sakkura Reply20087111 said:I have two WD blues 512gb one not sure they are 3D ones for a Acer laptop and HP all-in-one. The acer one life is down to 98% brought it 2/23/16. The other one is 100% brought 3/9/17/. I know Why cry over 2% but this worries me about how long it will last. if I lose 2% a year seems like a lot to me. I am using the WD SSD dashboard software. This is how I know.
If your SSD loses 2% of its rated write endurance over the course of 18 months, that means it has enough write endurance for around 75 years of use.
Do you expect to be using your current SSDs well beyond the year 2090? -
NinjaNerd56 I use a WD SSD in my server farm; excellent results.Reply
My Christmas present to myself this year will be a 1TB or 2TB WD Blue for my game tower.
Woo hoo! -
wifiburger meh i passed on 3d ssd, i did get the wd black x4 pcie (2000 MB a sec )and wd blue ssd sata, good thing the ryzen mobo as two m.2 slots ?? less cables in my caseReply -
the nerd 389 @RANDALL_LIND, 2% is nothing, really. I'd only start to be concerned at 10-15% per year. I edit videos. I can eat through 10% in a couple of months. This is not the drive for me.Reply
@Chris: Do you think you could present the variance/standard deviation for the performance consistency section? The 10%, 1%, and 0.1% transfer rates in steady state may also be useful, although perhaps not for this drive in particular.
