HP ZR2740w Versus Asus PB278Q: QHD 27" Monitors, Tested
Until cutting-edge UHD (3840×2160) displays hit the mainstream, most enthusiasts have to be content with QHD monitors at 2560x1440 pixels. In the lab today, we have two more 27-inch QHD screens: the ZR2740w from HP and the PB278Q from Asus.
Results: Grayscale Tracking
All of the IPS panels that we’ve tested recently display excellent grayscale tracking, even at stock settings. It’s important that the color of white be consistently neutral at all light levels from darkest to brightest. Grayscale performance impacts color accuracy with regard to the secondary colors (cyan, magenta, and yellow). Since computer monitors typically have no color or tint adjustment, accurate grayscale is key.
HP ZR2740w
Since the HP has no RGB controls to adjust grayscale, we’re showing the measurement at a 200 cd/m2 brightness level.
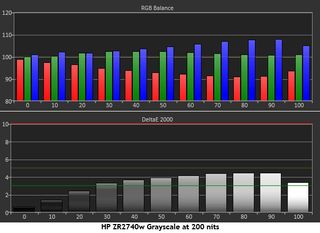
This is a fair result. Grayscale error is visible from 30 percent to 100 percent, though just barely. The overall tint is cool in tone with just a hint of blue in white parts of the image. We ran this test at both minimum and maximum brightness settings and got nearly the same results. This is a good thing in that the HP achieves the same level of accuracy no matter what its light output.
Asus PB278Q
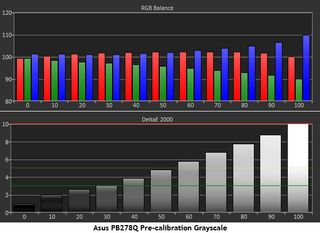
At its stock settings the PB278Q is deficient in green (a deficiency that increases as the signal level goes up). Bright images like the white background of a word processing app or Web browser look obviously blue. This measurement was taken in the User mode at the 6500K color temp preset. Standard mode looks the same as the above. sRGB mode is slightly better, though still blue in tone.
Fortunately, Asus includes RGB adjustments for both the high and low range, which is unusual for any computer monitor. This allows you dial in grayscale more precisely. Our procedure is to adjust the high range (gain) using an 80 percent signal and the low range (offset) using a 30 percent signal.
Stay on the Cutting Edge
Join the experts who read Tom's Hardware for the inside track on enthusiast PC tech news — and have for over 25 years. We'll send breaking news and in-depth reviews of CPUs, GPUs, AI, maker hardware and more straight to your inbox.
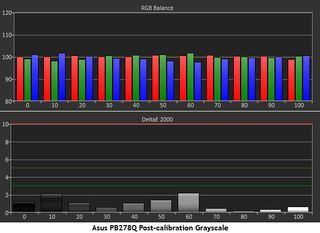
The extra adjustability allows a very accurate result in our grayscale tracking test. All the errors are now below two, except at 10 and 60 percent. In fact, most brightness levels are below one Delta E in this test. This is excellent performance.
Since most users lack the equipment to calibrate their monitors, out-of-box performance is important, especially in the grayscale metric. An error of over three Delta E is visible to the naked eye. Since most productivity apps have a white background, any tint can easily be seen.
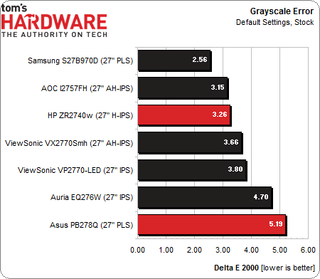
The HP finishes third in this comparison. Its average grayscale error is barely visible. In fact, most people would not notice an issue. We used this monitor exclusively for several days and found it excellent for all types of content. The value of 3.26 Delta E was measured at the maximum brightness setting. The Asus comes in at the bottom of the default settings test. While not a grievous result, an instrumented calibration will improve the performance of the PB278Q greatly.
Here’s the line-up after calibration to 200 cd/m2.
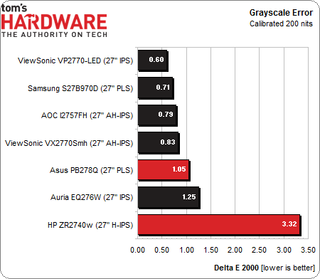
The HP doesn’t really change when its brightness is reduced from over 400 cd/m2 to 200. This is a good thing since it shows consistency. The Asus looks great after calibration, and our measurements support this observation. Its grayscale performance is right there with the best screens we’ve tested. All of the monitors we’ve reviewed recently do extremely well in this test. In fact, many far more expensive consumer televisions don’t measure this well.
Current page: Results: Grayscale Tracking
Prev Page Results: Gamma And ANSI Contrast Ratio Next Page Results: Color Gamut And Performance
Christian Eberle is a Contributing Editor for Tom's Hardware US. He's a veteran reviewer of A/V equipment, specializing in monitors. Christian began his obsession with tech when he built his first PC in 1991, a 286 running DOS 3.0 at a blazing 12MHz. In 2006, he undertook training from the Imaging Science Foundation in video calibration and testing and thus started a passion for precise imaging that persists to this day. He is also a professional musician with a degree from the New England Conservatory as a classical bassoonist which he used to good effect as a performer with the West Point Army Band from 1987 to 2013. He enjoys watching movies and listening to high-end audio in his custom-built home theater and can be seen riding trails near his home on a race-ready ICE VTX recumbent trike. Christian enjoys the endless summer in Florida where he lives with his wife and Chihuahua and plays with orchestras around the state.
-
KOKing I've had one of these HPs at work for a couple of months (replacing an early 24" 1920x1200 IPS), which I've set fairly low), but as this review says, it's not really necessary. I was a little disappointed that, possibly because of the aspect ratio change to 16:9, it doesn't _feel_ like a lot more screen real estate.Reply -
SIDDHARTH MISHRA Useless review, the uniformity on these screens is pathetic, tried three of each, the color temp difference across the screen is over 1000K. Toms has very poor reviewers, only prad.de and overclockers.ru do reliable screen reviews. And btw the U2713HM is regularly on sale for $500 or so, the ZR2740W is now an overpriced relic lacking even an OSD.Reply -
cangelini SIDDHARTH MISHRAUseless review, the uniformity on these screens is pathetic, tried three of each, the color temp difference across the screen is over 1000K. Toms has very poor reviewers, only prad.de and overclockers.ru do reliable screen reviews. And btw the U2713HM is regularly on sale for $500 or so, the ZR2740W is now an overpriced relic lacking even an OSD.Screen uniformity is covered on page eight, and low points on both screens are discussed.Reply -
flong777 Am I right by saying that the Asus monitor has more accurate color and better grayscale performance.Reply -
Marcus52 Surprised that the Asus has slightly better lag results, as one of the reasons for not having an OSD is to reduce lag, and it can make a big difference. Of course, how you measure lag can get different results, and I've seen much lower numbers for the ZR2740w:Reply
http://www.tftcentral.co.uk/reviews/hp_zr2740w_v2.htm
tftcentral is showing the HP as having far less lag than the Asus panel. -
ceberle The Asus certainly calibrates better than the HP; mainly because it can be calibrated. The HP is slightly better out of the box for grayscale and its chromaticity is also a touch better. Both screens have identical color to the eye. Only the instruments can tell the difference.Reply
Christian -
ceberle Regarding the lag results: It's hard to compare numbers from one review to another when the testing methods are so different. With our high-speed camera procedure, the only fair comparison is between the monitors we've tested. I would defend our response test as definitive though. Actually watching the screen draw in slow motion leaves no room for interpretation. The lag test is also consistent since we use the same signal chain for every screen. There is never a change in video cards, drivers, peripherals or any other device that might affect the result.Reply
Christian -
dgingeri I have the HP ZR2740w, and have for over a year now. It's a great looking monitor, and it performas well by my standards, but suffers from a significant lack of both reliability and support. HP's support is massively fragmented. It took me over three hours on the phone to get to the department that actually handled the support for this monitor. (It is a "Commercial" monitor, not business or personal. It's splitting hairs mighty thin, but that's the way HP's support is separated out.) When I finally got through, they sent a tech with a replacement monitor the next day. However, it also has two major hardware issues that render it useless when they occur. Most of the first run monitors had the power supplies die within months. The second run monitors had a serious issue with the control boards. All of them have issues with the USB hub, but it least the monitor keeps working if you don't have the USB cable plugged in. As an owner of one, I would not, under any circumstances, recommend this monitor to anyone.Reply
HP: the perfect example of a company falling apart because it is both too big and too fragmented.
