How We Test Smartphones And Tablets
Today, we outline the strict testing procedures used to obtain accurate data and discuss each test that we perform on smartphones and tablets.
CPU And System Performance
The overall user experience is greatly affected by system-level performance. How responsive is the user interface? Do Web pages scroll smoothly? How quickly do apps open? How long does it take to search for an email in the inbox? All of these things are influenced by single- and multi-threaded CPU performance, memory and storage speed, and GPU rendering. Software too plays an important role; Dynamic voltage and frequency scaling (DVFS) includes SoC specific drivers, with parameters configured by the OEM, that adjust various hardware frequencies to find a balance between performance and battery life.
Using a combination of synthetic and real-world workloads, along with data gathered by our system monitoring utility, we quantify the performance of a device at both a hardware and system level, relating these values to the overall user experience.
Basemark OS II
Basemark OS II by Basemark Ltd. is one of the few benchmarks for comparing hardware performance across platforms—it runs on Android, iOS, and Windows Phone. The individual tests are written in C++, ensuring the same code is run on each platform, and cover four main categories: System, Memory, Graphics, and Web.
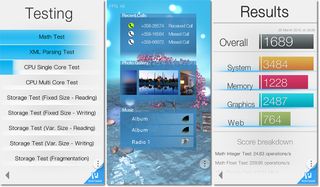
The System test scores CPU and memory performance and is composed of several subtests for evaluating both single- and multi-threaded integer and floating-point calculations. The Math subtest includes lossless data compression (for testing integer operations) and a physics simulator using eight independent threads (giving a slight advantage to multi-core CPUs). The XML Parsing subtest parses three different XML files (one file per thread) into a DOM (Document Object Model) Tree, a common operation for modern websites. Single-core CPU performance is assessed by applying a Gaussian blur filter to a 2048x2048 pixel, 32-bit image (16MB). There’s also a multi-core version of this test that uses 64 threads.
The Memory test was originally designed to measure the transfer rate of the internal NAND storage by reading and writing files with a fixed size, files varying from 65KB to 16MB, and files in a fragmented memory scenario. However, on devices with sufficient RAM (the cutoff seems to be around 1GB for Android) the operating system uses a portion of RAM to buffer storage reads/writes to improve performance. Since the files used in the Memory test are small (a necessary requirement for the benchmark to run on low-end hardware when it was created), they fit completely within the RAM buffer, turning this test into a true memory test that has little to do with storage performance.
The Graphics test uses a proprietary engine supporting OpenGL ES 2.0 on Android and iOS and DirectX11 feature level 9_3 for Windows Phone. It mixes 2D objects (simulating UI elements) and 3D objects with per-pixel lighting, bump mapping, environment mapping, multi-pass refraction, and alpha blending. The scene also includes 100 particles rendered with a single draw call to test GPU vertex operations. For scoring purposes, 500 frames are rendered offscreen with a resolution of 1920x1080.
Finally, the Web score stresses the CPU by performing 3D transformations and object resizing with CSS, and also includes an HTML5 Canvas particle physics test.
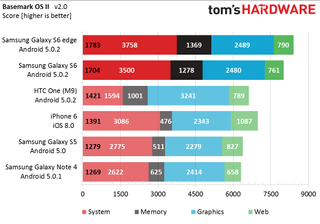
The Basemark OS II results are presented in a stacked bar chart. The scores for the individual tests are shown in white. The overall score, which is the geometric average of the individual test scores, is shown in black at the left end of each bar.
AndEBench Pro 2015
This Android only benchmark is developed by the Embedded Microprocessor Benchmark Consortium (EEMBC), with tests targeting CPU, GPU, memory, and storage performance.
The CoreMark-Pro test suite, which measures single- (one thread) and multi-core (two or more threads) CPU performance, is composed of several different algorithms designed to exercise both integer and floating-point operations. The “Base” version is compiled with the Google Native Development Kit (NDK) default compiler, while the “Peak” version uses a CPU-specific compiler meant to deliver optimal performance. The “Peak” version, which is only supported by Intel, is included for reference and is not included within the overall device score.
The Platform test performs a number of operations using Android platform SDK API calls meant to mimic real-world application scenarios, testing CPU, memory, and storage performance. It first decrypts and unpacks a file, calculating its hash to verify integrity. Inside the file is a database of contact names, a to-do list in XML format, and some pictures. Following the to-do list instructions, it performs searches within the contact database and manipulates the images. When the tasks are complete, the files are compressed, encrypted, and saved back to local storage.
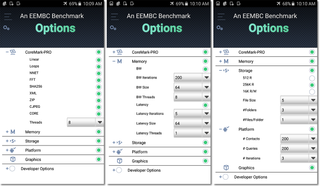
There are two different memory (RAM) tests. The Memory Bandwidth test, based on the STREAM benchmark, measures memory throughput by performing a series of read and write operations in both single- and multi-threaded modes. The geometric mean is then calculated and reported in MB/s. The Memory Latency test initializes a 64MB block of memory as a linked list, whose elements are arranged in random order. Measuring the time to traverse each node in the list, which requires fetching the next node pointer from memory for each step, provides the memory subsystem’s random access latency in number of memory elements accessed per second.
The Storage test performs a series of sequential and random reads and writes to the internal NAND storage in file sizes ranging from 512 bytes to 256KB using a single CPU thread. For each block size, access pattern, and access mode, multiple tests are repeated and the median throughput is used in the result calculation. The overall storage performance is the geometric mean of these median values and is reported in KB/s.

The 3D test measures GPU performance by running a scripted game sequence, running on a custom engine developed by Ravn Studio, offscreen with a resolution of 1920x1080. The test also runs onscreen purely as a demonstration and is not included in the final score.
The overall device score is calculated using a weighted geometric mean of all of the subtest scores with the following category weights: 25% CoreMark-PRO (base), 25% Platform, 25% 3D, 8.33% Memory Bandwidth, 8.33% Memory Latency, and 8.33% Storage. The weighted geometric mean is then scaled by 14.81661 (a factor used to calibrate the reference device to give a score of 5000) to arrive at the final score.
Geekbench 3 Pro
Primate Labs' Geekbench is a synthetic benchmark that runs on both Android and iOS as well as Windows, OS X, and Linux on the desktop. It isolates single- and multi-core CPU performance by running a series of integer workloads, including encryption, compression, route finding, and edge detection algorithms, and floating-point workloads, including matrix multiplication, fast Fourier transforms, image filters, ray tracing, and physics simulation algorithms, for each case.
There are also single- and multi-core memory tests based on the STREAM benchmark. STREAM copy measures a device’s ability to work with large data sets in memory by copying a large list of floating-point numbers. STREAM scale works the same way as STREAM copy, but multiplies each value by a constant during the copy. STREAM add takes two lists of floating-point numbers and adds them value-by-value, storing the result back to memory in a third list. Finally, STREAM triad is a combination of the add and scale workloads. It reads two lists of floating-point numbers, multiplying one of the numbers by a constant and adding the result to the other number. The end result gets written back to memory in a third list.
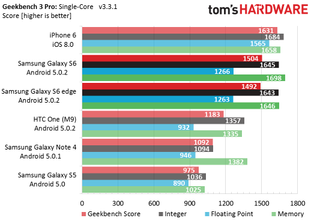
Geekbench calculates three different scores. Each individual workload gets a performance score relative to a baseline score, which happens to be 2,500 points set by a Mac mini (Mid 2011) with an Intel Core i5-2520M @ 2.50GHz processor. A section score (e.g., single-core integer) is the geometric mean of all the workload scores for that section. Finally, the Geekbench score is the weighted arithmetic mean of the three section scores.
PCMark
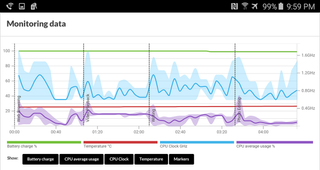
While synthetic tests like Geekbench are useful for measuring peak performance at the hardware level, it’s difficult to extrapolate these results to the system level. This is what makes the PCMark benchmark by Futuremark a valuable tool, because it measures system-level performance by running real-world workloads. Not only does it measure a device’s performance for several common scenarios, including web browsing, video playback, writing text, and photo editing, it also gives us insight into how its DVFS system is configured, which has a substantial impact on overall user experience.

The Web Browsing test uses a native Android WebView object to load and interact with a custom page meant to mimic a social networking site. Because the content is stored as local files on the device, the test is not influenced by network speed, latency, or bandwidth. The test begins by loading the initial page containing text and images; it then scrolls the page up and down, zooms into a picture, loads a set of data for the search feature, executes searches from the search box, selects an image thumbnail to add to the page, and then re-renders the page after inserting the new image. The final Web Browsing score is based on the geometric mean of the time to render and re-render the page, the time to load the search data, and the time to execute the search. It does not include the time spent scrolling and zooming.
The Video Playback test loads and plays four different videos in succession, and then performs a series of seek operations in the last video. The 1080p @ 30fps videos are encoded in H.264 with a baseline profile and a variable bit rate target of 4.5 Mb/s (maximum of 5.4 Mb/s). The test runs in landscape orientation and uses the native Android MediaPlayer API. Scoring is based on the weighted arithmetic averages for video load times, video seek times, and average playback frame rates. Frame rate has the largest effect on the score, heavily penalizing a device for dropping frames, followed by video seek time, and finally video load time.
The Writing test simulates editing multiple documents using the Android EditText view in portrait mode. The test starts by uncompressing two ZIP files (2.5MB and 3.5MB) and displaying the two text documents with images in each. All of document one is then copied and pasted into document two, creating a file with ~200,000 characters and four images. This combined document gets compressed into a 6MB ZIP file and saved to internal storage. It then performs a series of cut and paste operations, types several sentences, inserts an image, and then compresses and saves the final document in a 7.4MB ZIP file. The final score is based on a geometric mean of the times to complete these tasks.
The Photo Editing task loads and displays a source image (2048×2048 in size), applies a photo effect, displays the result, and for certain images, saves it back to internal storage in JPEG format with 90% quality. This process is repeated using 24 different photo filters and 13 unique source images, with a total of six intermediate file save operations. A total of four different APIs are used to modify the source images as shown in the table below.
| APIs used by the PCMark Photo Editing test for image processing | ||
|---|---|---|
| API | Description | Times Used |
| android.media.effect | Performs all image processing on the GPU | 15 |
| android.support.v8.renderscript | Uses the RenderScript Intrinsics functions that support multi-core CPU or GPU processing | 3 |
| android-jhlabs | Runs Java-based filters on the CPU | 4 |
| android.graphics | Handles drawing to the screen directly | 2 |
The Photo Editing score includes a geometric mean of three parameters: the geometric mean of the time to apply the RenderScript effects, the geometric mean of the time to apply the Java and android.graphics effects, and the time to apply the android.media.effect effects. This final parameter also includes the time to perform file loads and saves, image compression/decompression, and an additional face detection test.
The scores we report come from the PCMark battery test, which loops all four tests and provides a larger sample size. The scores are simply the geometric mean of the scores achieved on each individual pass. There’s also an overall Work performance score, which is the geometric mean of the four category scores.
TabletMark 2014
Like PCMark, TabletMark 2014 by BAPCo is a system-level benchmark with workloads meant to mimic common usage scenarios. Unlike PCMark which only runs on Android, TabletMark 2014 is cross-platform, supporting Windows, Windows RT, Android, and iOS. The only caveat is that it requires a 7-inch or larger screen, limiting it to tablets only.
This benchmark uses platform APIs wherever possible to measure performance for two different scenarios. It also computes an overall performance score which is the geometric mean of the two scenario scores.


The Web and Email scenario measures Web browsing performance by loading 34 pages (all from local files) that include HTML5, CSS, and JavaScript. Email performance is measured by accessing and displaying messages from a 70MB mailbox file, which includes file compression/decompression and AES encryption/decryption tasks. There’s also a note taking test that manipulates small text files.
The Photo and Video editing scenario does just what it says. It applies various filters and image adjustments to eight 14MP images. It also tests floating-point and integer math with an HDR filter written in C. There’s also two video transcoding projects: a 40MB movie composed of four smaller clips and a 13MB movie composed of two smaller clips with a B&W filter applied. The output video is encoded with H.264 at 1080p and 8Mb/s bit rate.
MobileXPRT 2013
Principled Technologies' MobileXPRT 2013 for Android consists of 10 real-world test scenarios split into two categories of testing: Performance and User Experience. The Performance suite contains five tests: Apply Photo Effects, Create Photo Collages, Create Slideshow, Encrypt Personal Content, and Detect Faces to Organize Photos. Performance results are measured in seconds. The User Experience suite also has five tests: List Scroll, Grid Scroll, Gallery Scroll, Browser Scroll, and Zoom and Pinch. These results are measured in frames per second. The category scores are generated by taking a geometric mean of the ratio between a calibrated machine (Motorola's Droid Razr M) and the test device for each subtest.
How a device achieves a score in this benchmark is more important than the score itself—most devices hit the 60fps vsync limit in the User Experience tests and the Performance tests are largely redundant. Its real-world scenarios provide insight into a device’s DVFS system, which directly effects the perceived user experience.
Current page: CPU And System Performance
Prev Page Camera Performance And Photo Quality Next Page Web Browsing BenchmarksStay on the Cutting Edge
Join the experts who read Tom's Hardware for the inside track on enthusiast PC tech news — and have for over 25 years. We'll send breaking news and in-depth reviews of CPUs, GPUs, AI, maker hardware and more straight to your inbox.
-
blackmagnum Thank you for clearing this up, Matt. I am sure us readers will show approval with our clicks and regular site visits.Reply -
falchard My testing methods amount to looking for the Windows Phone and putting the trophy next to it.Reply -
WyomingKnott It's called a phone. Did I miss something? Phones should be tested for call clarity, for volume and distortion, for call drops. This is a set of tests for a tablet.Reply -
MobileEditor ReplyIt's called a phone. Did I miss something? Phones should be tested for call clarity, for volume and distortion, for call drops. This is a set of tests for a tablet.
It's ironic that the base function of a smartphone is the one thing that we cannot test. There are simply too many variables in play: carrier, location, time of day, etc. I know other sites post recordings of call quality and bandwidth numbers in an attempt to make their reviews appear more substantial and "scientific." All they're really doing, however, is feeding their readers garbage data. Testing the same phone at the same location but at a different time of day will yield different numbers. And unless you work in the same building where they're performing these tests, how is this data remotely relevant to you?
In reality, only the companies designing the RF components and making the smartphones can afford the equipment and special facilities necessary to properly test wireless performance. This is the reason why none of the more reputable sites test these functions; we know it cannot be done right, and no data is better than misleading data.
Call clarity and distortion, for example, has a lot to do with the codec used encode the voice traffic. Most carriers still use the old AMR codec, which is strictly a voice codec rather than an audio codec, and is relatively low quality. Some carriers are rolling out AMR wide-band (HD-Voice), which improves call quality, but this is not a universal feature. Even carriers that support it do not support it in all areas.
What about dropped calls? In the many years of using a cell phone, I can count the number of dropped calls I've had on one hand (that were not the result of driving into a tunnel or stepping into an elevator). How do we test something that occurs randomly and infrequently? If we do get a dropped call, is it the phone's fault or the network's? With only signal strength at the handset, it's impossible to tell.
If there's one thing we like doing, it's testing stuff, but we're not going to do it if we cannot do it right.
- Matt Humrick, Mobile Editor, Tom's Hardware -
WyomingKnott The reply is much appreciated.Reply
Not just Tom's (I like the site), but everyone has stopped rating phones on calls. It's been driving me nuts. -
KenOlson Matt,Reply
1st I think your reviews are very well done!
Question: is there anyway of testing cell phone low signal performance?
To date I have not found any English speaking reviews doing this.
Thanks
Ken -
MobileEditor Reply1st I think your reviews are very well done!
Question: is there anyway of testing cell phone low signal performance?
Thanks for the compliment :)
In order to test the low signal performance of a phone, we would need control of both ends of the connection. For example, you could be sitting right next to the cell tower and have an excellent signal, but still have a very slow connection. The problem is that you're sharing access to the tower with everyone else who's in range. So you can have a strong signal, but poor performance because the tower is overloaded. Without control of the tower, we would have no idea if the phone or the network is at fault.
You can test this yourself by finding a cell tower near a freeway off-ramp. Perform a speed test around 10am while sitting at the stoplight. You'll have five bars and get excellent throughput. Now do the same thing at 5pm. You'll still have five bars, but you'll probably be getting closer to dialup speeds. The reason being that the people in those hundreds of cars stopped on the freeway are all passing the time by talking, texting, browsing, and probably even watching videos.
- Matt Humrick, Mobile Editor, Tom's Hardware