How We Test Smartphones And Tablets
Today, we outline the strict testing procedures used to obtain accurate data and discuss each test that we perform on smartphones and tablets.
GPU And Gaming Performance
Fueled by dramatic increases in mobile GPU performance and increasing familiarity with touch-based controls, developers both big and small are creating a rich gaming ecosystem for our phones and tablets. But just like on the desktop, better looking graphics and higher resolution screens require faster GPUs and more memory bandwidth. The synthetic and real-world game engine tests in this section probe the various aspects of GPU performance to identify weak points that might ruin the fun.
3DMark: Ice Storm Unlimited
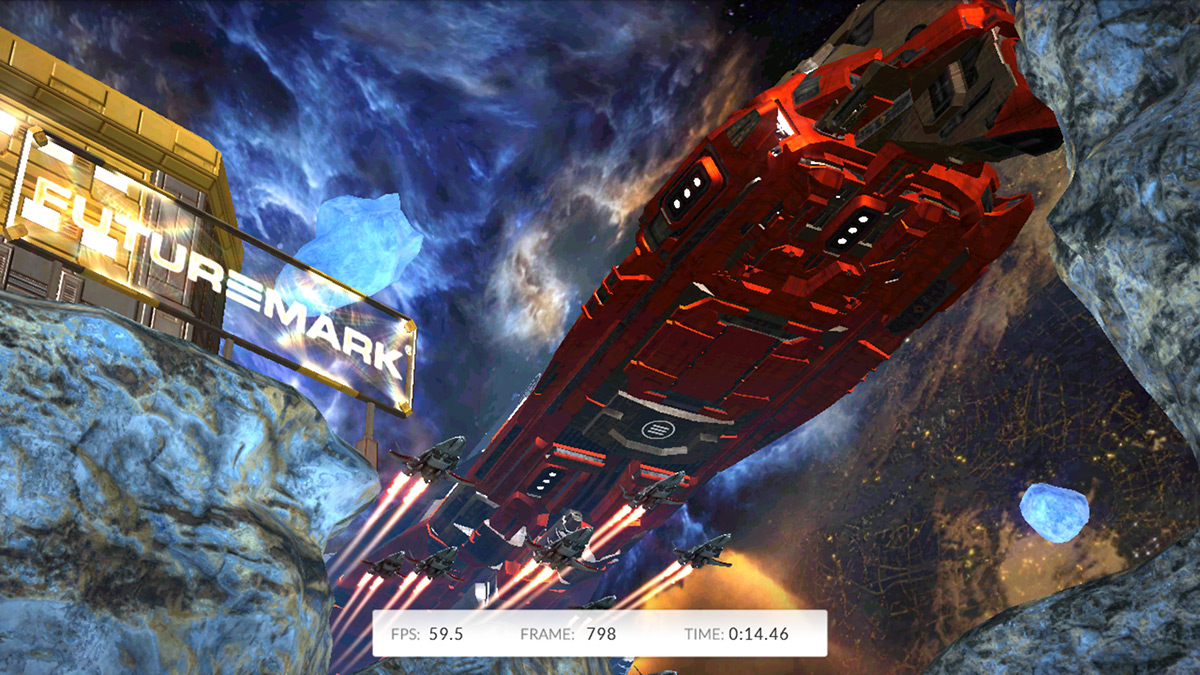
This test by Futuremark includes two different graphics tests and a CPU-based physics simulation. It’s a cross-platform benchmark that targets DirectX 11 feature level 9 on Windows and Windows RT and OpenGL ES 2.0 on Android and iOS. The graphics tests use low-quality textures and a GPU memory budget of 128MB. All tests render offscreen at 1280x720 to avoid vsync limitations and display resolution scaling. These features allow hardware performance comparisons between devices and even across platforms.

The two different graphics tests stress vertex and pixel processing separately. Graphics test 1 focuses on vertex processing while excluding pixel related tasks like post-processing and particle effects. Graphics test 2 uses fewer polygons without shadows to minimize vertex operations, while boosting overall pixel count by including particle effects. This second test measures a system’s ability to read textures, write to render targets, and add post-processing effects such as bloom, streaks, and motion blur. The table below summarizes the differences in geometry and pixel count between the two graphics tests.
| Test | Vertices | Triangles | Pixels |
|---|---|---|---|
| Graphics test 1 | 530,000 | 180,000 | 1.9 million |
| Graphics test 2 | 79,000 | 26,000 | 7.8 million |
The Physics test uses the Bullet Open Source Physics Library to perform game-based physics simulations on the CPU. It uses one thread per available CPU core to run four simulated worlds, each containing two soft and two rigid bodies colliding. Each frame of the soft-body vertex data is sent to the GPU. Because the soft-body objects use a data structure that requires random memory access patterns, SoCs whose memory controller is optimized for serial rather than random memory access perform poorly.
The performance of each graphics test is measured in frames per second, and the graphics score is the harmonic mean of these results times a constant. The Physics test score is just the raw frames per second performance times a constant. The overall score is a weighted harmonic mean of the graphics and physics scores.
BaseMark X
This benchmark by Basemark Ltd. is built on top of a real-world game engine, Unity 4.2.2, and runs on Android, iOS, and Windows Phone. It includes two different tests—Dunes and Hangar—which stress the GPU with lighting effects, particles, dynamic shadows, shadow mapping, and other post-processing effects found in modern games. With as many as 900,000 triangles per frame, these tests also strain the GPU’s vertex processing capabilities. The tests target DirectX 11 feature level 9_3 on Windows and OpenGL ES 2.0 on Android and iOS.

Both tests are run offscreen at 1920x1080 (for direct comparison of hardware across devices) and onscreen at the device’s native resolution using default settings (antialiasing disabled). The same set of tests are run at both medium- and high-quality settings. Each test reports the average frames per second after rendering the entire scene. The final score is an equal combination of the offscreen Dunes and Hangar tests, normalized to the performance of a Samsung Galaxy S4.
Get Tom's Hardware's best news and in-depth reviews, straight to your inbox.

GFXBench 3.0
GFXBench by Kishonti is a full graphics benchmarking suite, including two high-level, 3D gaming tests (Manhattan, T-Rex) for measuring real-world gaming performance and five low-level tests (Alpha Blending, ALU, Fill, Driver Overhead, Render Quality) for measuring hardware-level performance. It’s also cross-platform, supporting Windows 8 and Mac OS X on the desktop with OpenGL; Android and iOS with OpenGL ES; and Windows 8, Windows RT, and Windows Phone with DirectX 11 feature level 9/10.
All of the tests are run offscreen at 1920x1080, to facilitate direct comparisons between devices/hardware, and onscreen at the device’s native resolution, to see how the device handles the actual number of pixels supported by its screen. The tests are run using default settings and are broken into three run groups (Manhattan, T-Rex, and low-level tests) with a cooling period in between to mitigate thermal throttling, which can occur if all the tests are run back-to-back.
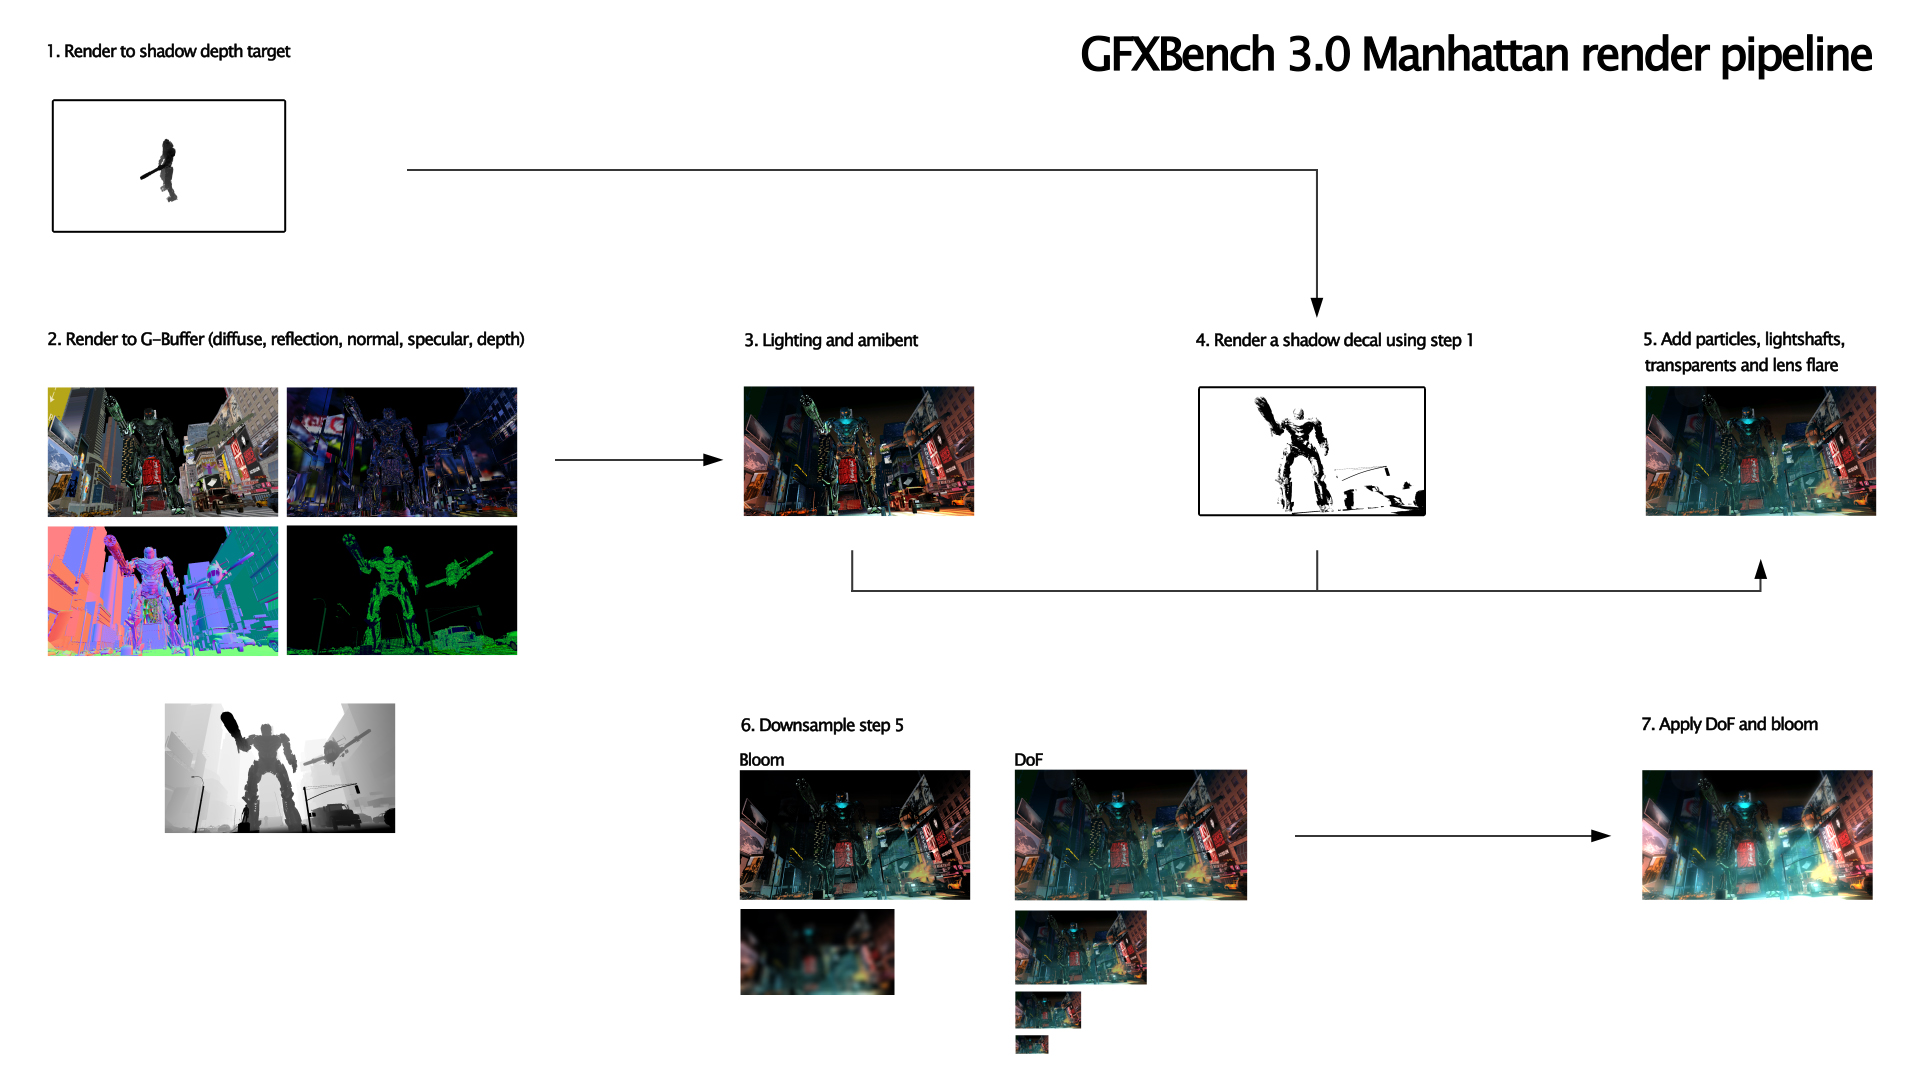
Manhattan: This OpenGL ES 3.0 based game simulation includes several modern effects, including diffuse and specular lighting with more than 60 lights, cube map reflection and emission, triplanar mapping, and instanced mesh rendering, along with post-processing effects like bloom and depth of field. The geometry pass employs multiple render targets and uses a combination of traditional forward and more modern deferred rendering processes in separate passes. Its graphics pipeline awards architectures proficient in pixel shading.


T-Rex: This demanding OpenGL ES 2.0 based game simulation is as much a stress test as it is a performance test, pushing the GPU hard and generating a lot of heat. While not as dependent on pixel shading as Manhattan, this test still uses a number of visual effects such as motion blur, parallax mapping, planar reflections, specular highlights, and soft shadows. Its more balanced rendering pipeline also uses complex geometry, high-res textures, and particles.

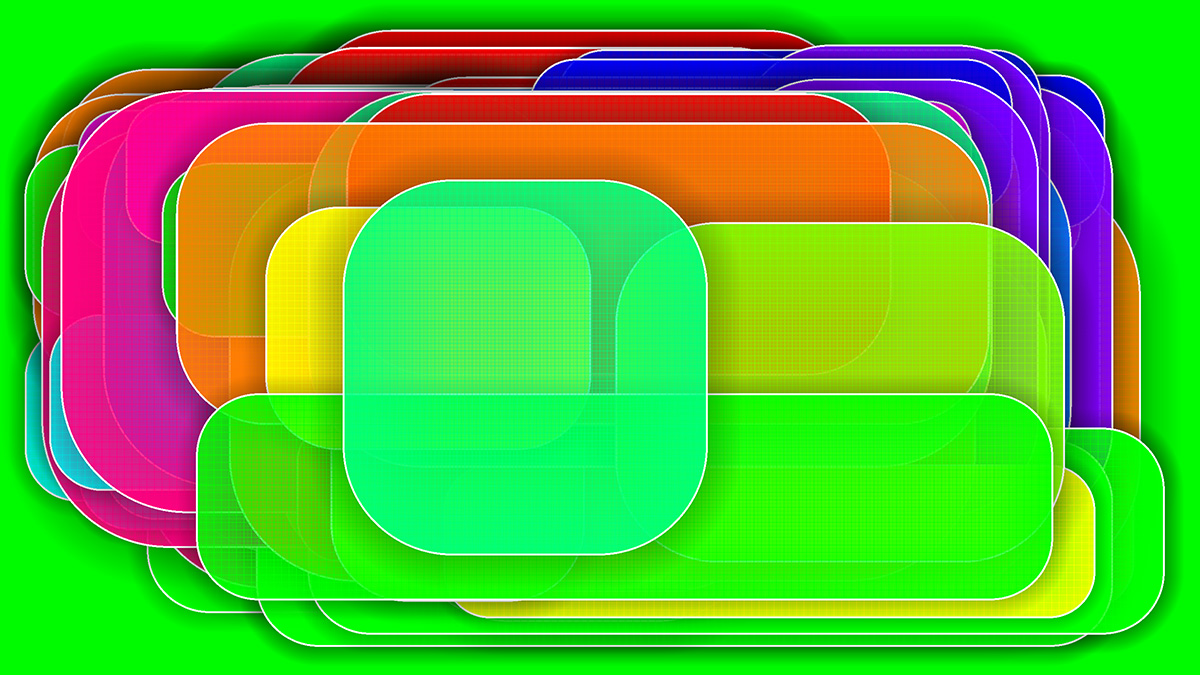
Alpha Blending: This synthetic test measures a GPU’s alpha-blended overdraw capability by layering 50 semi-transparent rectangles and measuring the frame rate. Rectangles are added or removed until the rendered scene runs steadily between 20 and 25 FPS. Performance is reported in MB/s, which represents the total number of different sized layers blended together, an important metric for hardware-accelerated UIs and games that include translucent surfaces.
This test is highly dependent on GPU memory bandwidth, since it uses high-resolution, uncompressed textures and requires reading/writing to the frame buffer (memory) during alpha blending. It also stresses the back-end of the rendering pipeline (ROPs) rasterizing the frame. Because all of the onscreen objects are transparent, GPUs see no benefit from early z-buffer optimizations.
ALU: This test measures pixel shader compute performance, an important metric for visually-rich modern games, by rendering a scene with rippling water and lighting effects like reflection and refraction. Performance is measured in frames per second. The onscreen results are vsync limited (60fps) for most GPUs, but the offscreen test is still useful for comparing the ALU performance of different devices.
Fill: The fill test measures texturing performance (in millions of texels per second) by rendering four layers of compressed textures. This test combines aspects of both the alpha blending and ALU tests, since it depends on both pixel processing performance and frame buffer bandwidth.


From left to right: Alpha Blending, ALU, Fill
Driver Overhead: This test measures the graphics driver’s CPU overhead by rendering a large number of simple objects one-by-one, continuously changing the state of each object. Issuing separate draw calls for every object stresses both hardware (CPU) and software (graphics API and driver efficiency). While the GPU does render each scene, its impact on the overall score (given in frames per second) is minimal.
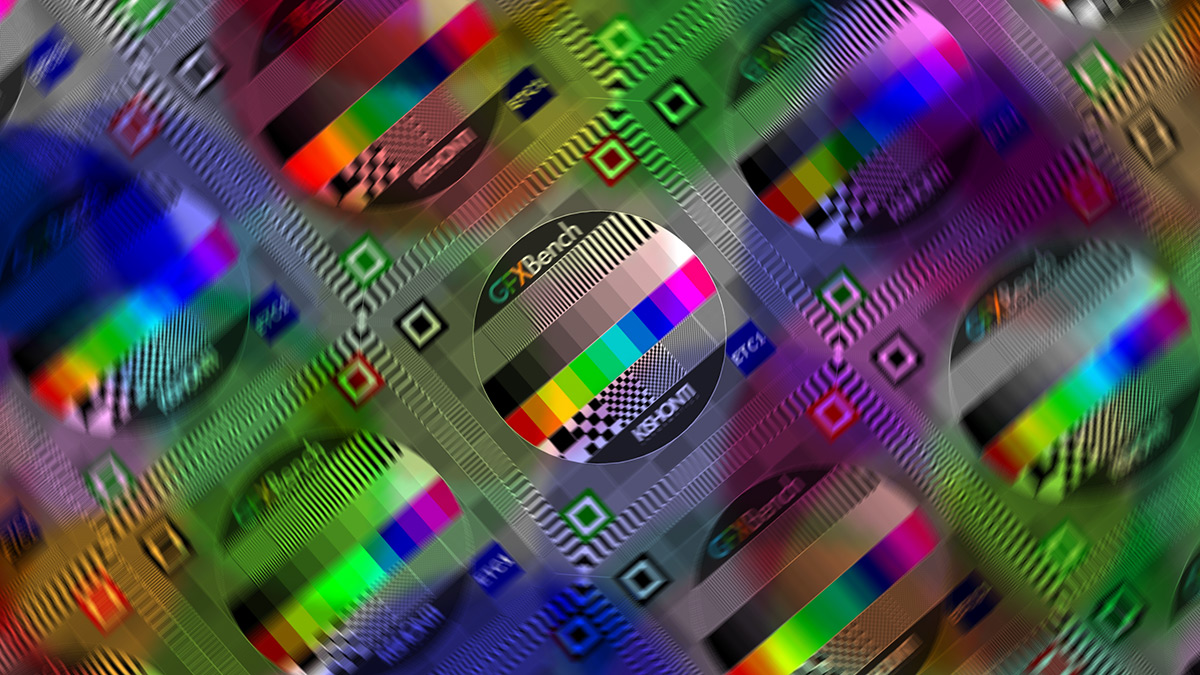
Render Quality: This test compares a single rendered frame from T-Rex to a reference image, computing the peak signal-to-noise ratio (PSNR) based on mean square error (MSE). The test value, measured in milliBels, reflects the visual fidelity of the rendered image. The primary purpose of this test is to make sure that the GPU driver is not “optimizing” (i.e. cheating) for performance by sacrificing quality.
-
blackmagnum Thank you for clearing this up, Matt. I am sure us readers will show approval with our clicks and regular site visits.Reply -
falchard My testing methods amount to looking for the Windows Phone and putting the trophy next to it.Reply -
WyomingKnott It's called a phone. Did I miss something? Phones should be tested for call clarity, for volume and distortion, for call drops. This is a set of tests for a tablet.Reply -
MobileEditor ReplyIt's called a phone. Did I miss something? Phones should be tested for call clarity, for volume and distortion, for call drops. This is a set of tests for a tablet.
It's ironic that the base function of a smartphone is the one thing that we cannot test. There are simply too many variables in play: carrier, location, time of day, etc. I know other sites post recordings of call quality and bandwidth numbers in an attempt to make their reviews appear more substantial and "scientific." All they're really doing, however, is feeding their readers garbage data. Testing the same phone at the same location but at a different time of day will yield different numbers. And unless you work in the same building where they're performing these tests, how is this data remotely relevant to you?
In reality, only the companies designing the RF components and making the smartphones can afford the equipment and special facilities necessary to properly test wireless performance. This is the reason why none of the more reputable sites test these functions; we know it cannot be done right, and no data is better than misleading data.
Call clarity and distortion, for example, has a lot to do with the codec used encode the voice traffic. Most carriers still use the old AMR codec, which is strictly a voice codec rather than an audio codec, and is relatively low quality. Some carriers are rolling out AMR wide-band (HD-Voice), which improves call quality, but this is not a universal feature. Even carriers that support it do not support it in all areas.
What about dropped calls? In the many years of using a cell phone, I can count the number of dropped calls I've had on one hand (that were not the result of driving into a tunnel or stepping into an elevator). How do we test something that occurs randomly and infrequently? If we do get a dropped call, is it the phone's fault or the network's? With only signal strength at the handset, it's impossible to tell.
If there's one thing we like doing, it's testing stuff, but we're not going to do it if we cannot do it right.
- Matt Humrick, Mobile Editor, Tom's Hardware -
WyomingKnott The reply is much appreciated.Reply
Not just Tom's (I like the site), but everyone has stopped rating phones on calls. It's been driving me nuts. -
KenOlson Matt,Reply
1st I think your reviews are very well done!
Question: is there anyway of testing cell phone low signal performance?
To date I have not found any English speaking reviews doing this.
Thanks
Ken -
MobileEditor Reply1st I think your reviews are very well done!
Question: is there anyway of testing cell phone low signal performance?
Thanks for the compliment :)
In order to test the low signal performance of a phone, we would need control of both ends of the connection. For example, you could be sitting right next to the cell tower and have an excellent signal, but still have a very slow connection. The problem is that you're sharing access to the tower with everyone else who's in range. So you can have a strong signal, but poor performance because the tower is overloaded. Without control of the tower, we would have no idea if the phone or the network is at fault.
You can test this yourself by finding a cell tower near a freeway off-ramp. Perform a speed test around 10am while sitting at the stoplight. You'll have five bars and get excellent throughput. Now do the same thing at 5pm. You'll still have five bars, but you'll probably be getting closer to dialup speeds. The reason being that the people in those hundreds of cars stopped on the freeway are all passing the time by talking, texting, browsing, and probably even watching videos.
- Matt Humrick, Mobile Editor, Tom's Hardware