Intel Core i9-14900KS Review: The Last Core i9 Hits Record 6.2 GHz at Stock Settings
6.2 GHz and a whole lotta power draw.
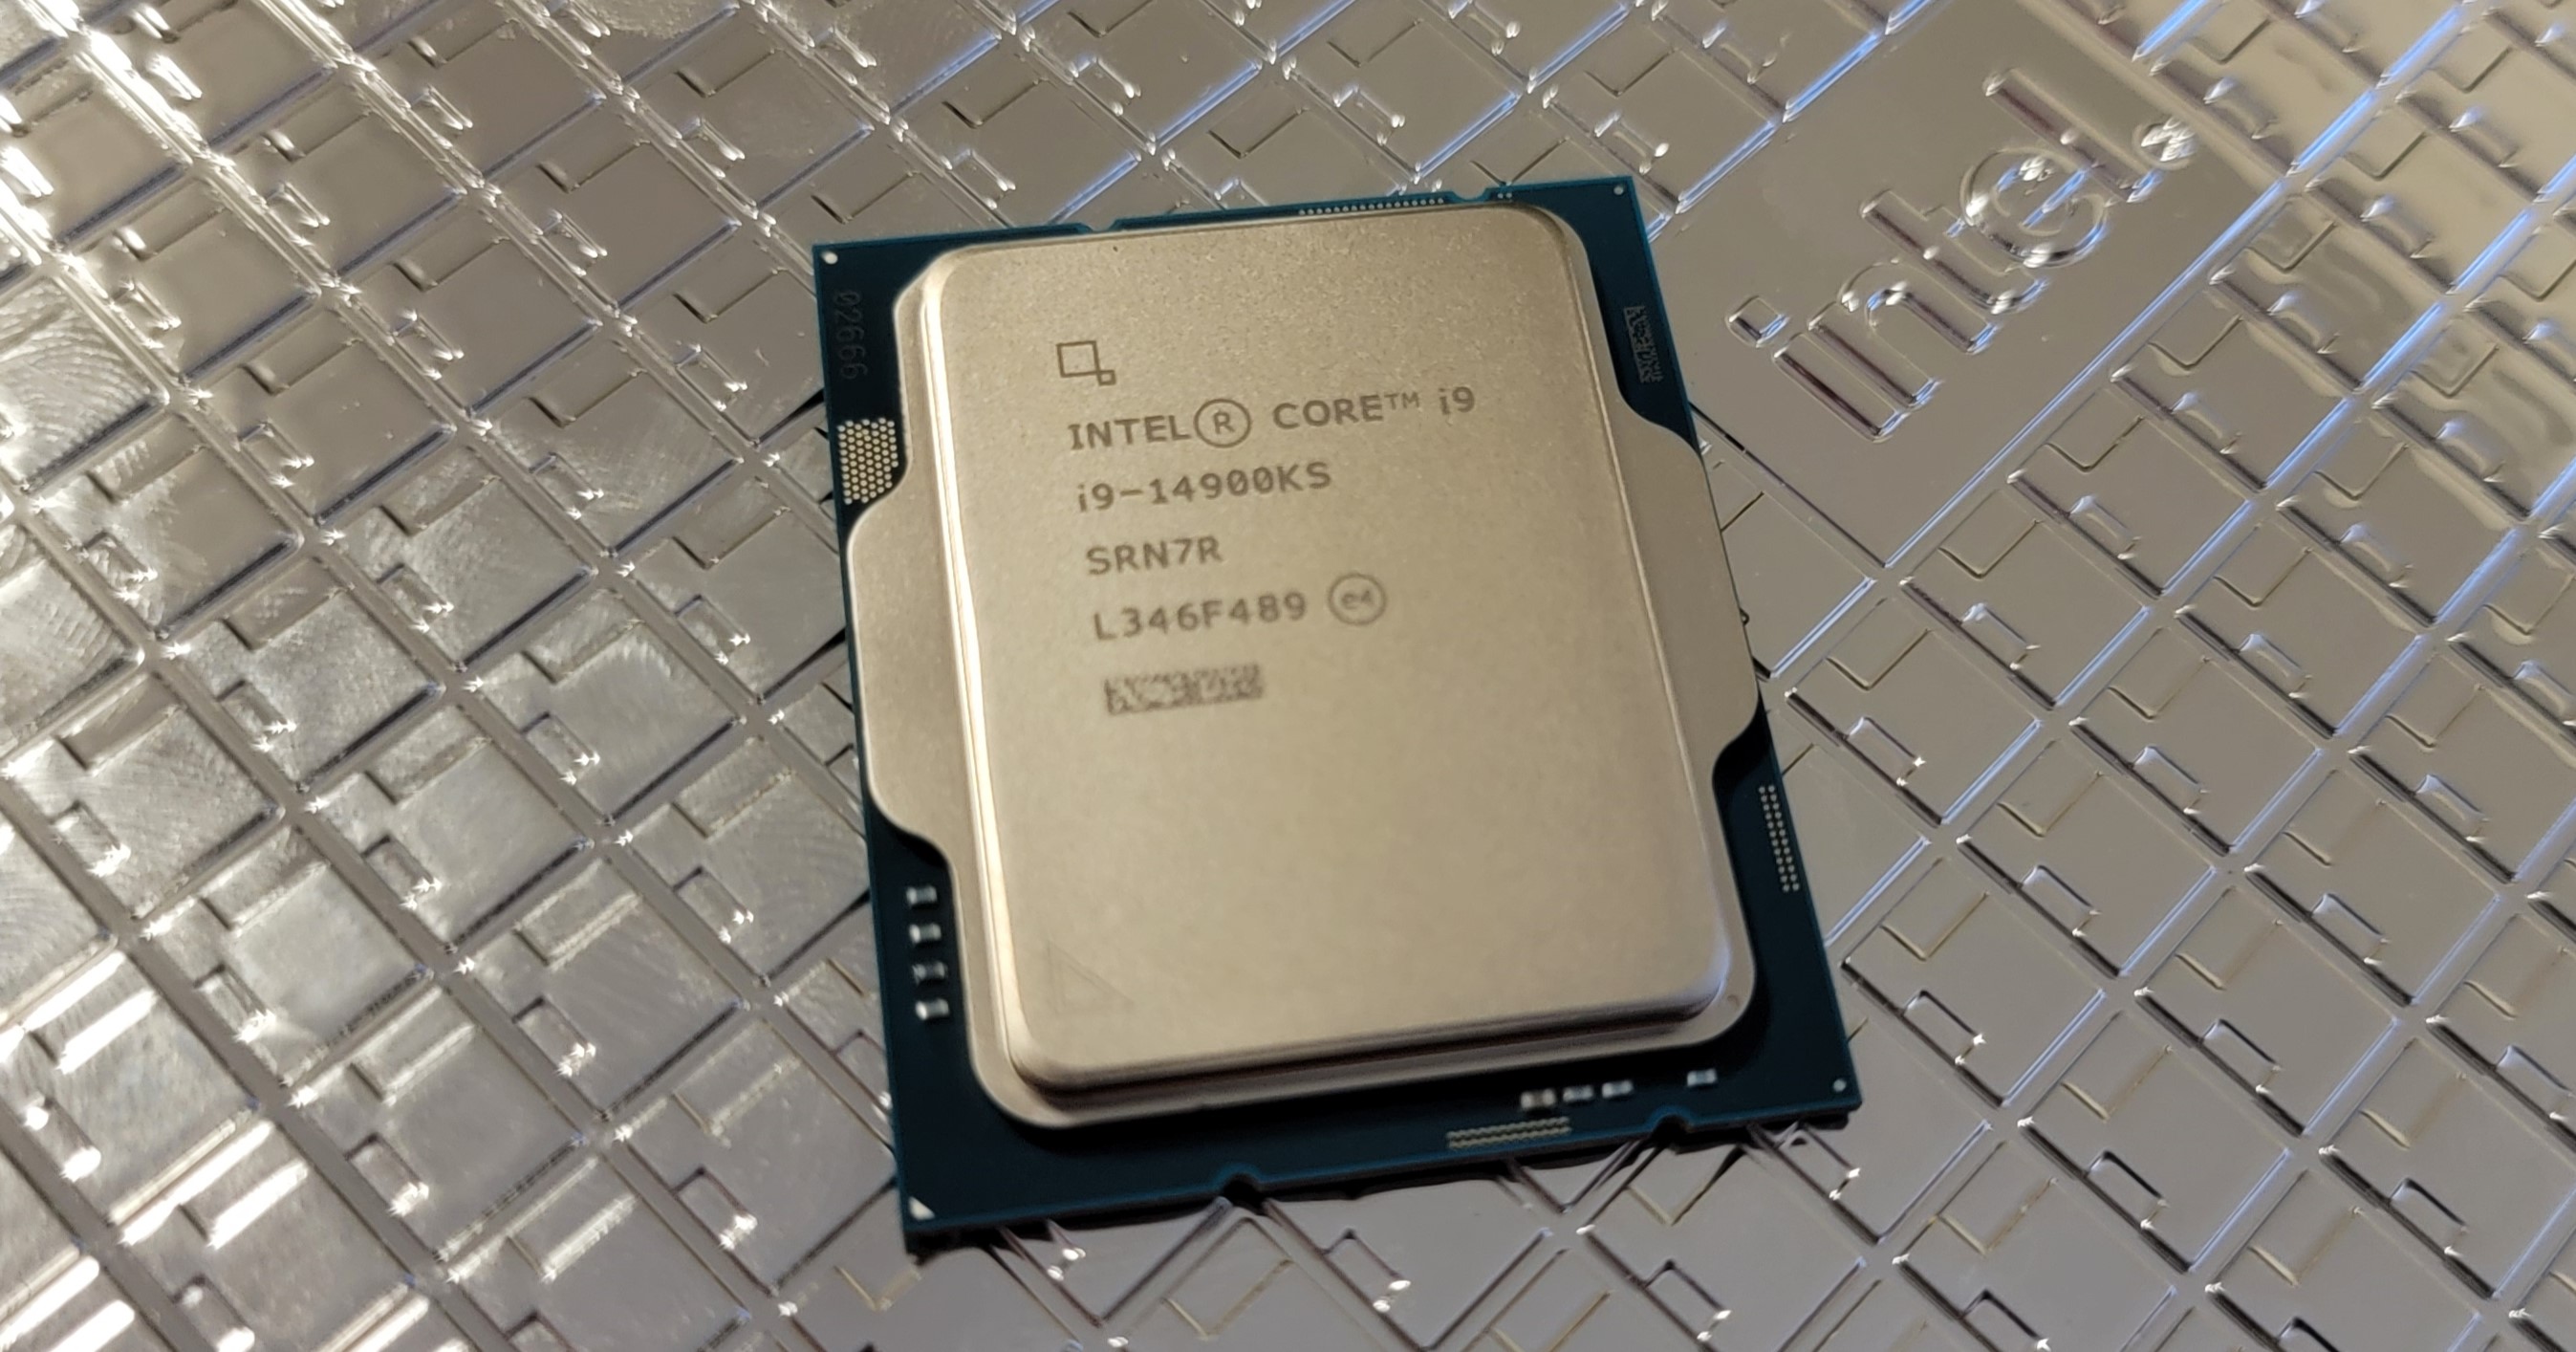
Intel's Core i9-14900KS Special Edition processor has the highest clock rate of any desktop PC processor yet, blasting up to 6.2 GHz on two cores and allowing Intel to claim once again that it has the fastest desktop processor in the world. But at $689, the 14900KS is not only Intel's fastest mainstream chip, it's also the priciest. The 14900KS faces off with AMD's brutally competitive Ryzen 7000X3D processors, which still hold the title of the fastest gaming chips around, albeit with a narrowing margin, as Intel seeks to dethrone AMD's top processors on our list of the best CPUs for gaming.
The 14900KS will also be the last Core i9 processor, with Intel shifting to a new branding scheme with its next-gen chips. Like Intel's past Special Edition chips, the Core i9-14900KS is forged from the company's highest-binned silicon to deliver the fastest processing speeds at the lowest possible voltages at any given frequency. This allows it to hit the previously unheard of 6.2 GHz on two cores right out of the box, using conventional cooling. However, Intel throws power consumption out the window to hit peak performance: The 14900KS gobbled up to 325W of power in our testing.
| Price | P-Core Base / Boost Clock (GHz) | Cores / Threads (P+E) | E-Core Base / Boost Clock (GHz) | Cache (L2/L3) | TDP / PBP / MTP | Memory | |
|---|---|---|---|---|---|---|---|
| Core i9-14900K / KF | $689 | 3.2 / 6.2 | 24 / 32 (8+16) | 2.4 / 4.5 | 68MB (32+36) | 150W / 253W / 320W | DDR4-3200 / DDR5-5600 |
| Core i9-14900K / KF | $589 (K) - $564 (KF) | 3.2 / 6.0 | 24 / 32 (8+16) | 2.4 / 4.4 | 68MB (32+36) | 125W / 253W | DDR4-3200 / DDR5-5600 |
The 14900KS is mostly a carbon copy of the standard Core i9-14900K. It has the same physical design with eight threaded P-cores and 16 single-threaded E-cores. The primary difference is that the 14900KS's P-cores have a 200 MHz higher Thermal Velocity Boost (TVB) than the standard 14900K, meaning the chip can hit 6.2 GHz on two cores if it remains under 70C. The P-cores are also 100 MHz faster during standard Turbo Boost 3.0, while the E-cores have a 100 MHz boost clock increase.
The Core i9-14900KS drops into the same platform and supports the same features as the rest of the 14th Gen Raptor Lake Refresh processors (you can find the deep-dive details here), but there are plenty of special considerations.
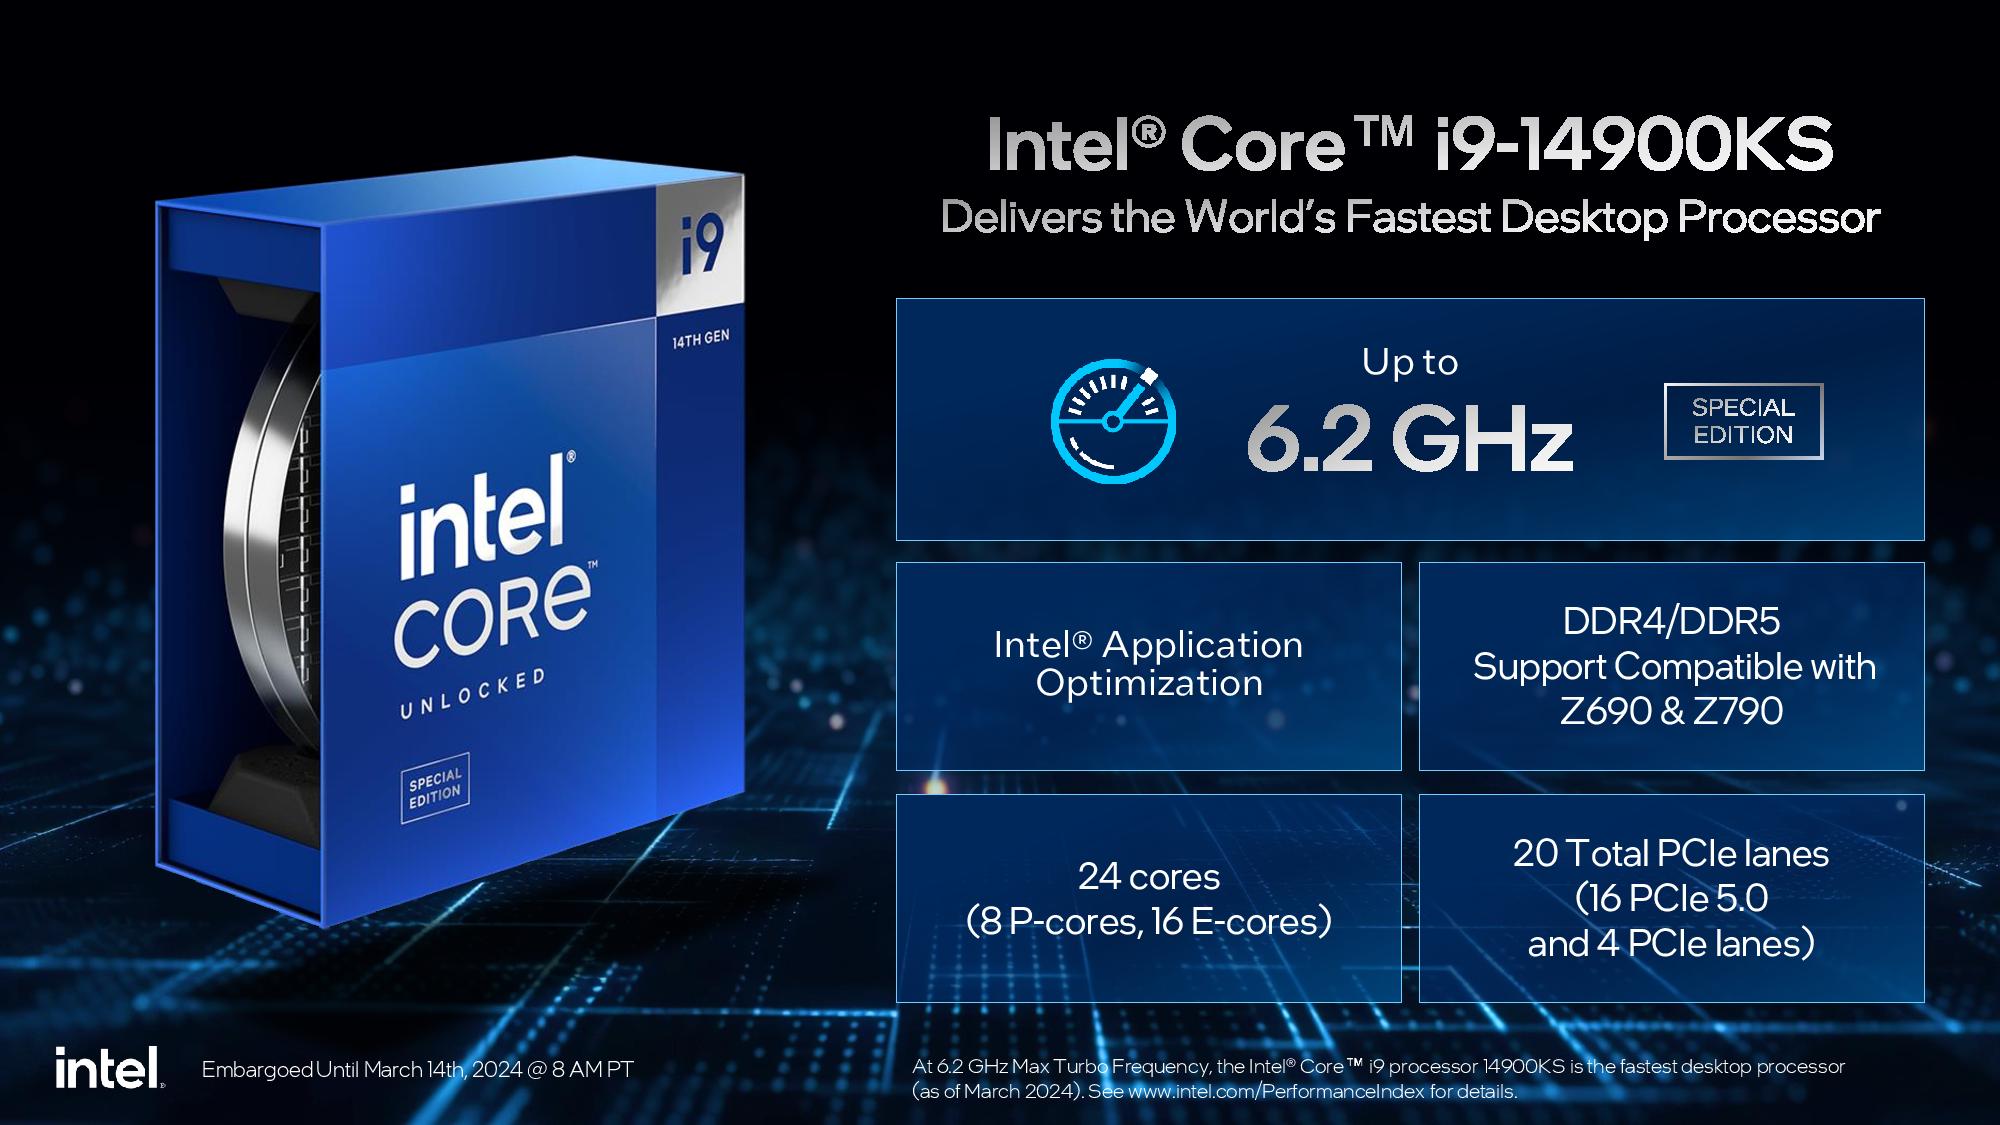
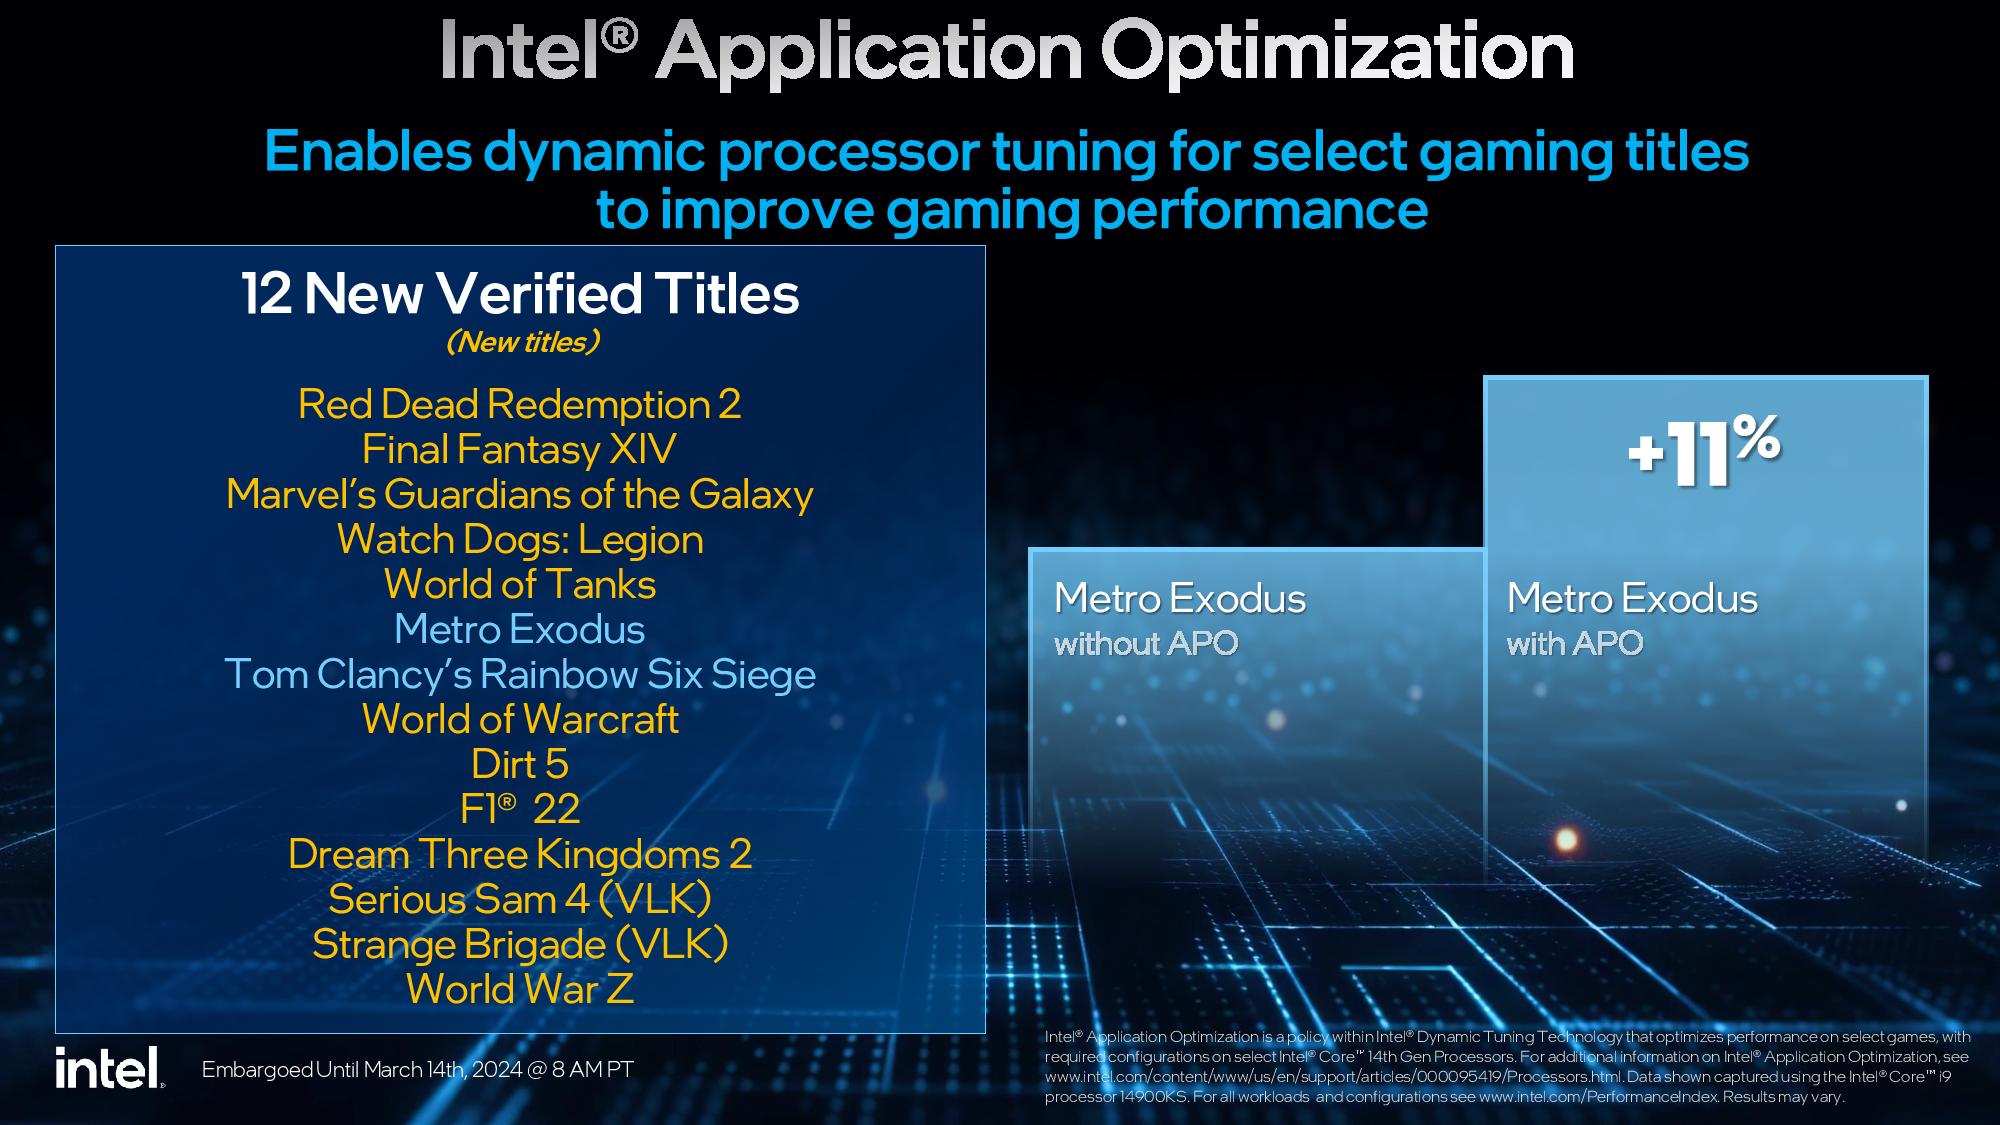
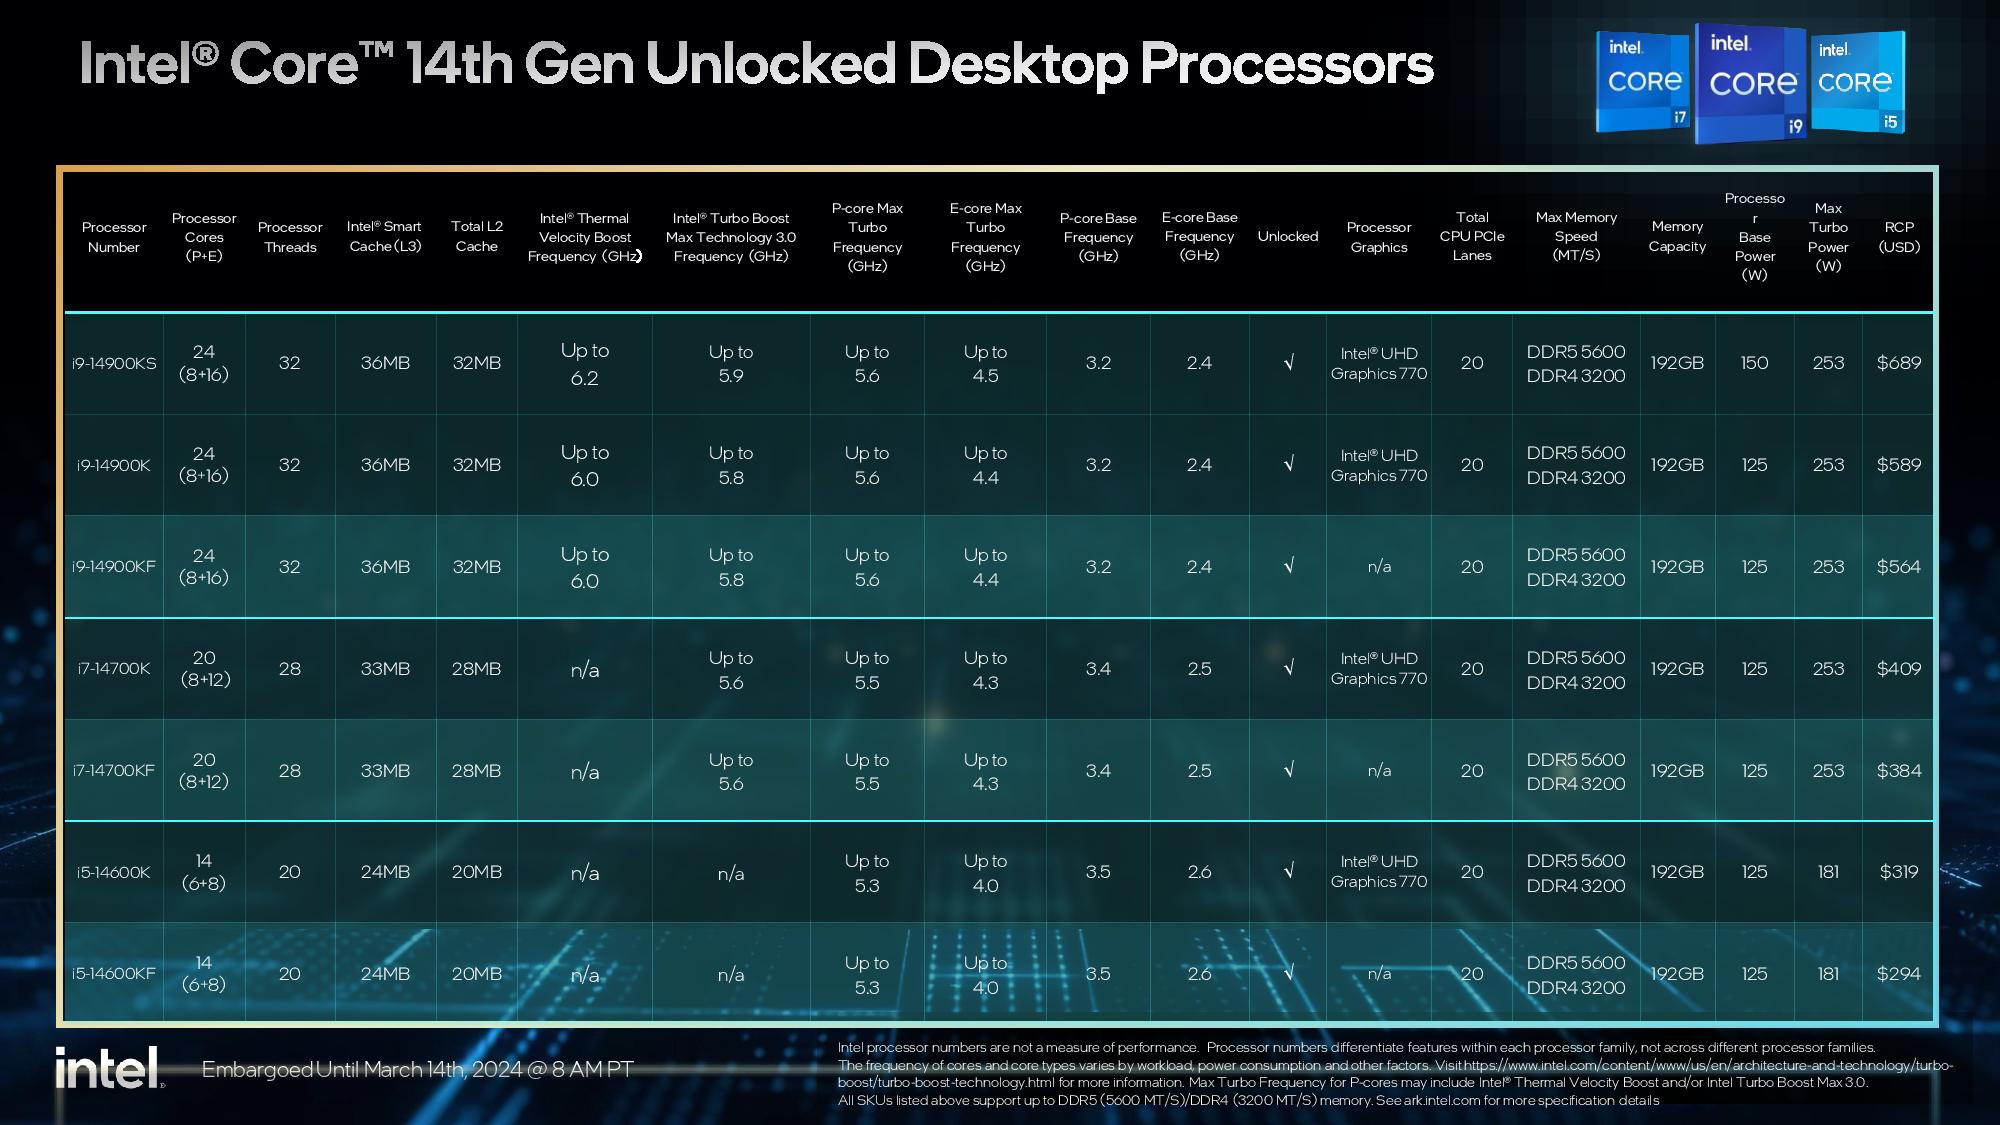
As with the standard Raptor Lake Refresh models, Intel turns on a new list-based Application Optimization (APO) feature by default. This tool automatically detects certain programs and adjusts processing resources in real-time to optimize thread scheduling/affinities and application threading to boost gaming performance. As you can see in the slides above, APO now supports 14 games.
Intel combined its premium-binned silicon with heightened power limits, so the Core i9-14900KS comes with the tradeoff of a voracious power appetite that peaks at 320W and 400 Amps in the Extreme Power Profile, but that's only if you adhere to the recommendations — higher settings are readily available with this fully overclockable chip. That type of power consumption requires powerful and pricey supporting components, like a robust 600- or 700-series Z-chipset motherboard and a high-end power supply that together can deliver high levels of current for long periods of time.
That's not to mention the 14900K's tremendous heat generation, which nearly guarantees your CPU cooler will limit your performance — you'll need to plan for a 360mm AIO watercooler or better. Despite using a 360mm cooler for our testing, our chip consistently hit 100C during heavily threaded work, but as we'll explain in the thermal and power section below, that's by design (mostly).
Because the 14900KS is a Special Edition, Intel will only produce a limited (but unspecified) number of these processors. In fact, this is Intel's fourth iteration of the same chip design that first came to market with the same allotment of cores and cache in 2022. It arrived first as the Core i9-13900K, then progressed to the 13900KS, 14900K, and now, in 2024, the 14900KS. Each iteration has brought higher clock speeds and more performance, but the Core i9 KS chips have historically brought the slimmest of gains.
As we've seen with Intel's other Special Edition chips, the hefty upcharge destroys any illusions of a value proposition — the 14900KS is unabashedly designed for deep-pocketed enthusiasts and extreme overclockers who don't mind paying a premium for the last few percentage points of performance, especially because the extra fee guarantees the highest-binned silicon possible. Let's see how the chip looks in our gaming and application benchmarks and then take a look at power consumption and thermals.
Gaming Benchmarks on Intel Core i9-14900KS — The TLDR
Intel gave us very, very little time to test this chip before the embargo expired — we received it about 36 hours before publication time. Several of the games we use for benchmarking received updates since our last round of testing, necessitating retesting and ultimately resulting in fewer tested configurations than usual. We also didn't have time to try our hand at overclocking, but there should be at least some headroom for higher dual-core clocks with conventional cooling.
The particulars of our test setup are further below. We followed our standard policy of allowing the motherboard to exceed Intel's recommended power limits — even exceeding the Extreme Power Profile — provided the chip remains within warrantied operating conditions. Almost all enthusiast-class motherboards have similar default settings, reflecting the out-of-the-box experience. These lifted power limits equate to more power consumption and heat, but you get faster performance in exchange. We tested the Core i9-14900KS with both stock memory and XMP configurations (marked as DDR5-6800 in the charts).
Here's the high-level view of gaming performance, using the geometric mean of our gaming tests at 1080p and 1440p, with each resolution split into its own chart. We're testing with an Asus RTX 4090 to reduce GPU-imposed bottlenecks as much as possible, and differences between test subjects will shrink with lesser cards or higher resolutions and fidelity. You'll find further game-by-game breakdowns below.
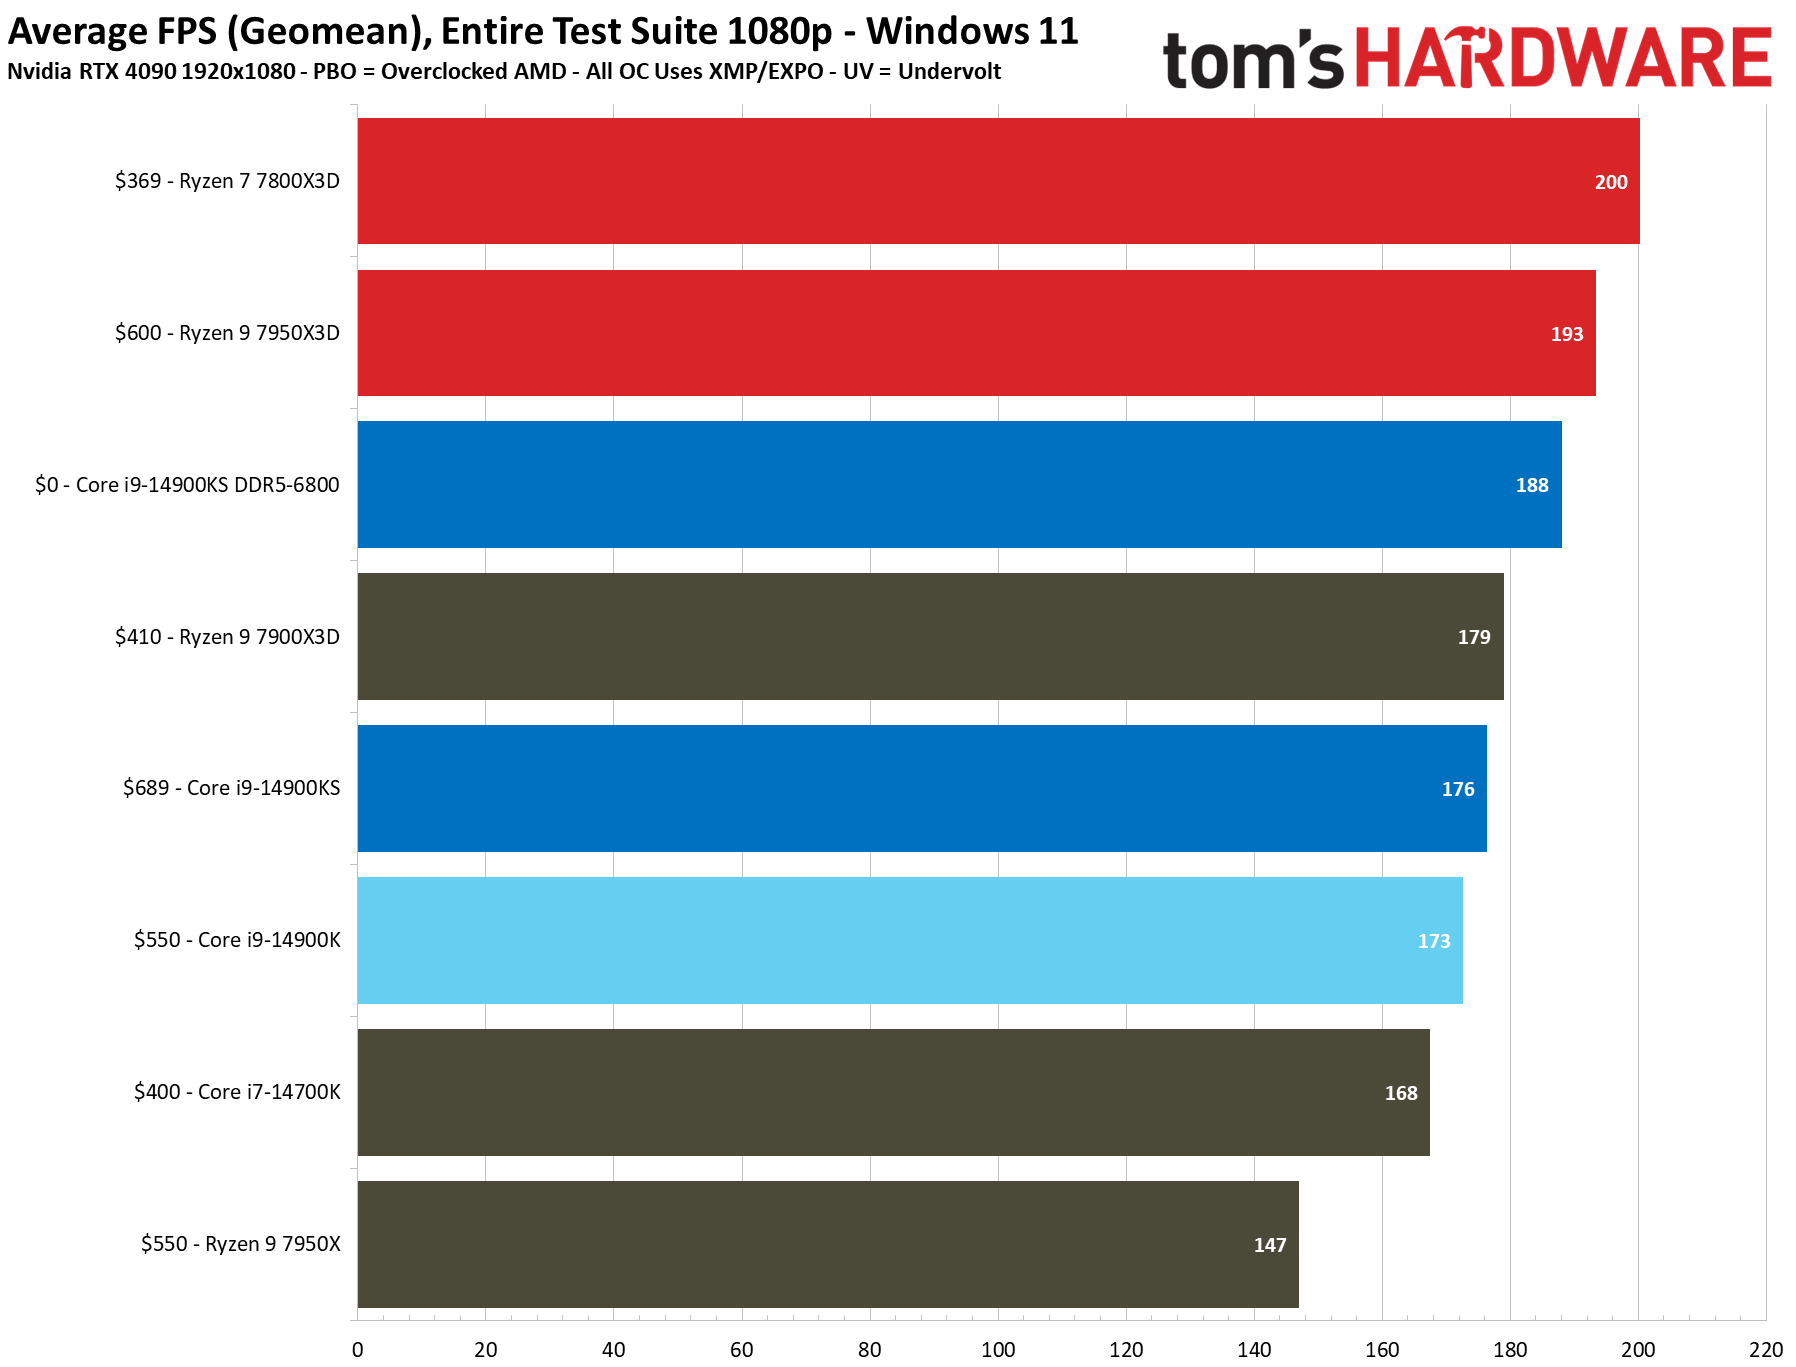
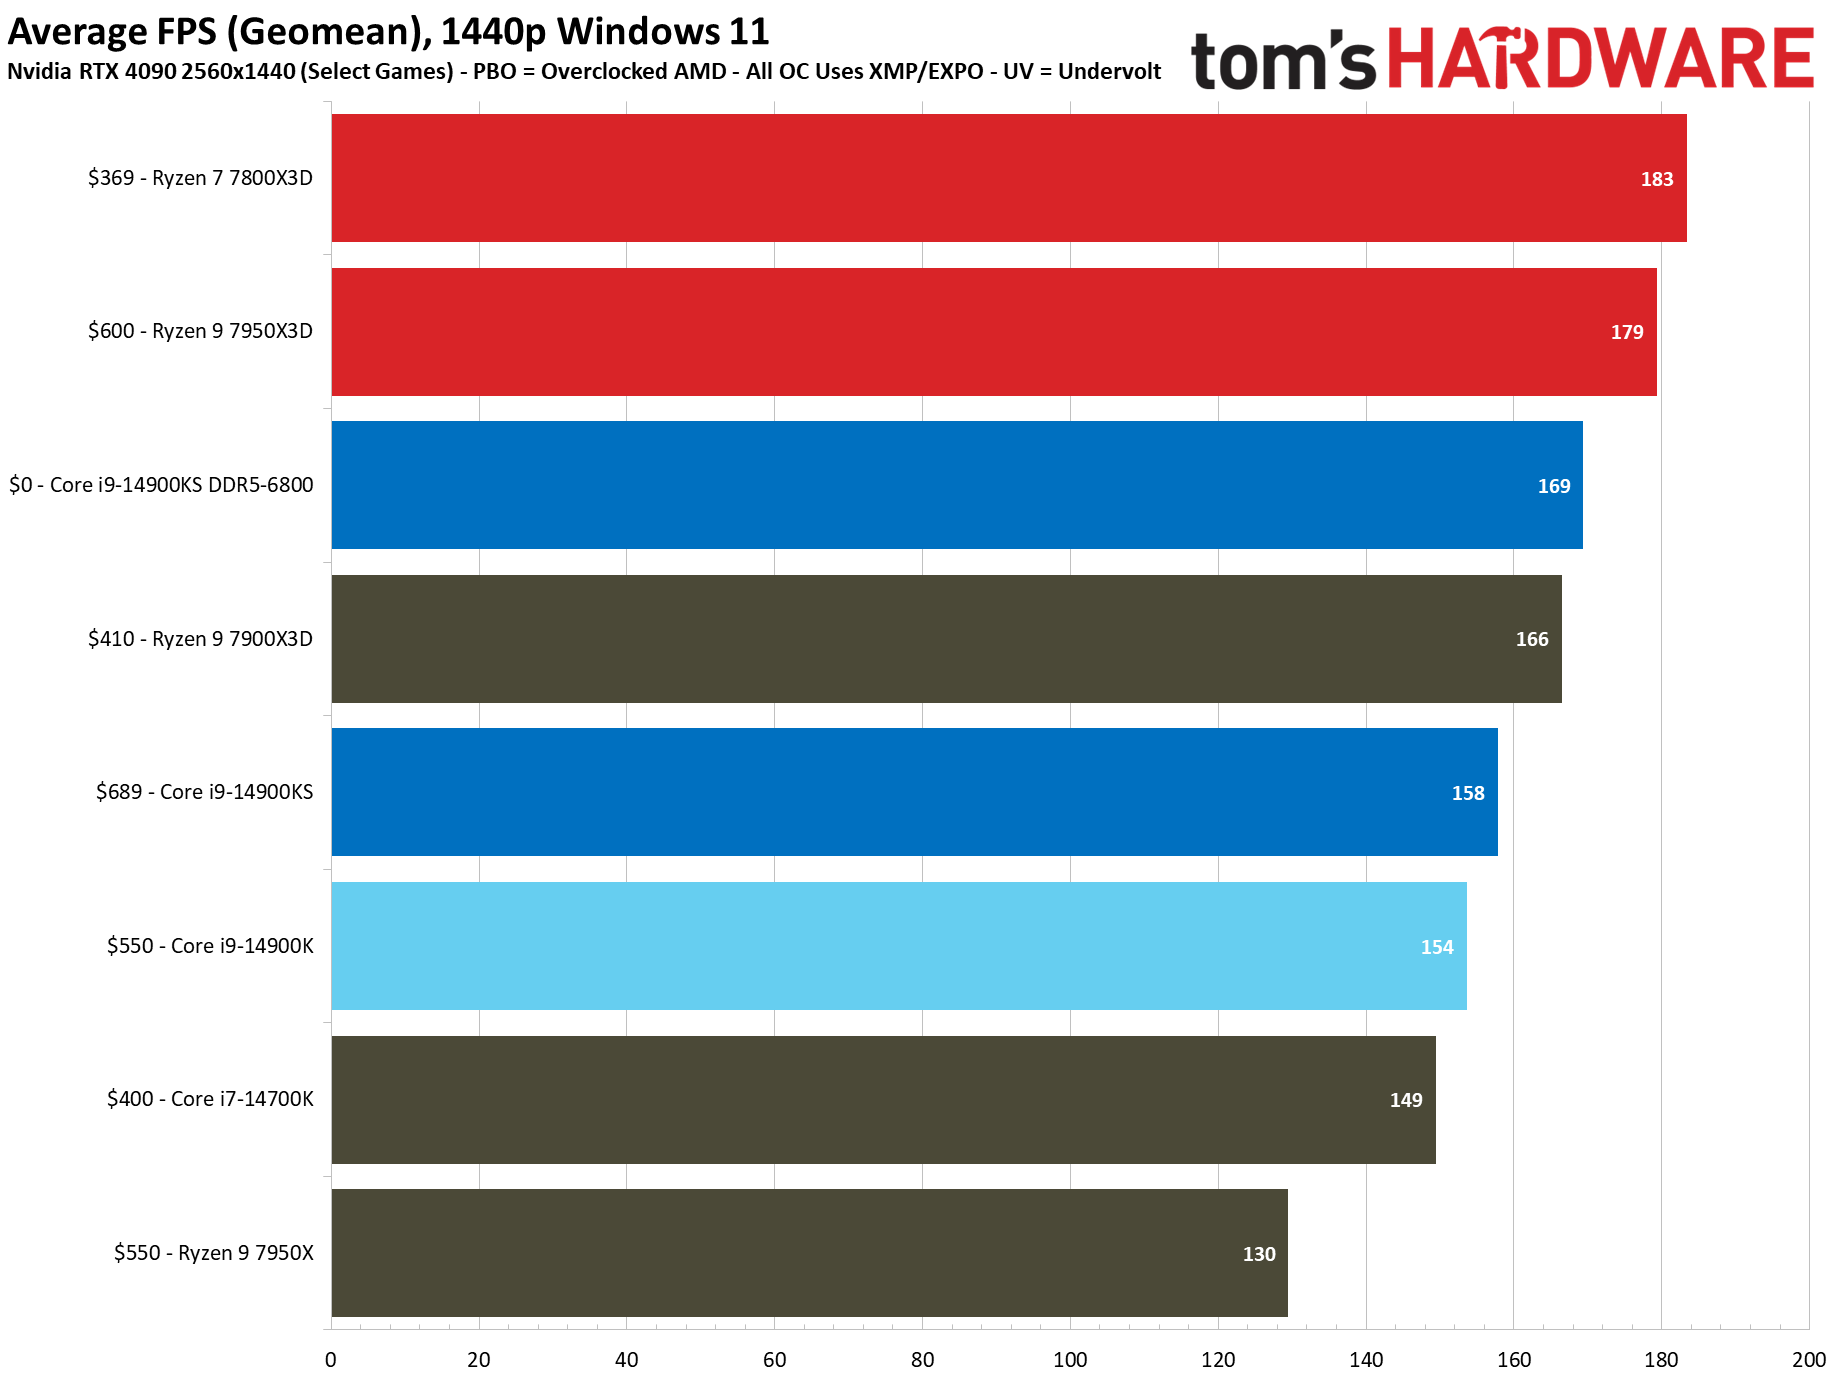
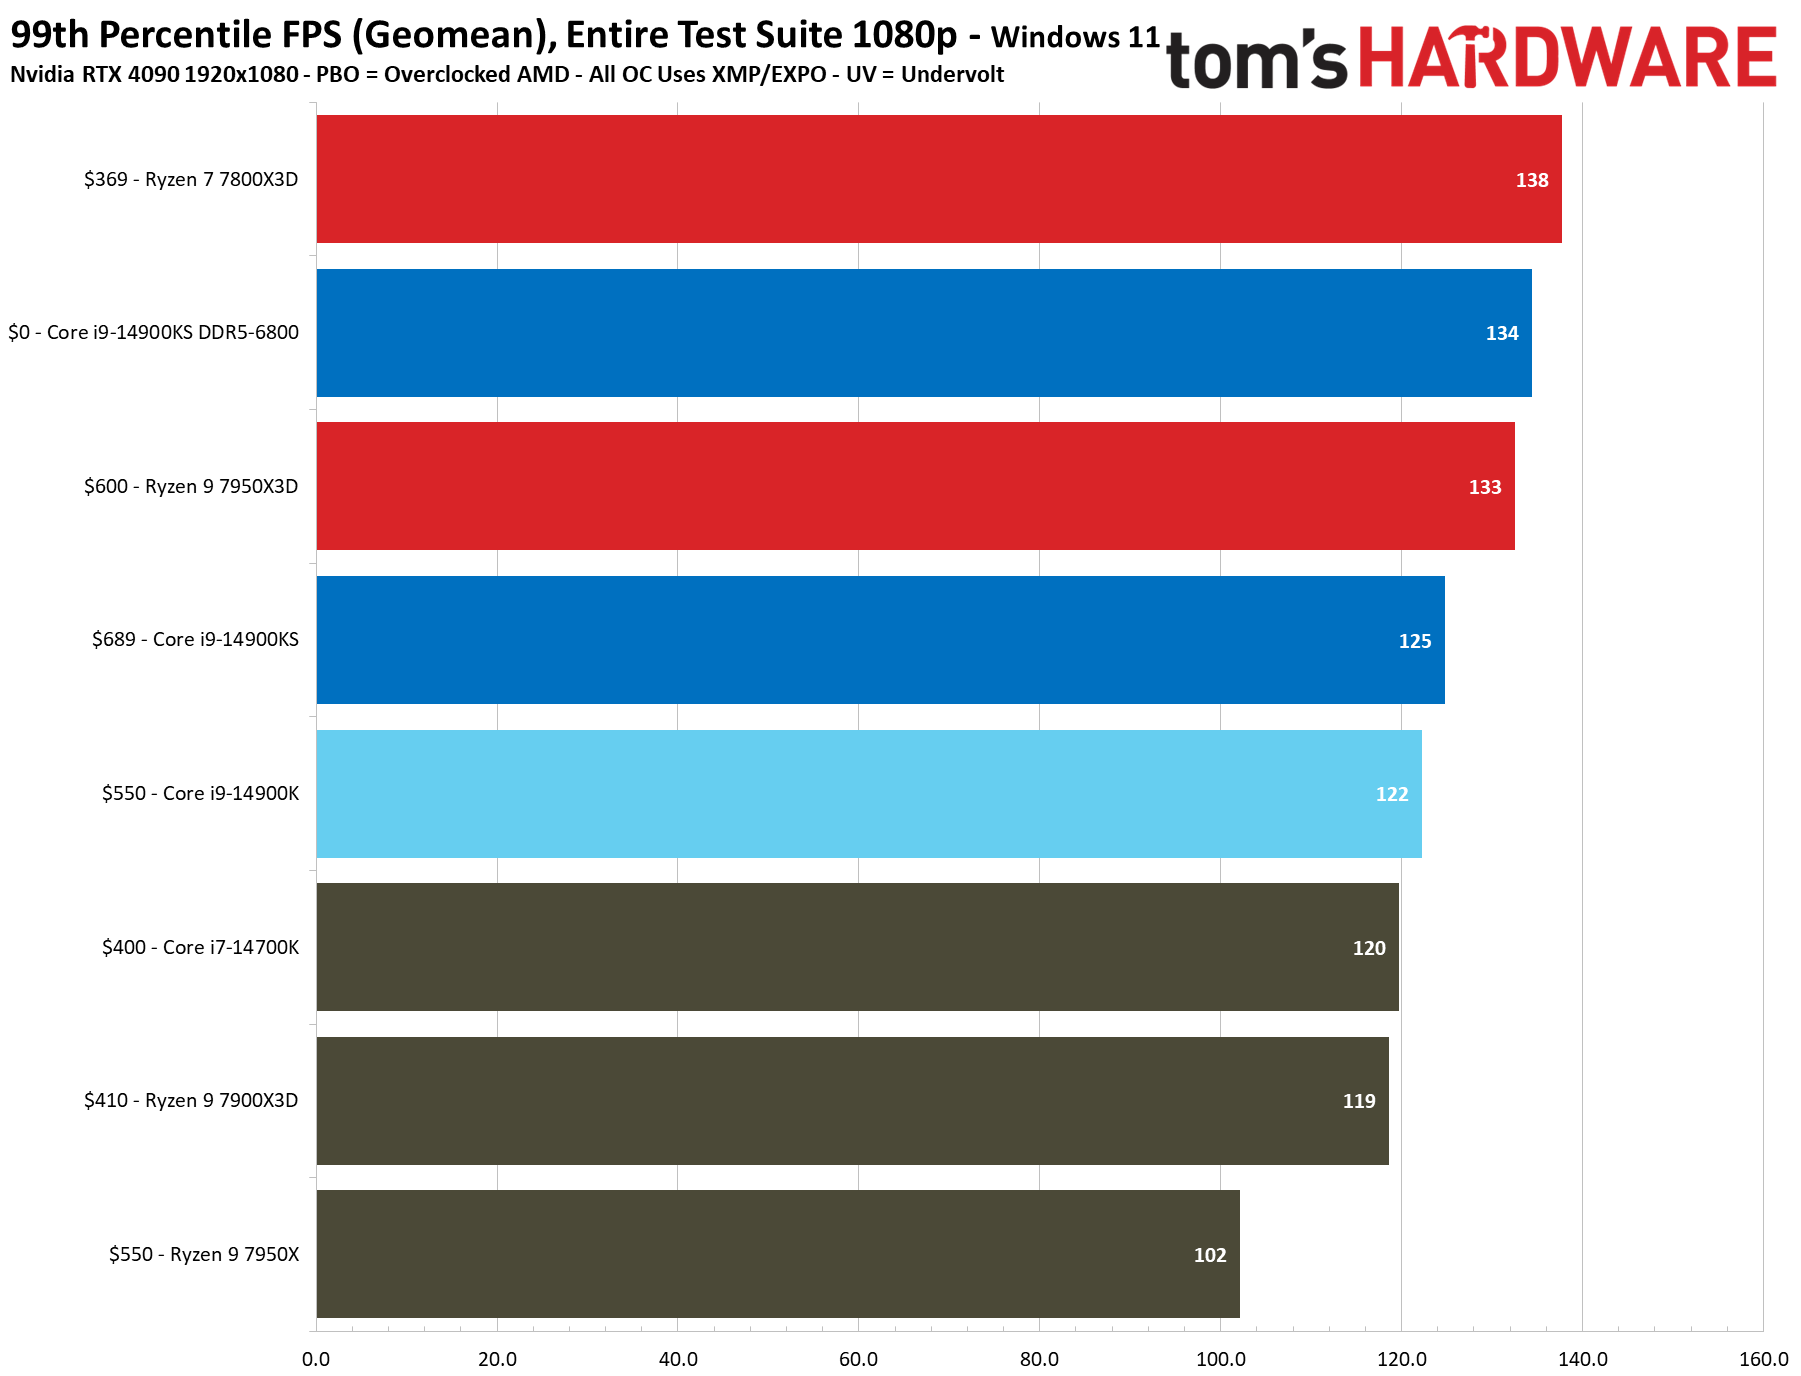
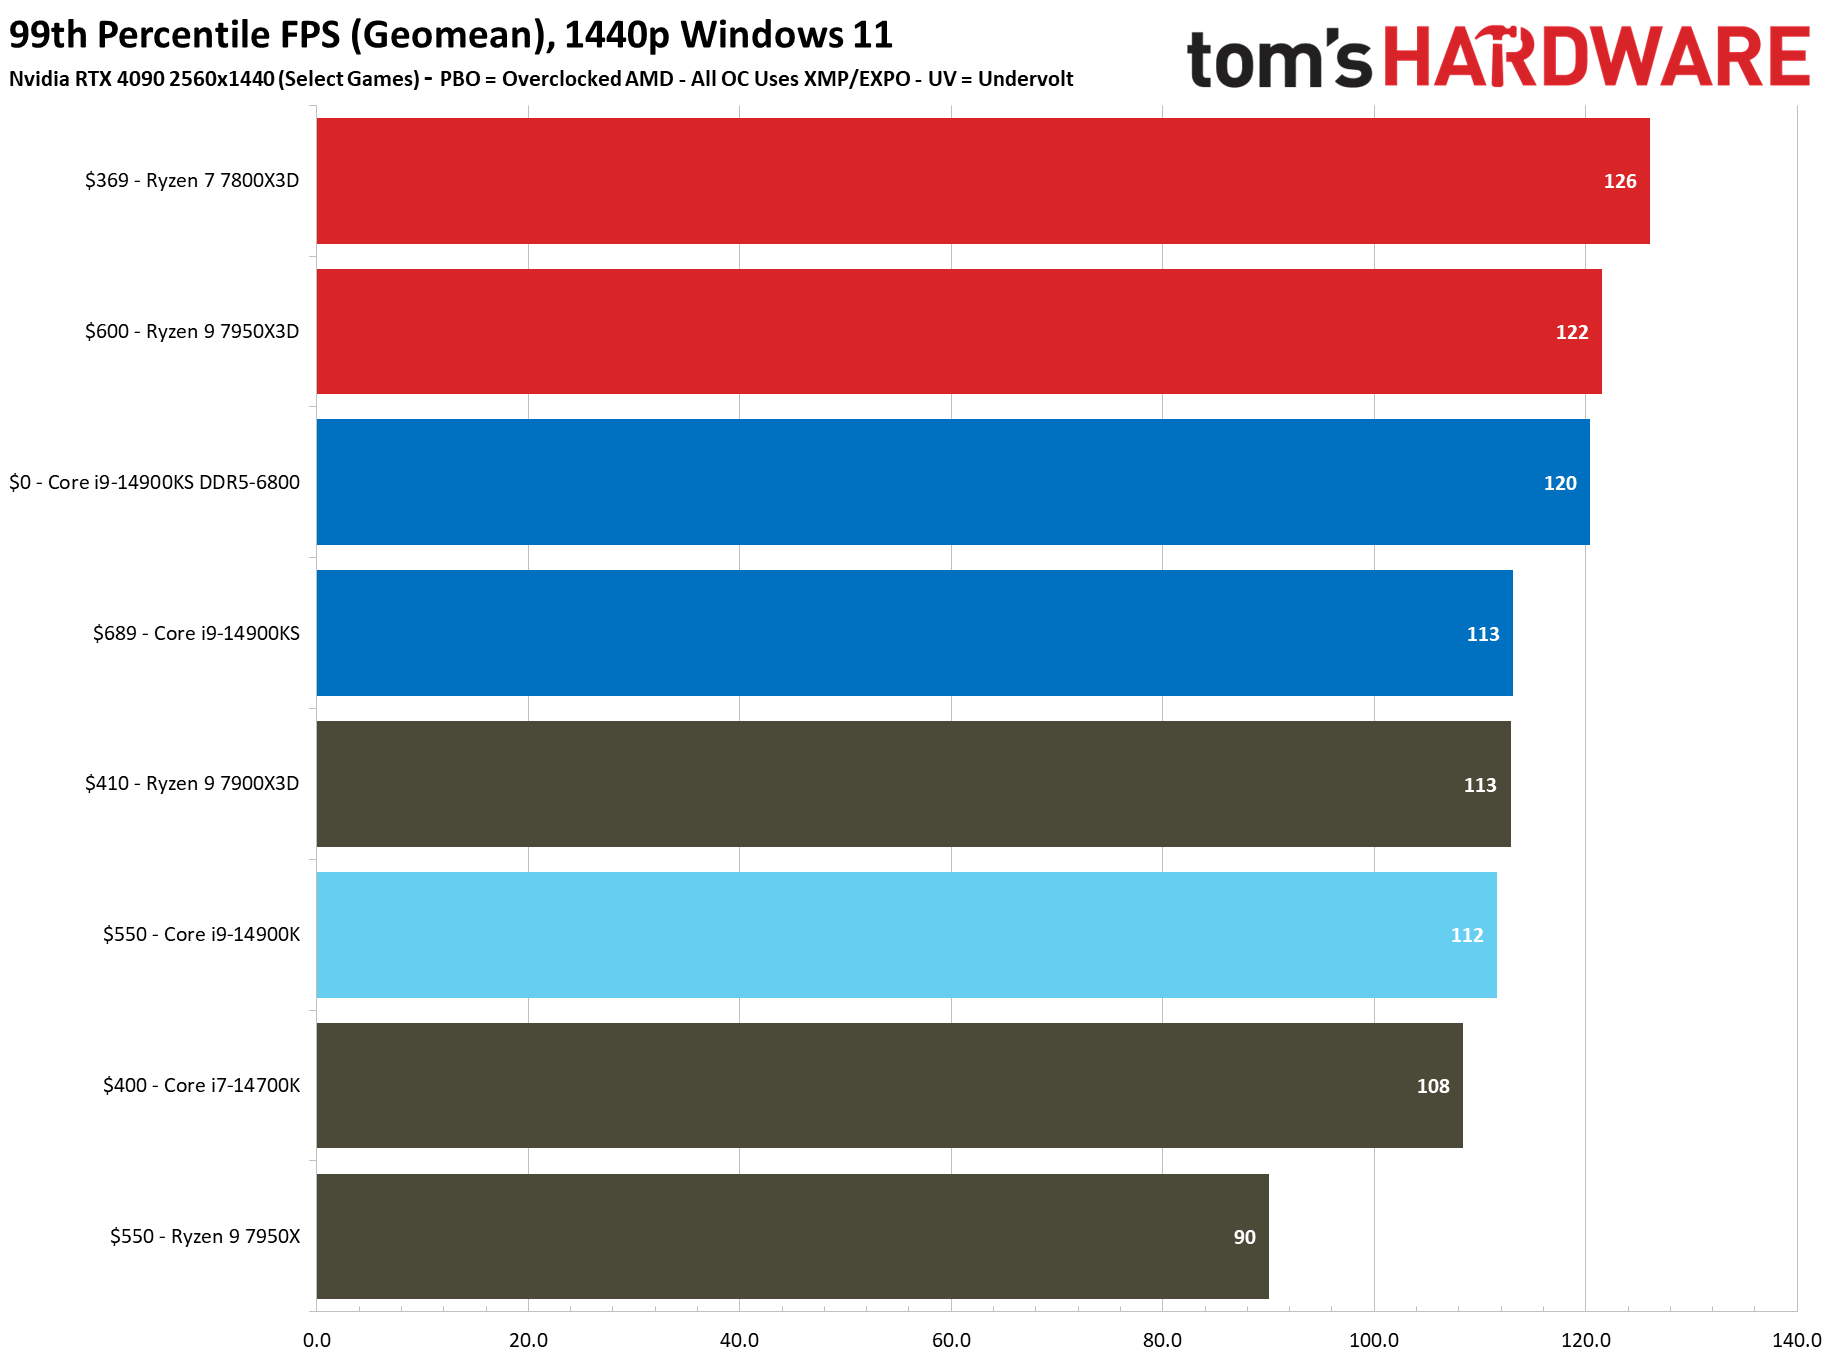
AMD's Ryzen X3D processors retain their lead in gaming, but the margin has shrunk slightly. Be aware that the X3D chips are also specialty processors, in that they come with a tremendous slab of game-boosting L3 cache but aren't as powerful in standard productivity applications. They also don't accelerate all games equally, so be sure to do your research before you pull the trigger. The deltas in these charts can be slim, and large deltas in individual game titles, as we see with the 7000X3D chips, can have a big impact on cumulative measurements.
The $689 Core i9-14900KS is 25% more expensive than the $550 Core i9-14900K, but it's only a scant 1.7% faster in 1080p gaming, which is just enough to say it falls outside of what we would expect from normal run-to-run variance. Most users who buy a $689 chip will be gaming at higher resolutions than 1080p anyway, and the difference between the vanilla and KS models is still only 2.5% at 1440p.
Sure, you could splurge and buy a DDR5-6800 kit like we used and eke out another 6.8% of performance from the 14900KS, but you could also do the same with the 14900K. Much like these tiny deltas in real-world gaming performance, we doubt you would see much of a difference between the two chips armed with the same overclocked memory.
We tested the 14900KS with overclocked memory but didn't have time to do the same with the X3D processors for this review. However, repeated tests have shown us that the X3D chips only gain around one percent from faster memory, so we aren't missing much.
The Ryzen 7800X3D is the fastest gaming chip on the planet overall. It's ~14% faster than the 14900K at stock settings and maintains a 6% lead over the KS with overclocked memory. The 7800X3D retails for around $329 less, making it an amazing deal for gaming, but it certainly isn't competitive with the 14900KS in productivity work.
If you're looking for a better option for productivity and gaming, the 7950X3D is ~10% faster in gaming for ~$70 less, and while it isn't as fast at productivity, it does have a surprising amount of threaded horsepower despite its gaming-optimized architecture.
The competition between AMD and Intel chips can vary based on the title (particularly with DDR4 vs DDR5) and the GPU you use. It's best to make an informed decision based on the types of titles you frequently play, so be sure to check out the individual game tests below.
Borderlands 3 on Intel Core i9-14900KS
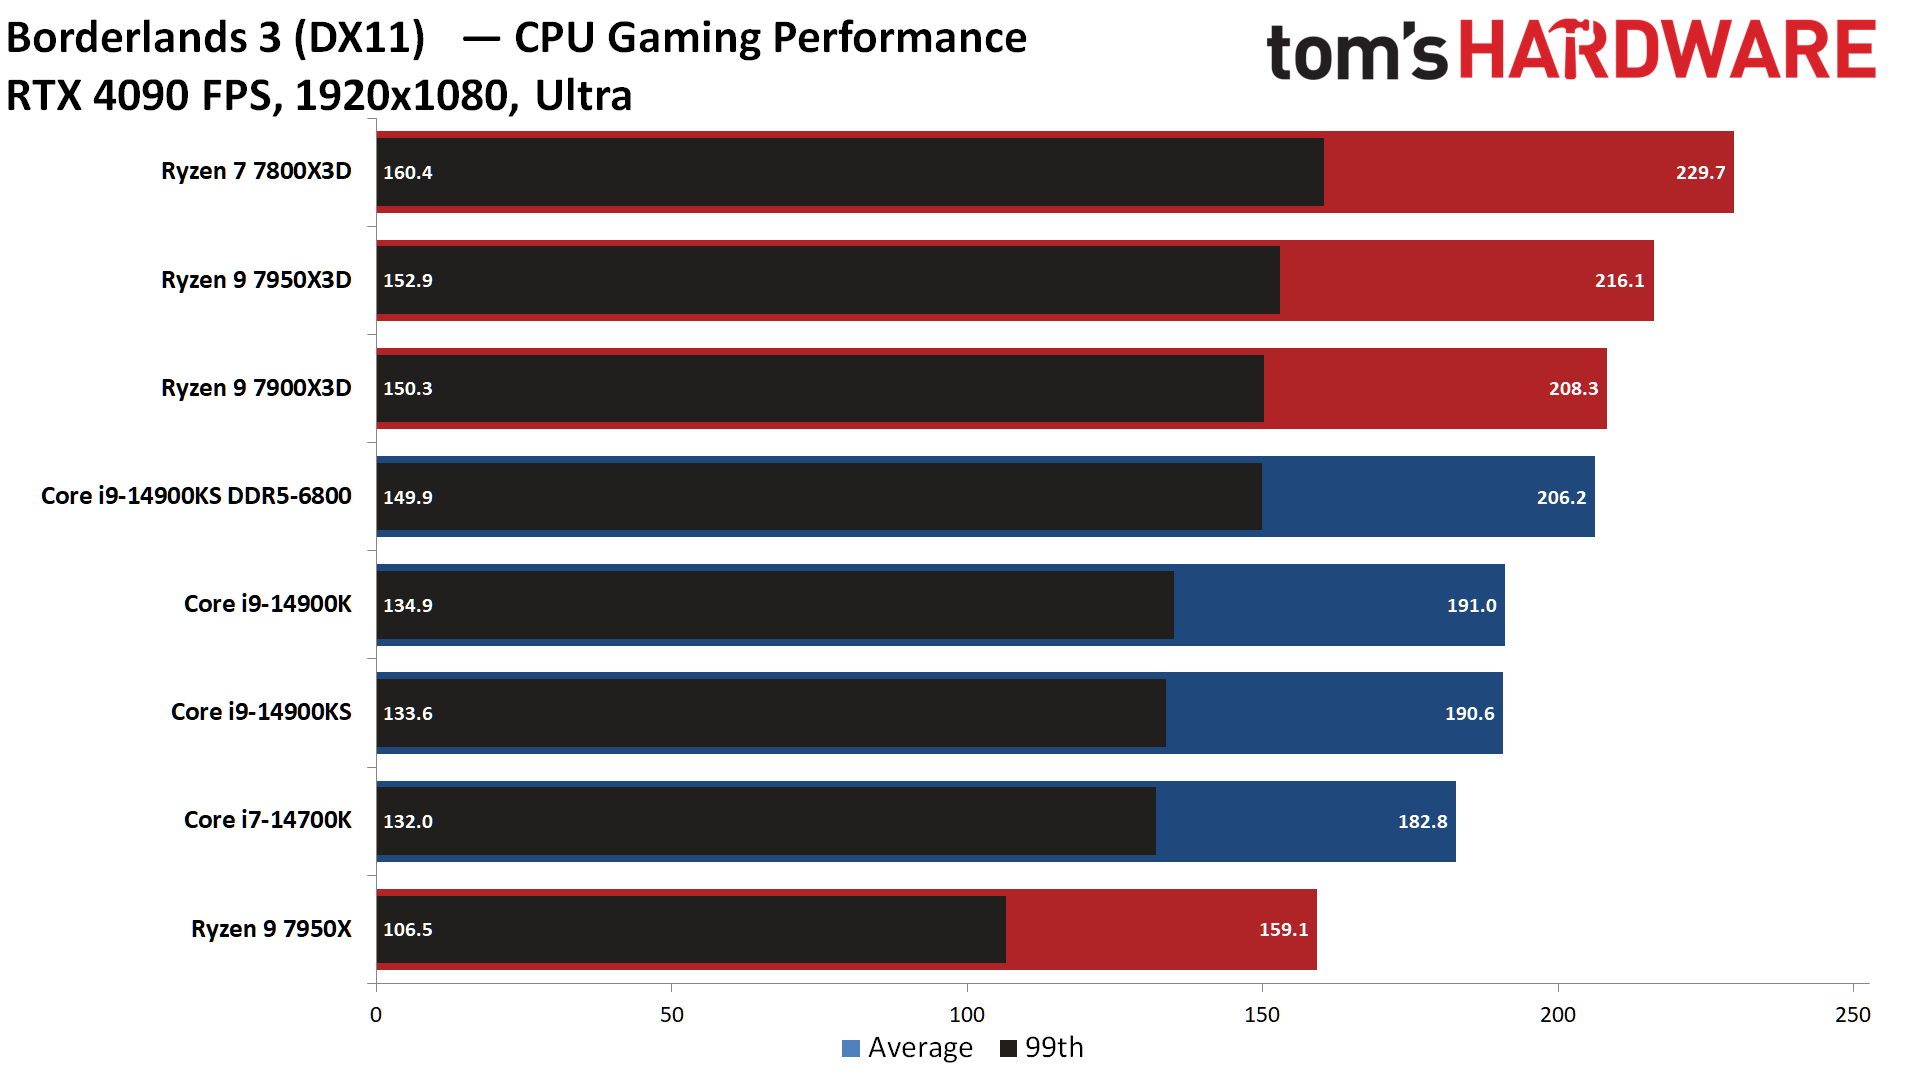
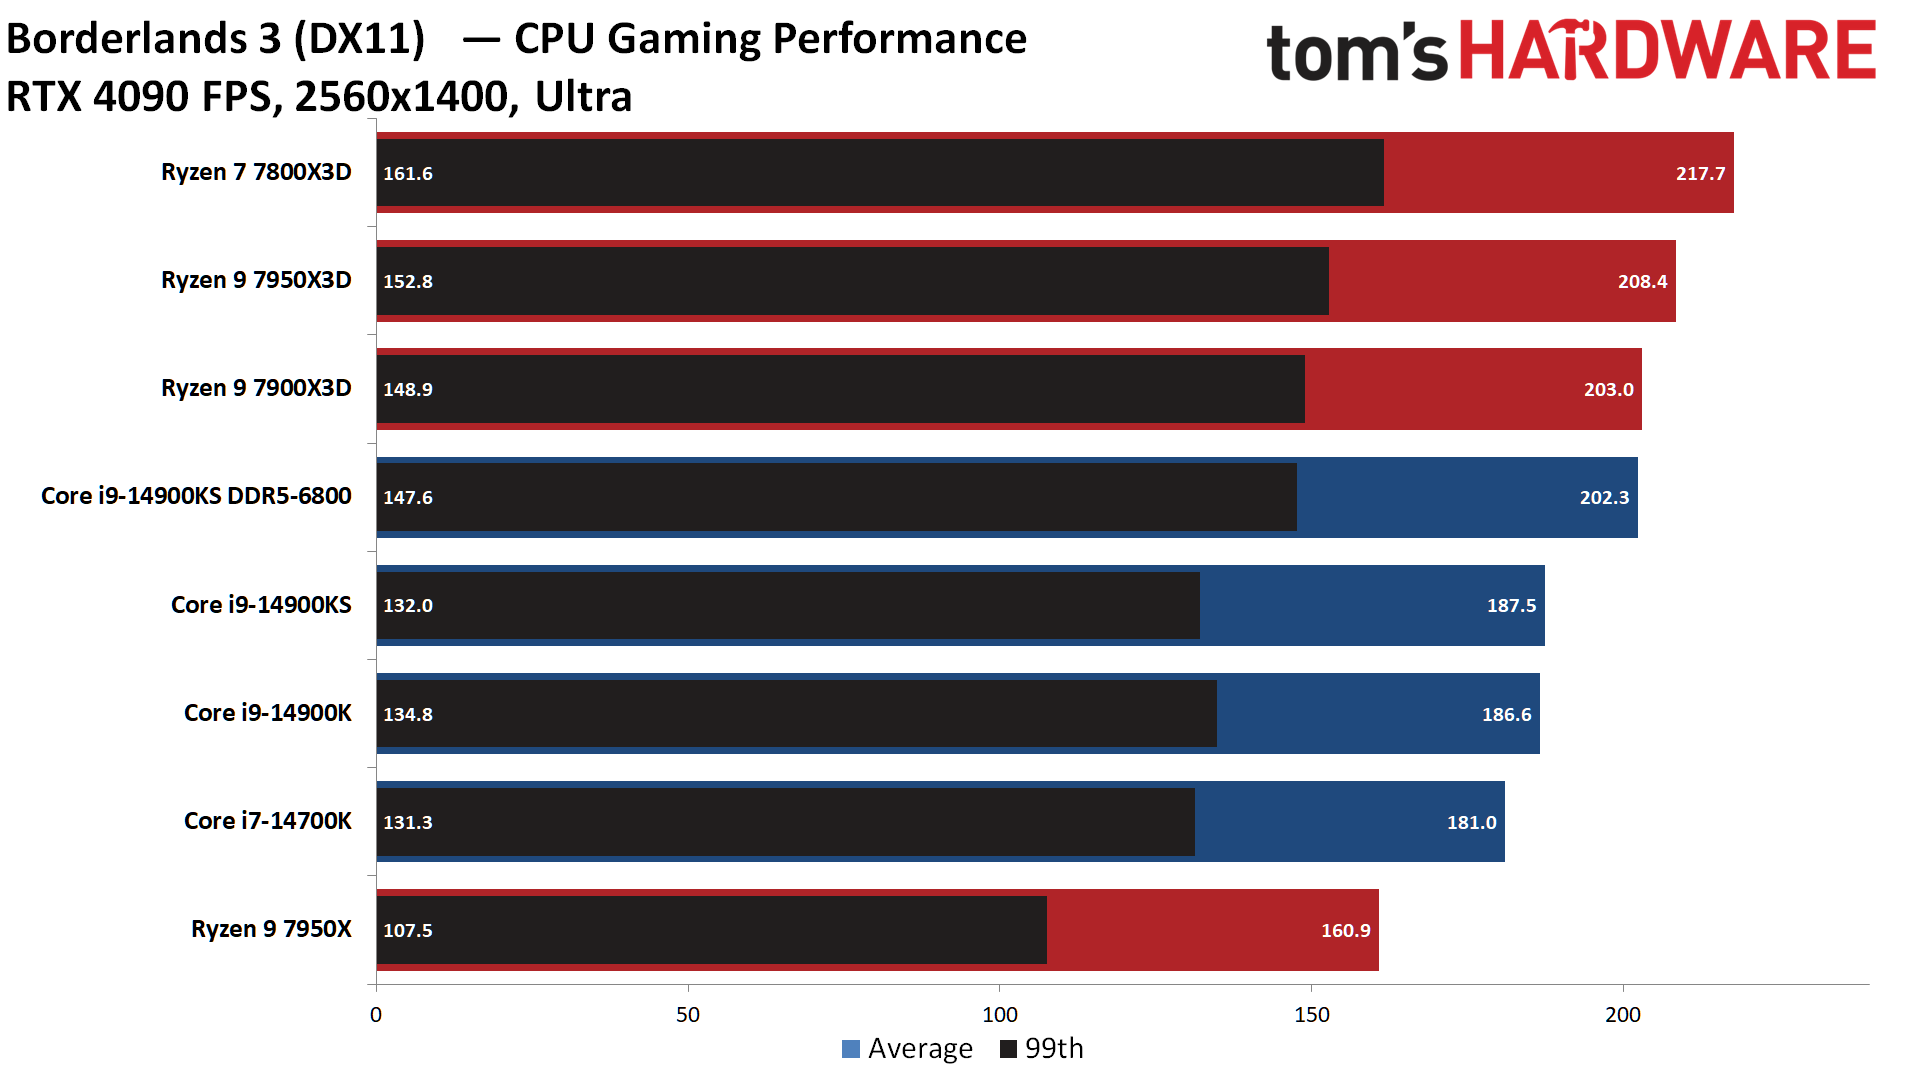
The Ryzen 7000X3D chips take a strong lead in this title. This is impressive, but it doesn't represent Ryzen 7000X3D's performance in most titles. It also illustrates how outliers can make the X3D seem more impressive in our cumulative measurements. Borderlands 3 was also an AMD promotional title, and that likely plays a role in its performance.
Cyberpunk 2077 on Intel Core i9-14900KS
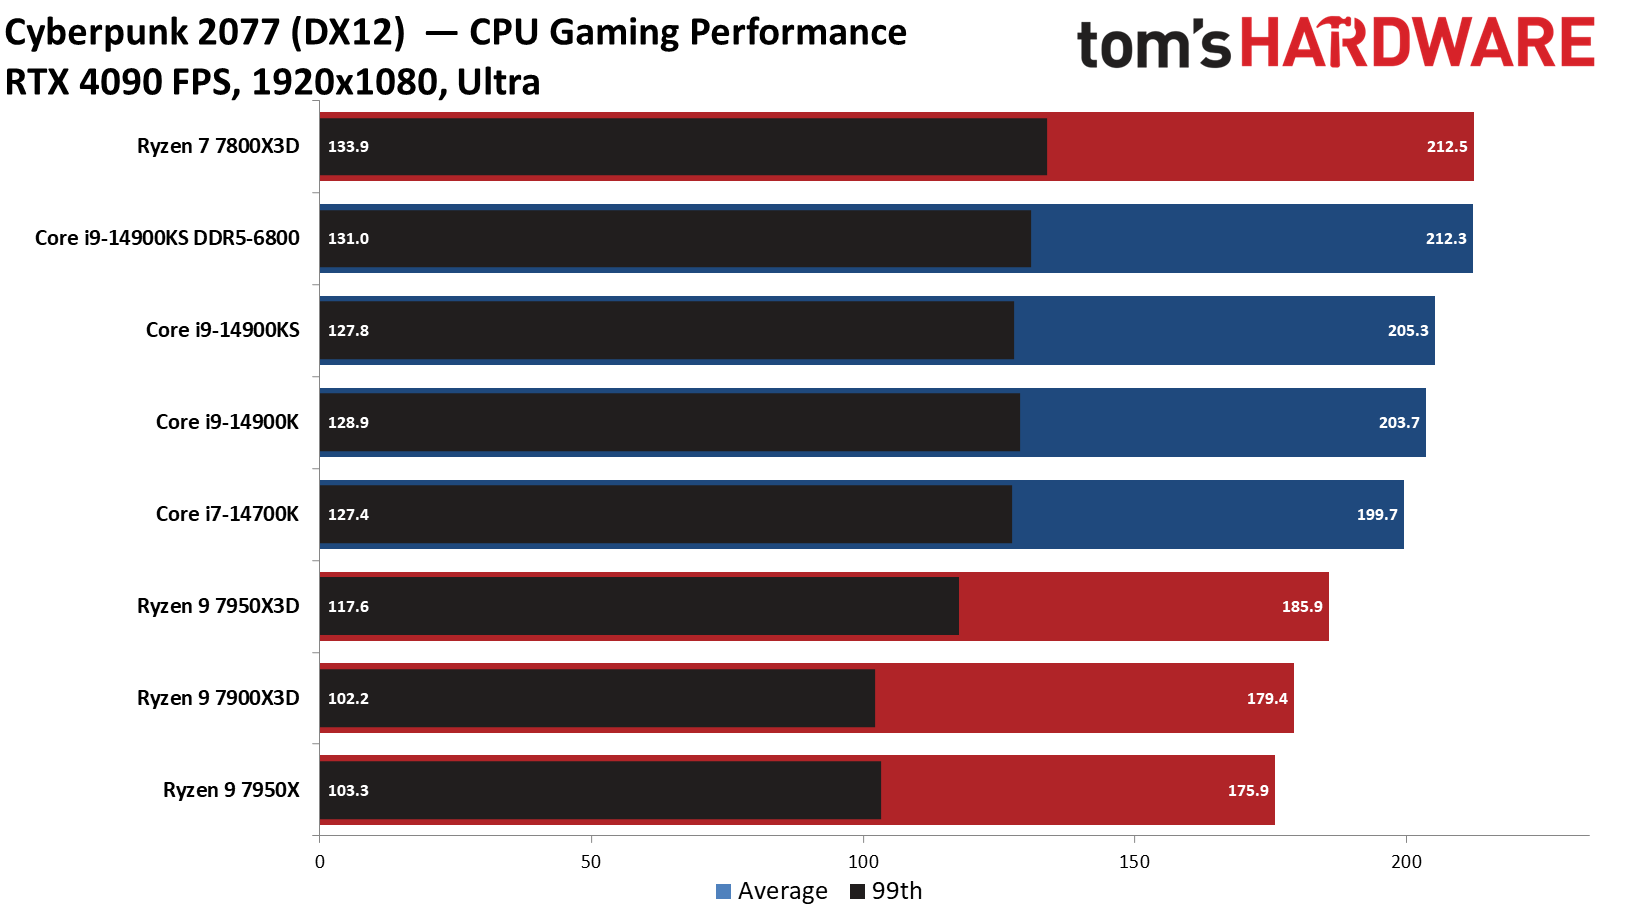
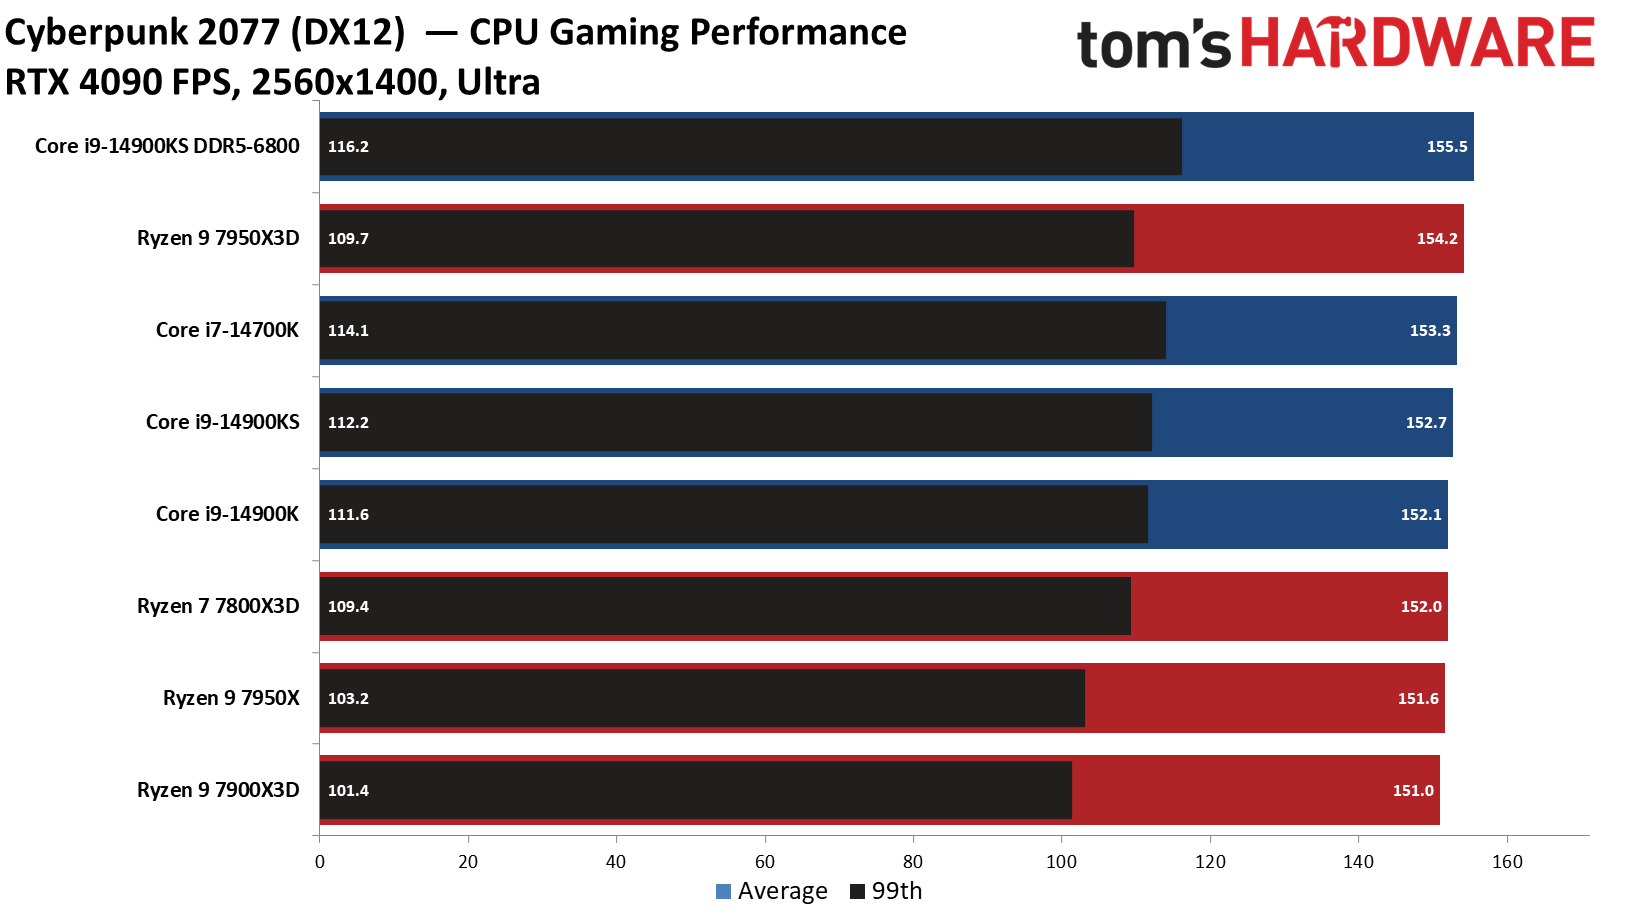
AMD's 7800X3D takes a slim lead in Cyberpunk 2077 at 1080p, effectively tying the overclocked DDR6-6800 14900KS configuration. While the game tends to be more GPU limited, the CPU can still make a difference when ray tracing isn't enabled. The 1440p results are basically tied across all tested CPUs, with only a 3% delta between the fastest and slowest chips.
Get Tom's Hardware's best news and in-depth reviews, straight to your inbox.
F1 2023 on Intel Core i9-14900KS
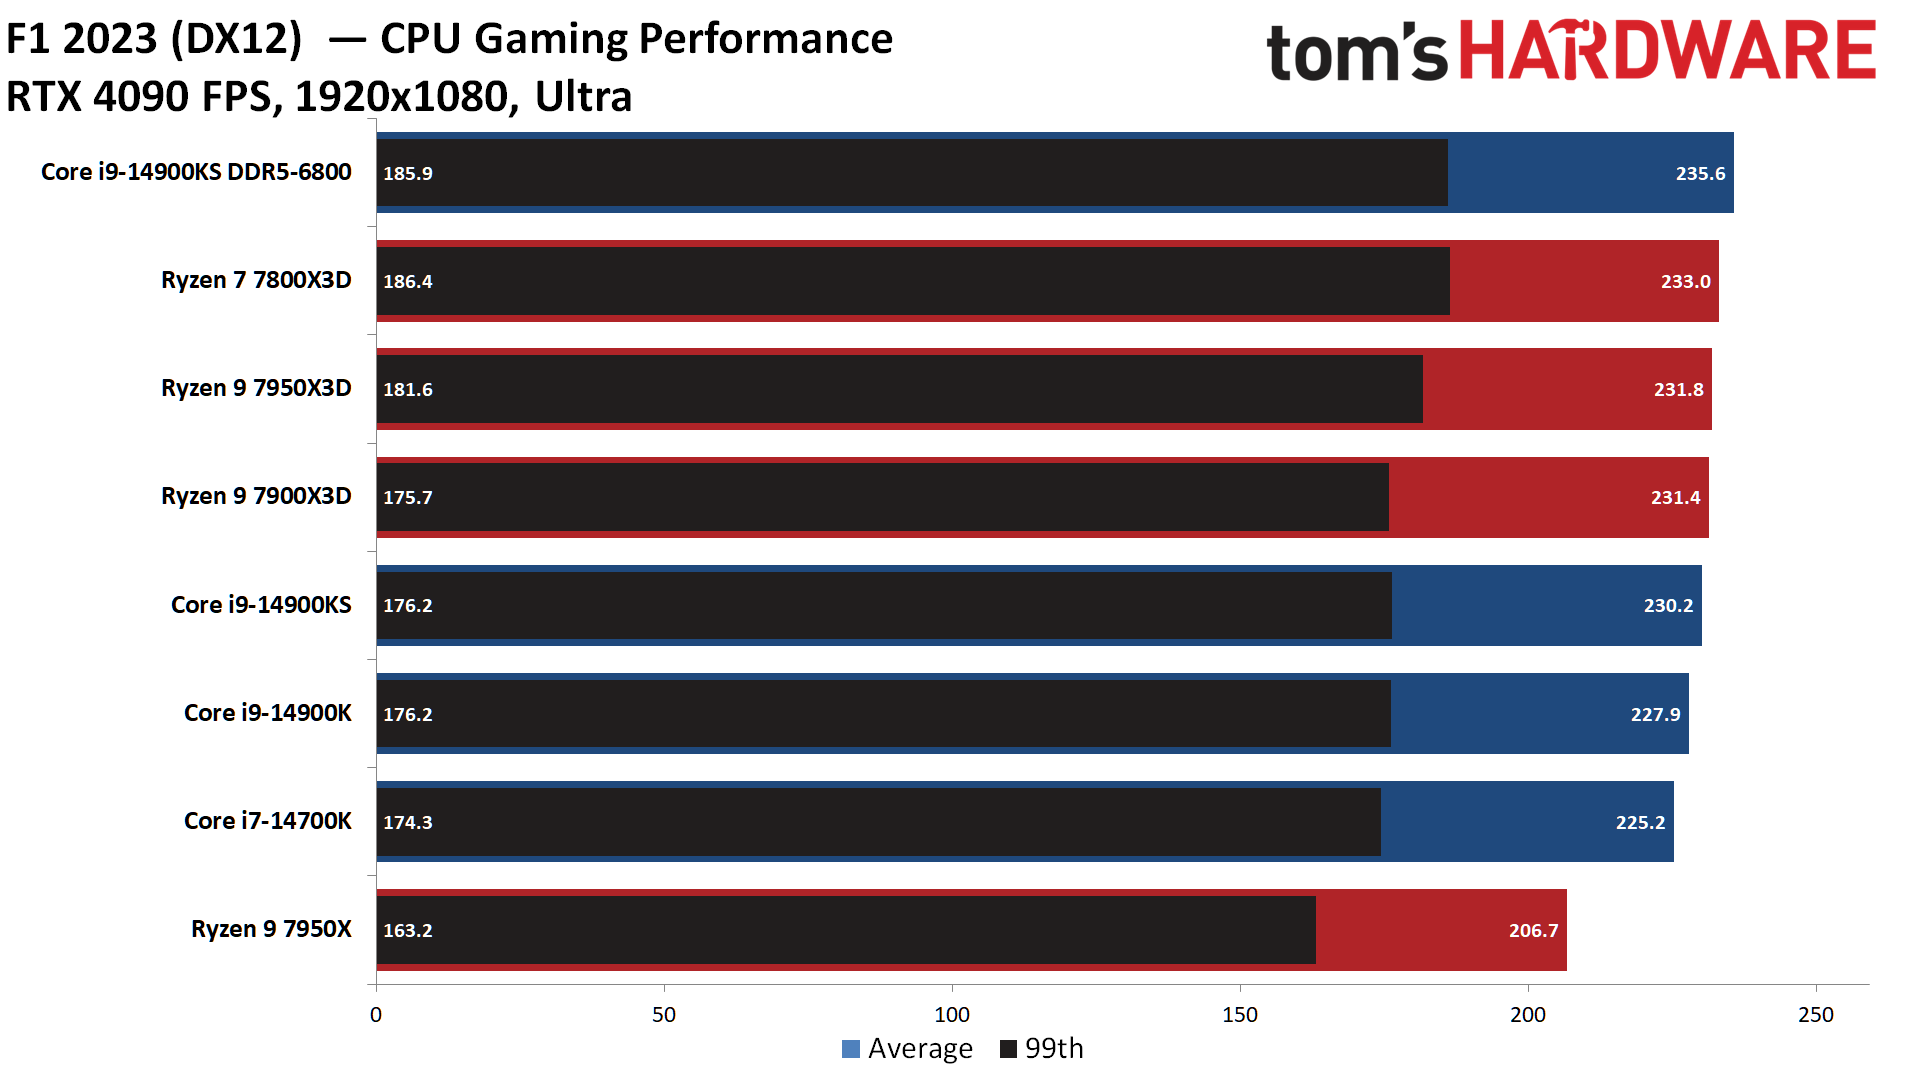
The 14900KS paired with an XMP memory kit takes the lead in this benchmark, but the X3D chips maintain a slight lead over the stock 14900KS configuration. This is another game where AMD's X3D takes a clear lead over the regular 7950X.
Far Cry 6 on Intel Core i9-14900KS
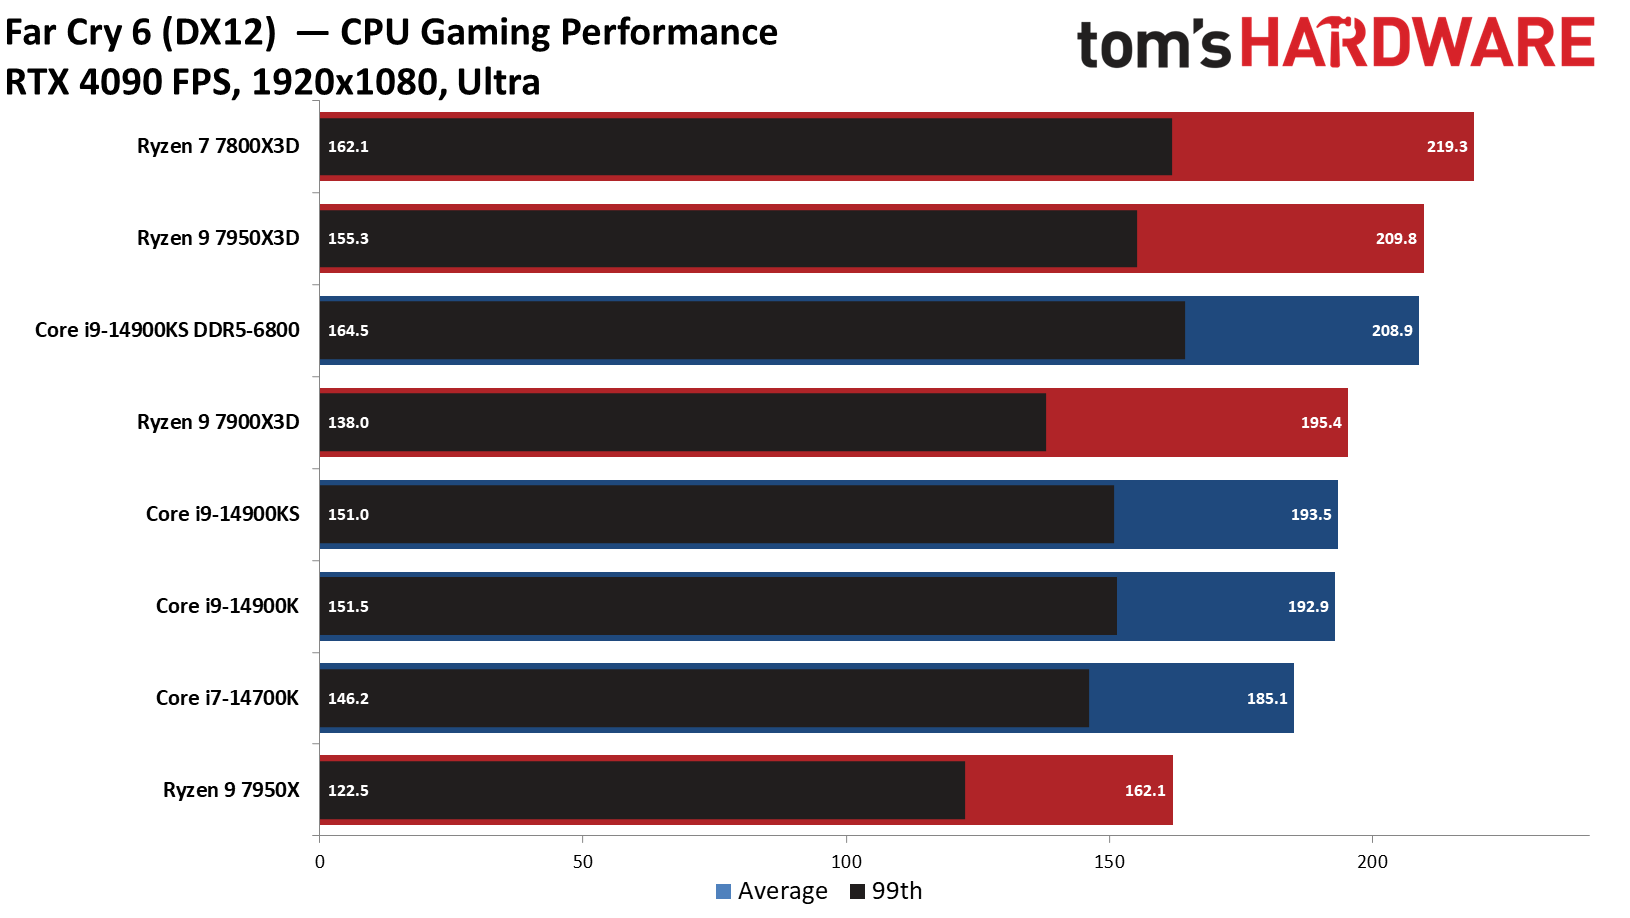
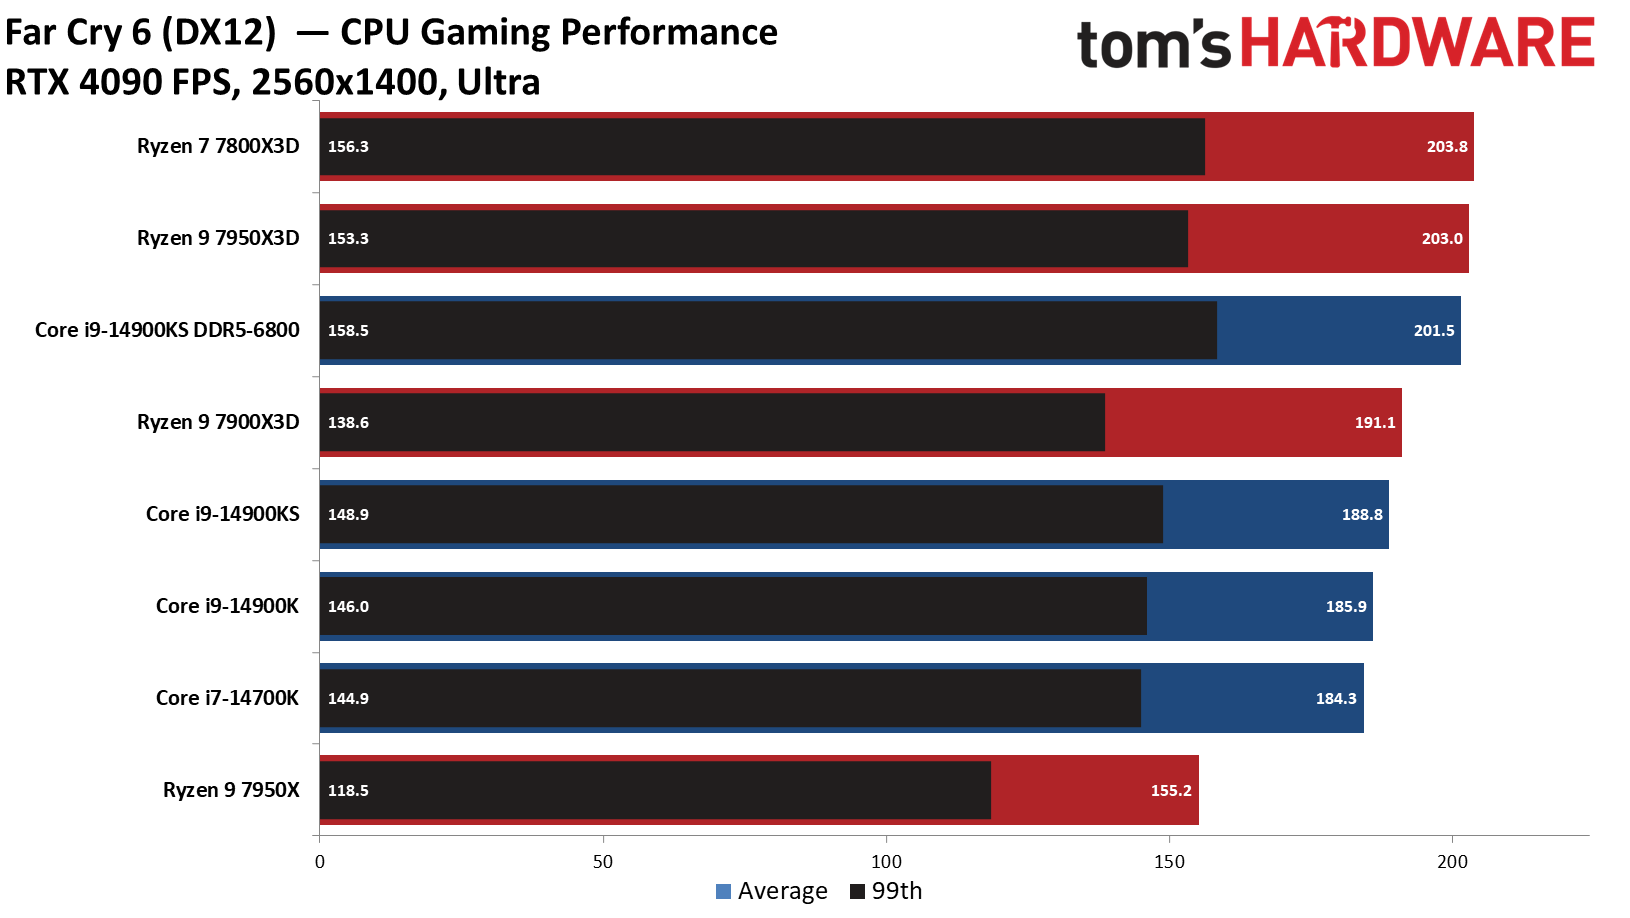
Far Cry 6 is another game that was originally promoted by AMD, so perhaps that helps explain some of the rankings. The 7800X3D takes the top spot, followed by the 7950X3D, with the 14900KS DDR5-6800 basically matching the 7950X3D.
Hitman 3 on Intel Core i9-14900KS
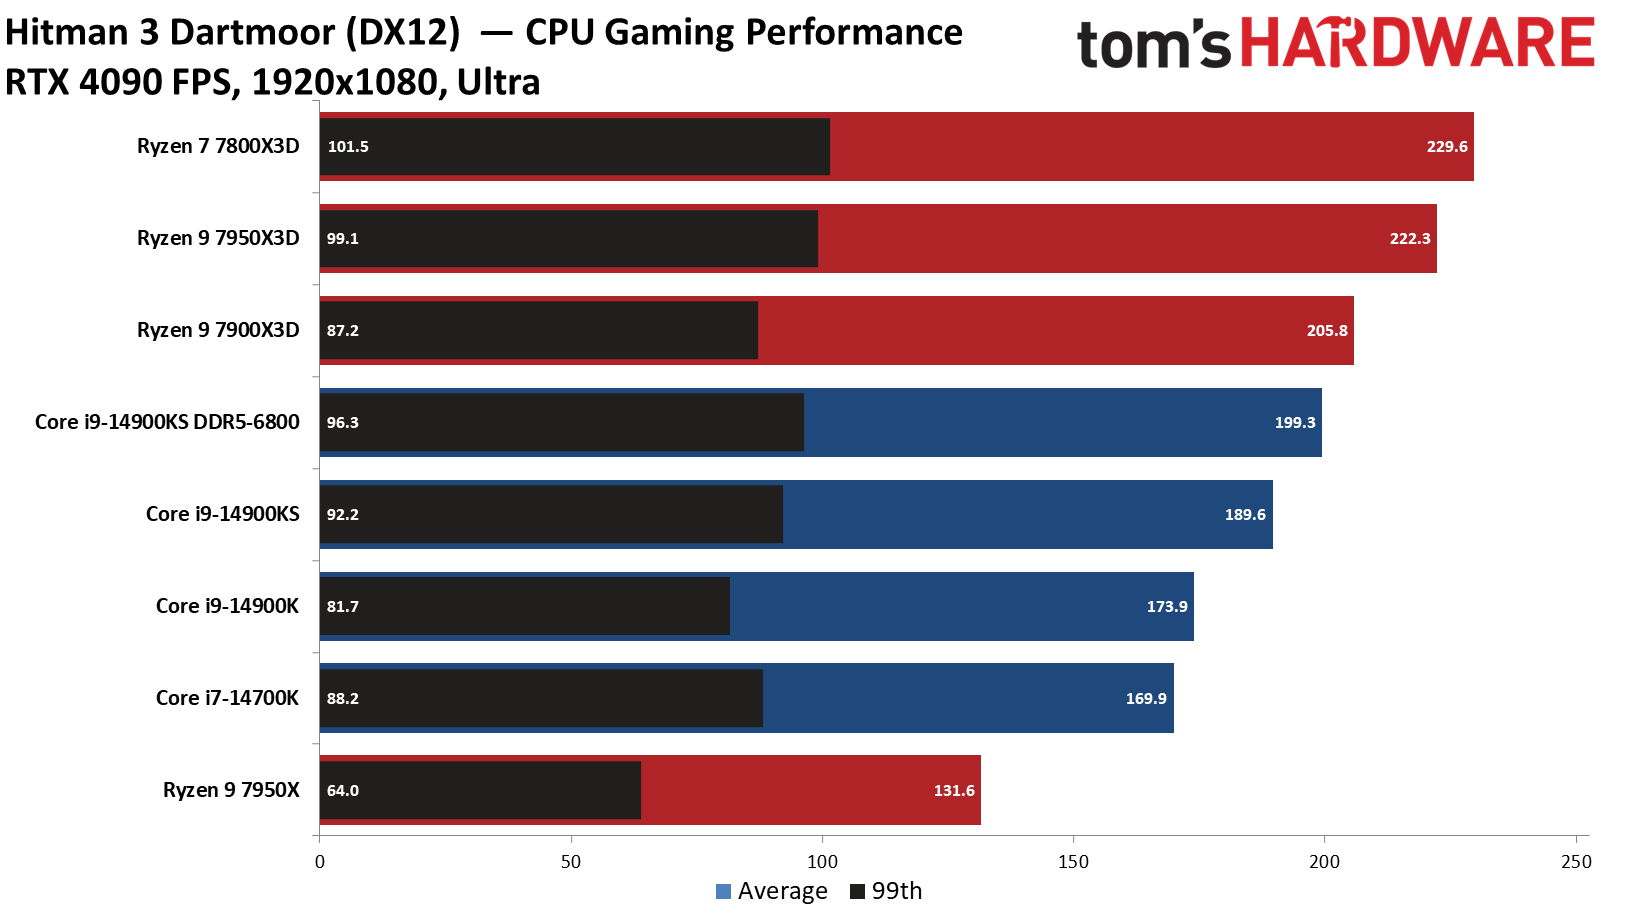
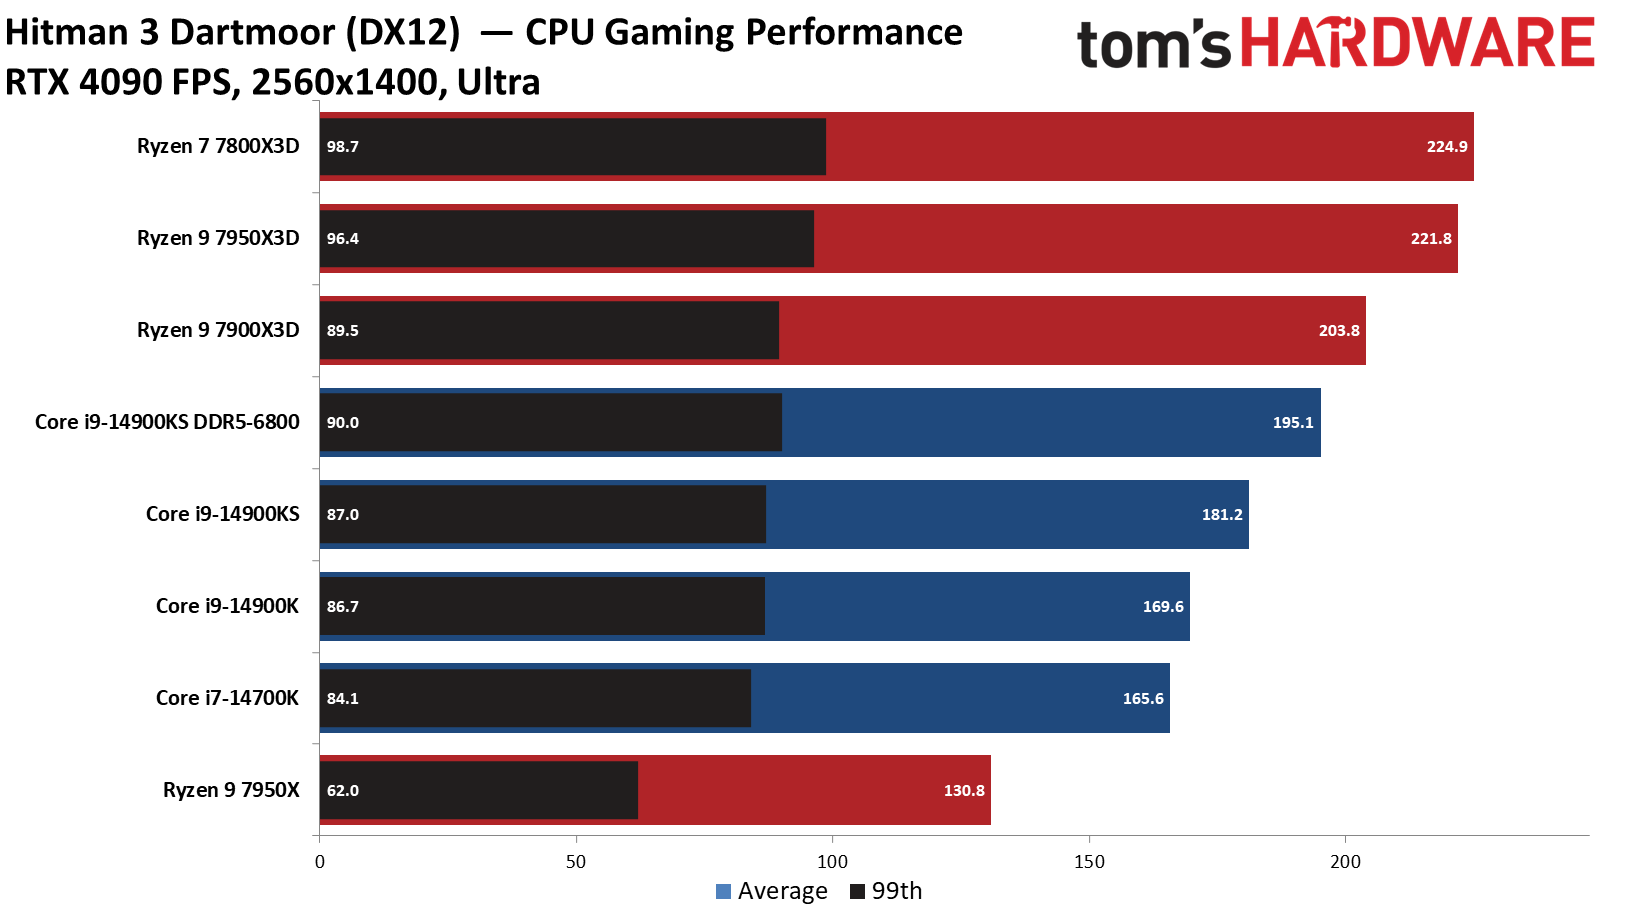
The Ryzen X3D chips are exceptional in Hitman 3, with the relatively inexpensive Ryzen 7 7800X3D taking a 21% lead over the pricey Core i9-14900KS. Even at 1440p the margins are still quite large.
Microsoft Flight Simulator 2021 on Intel Core i9-14900KS
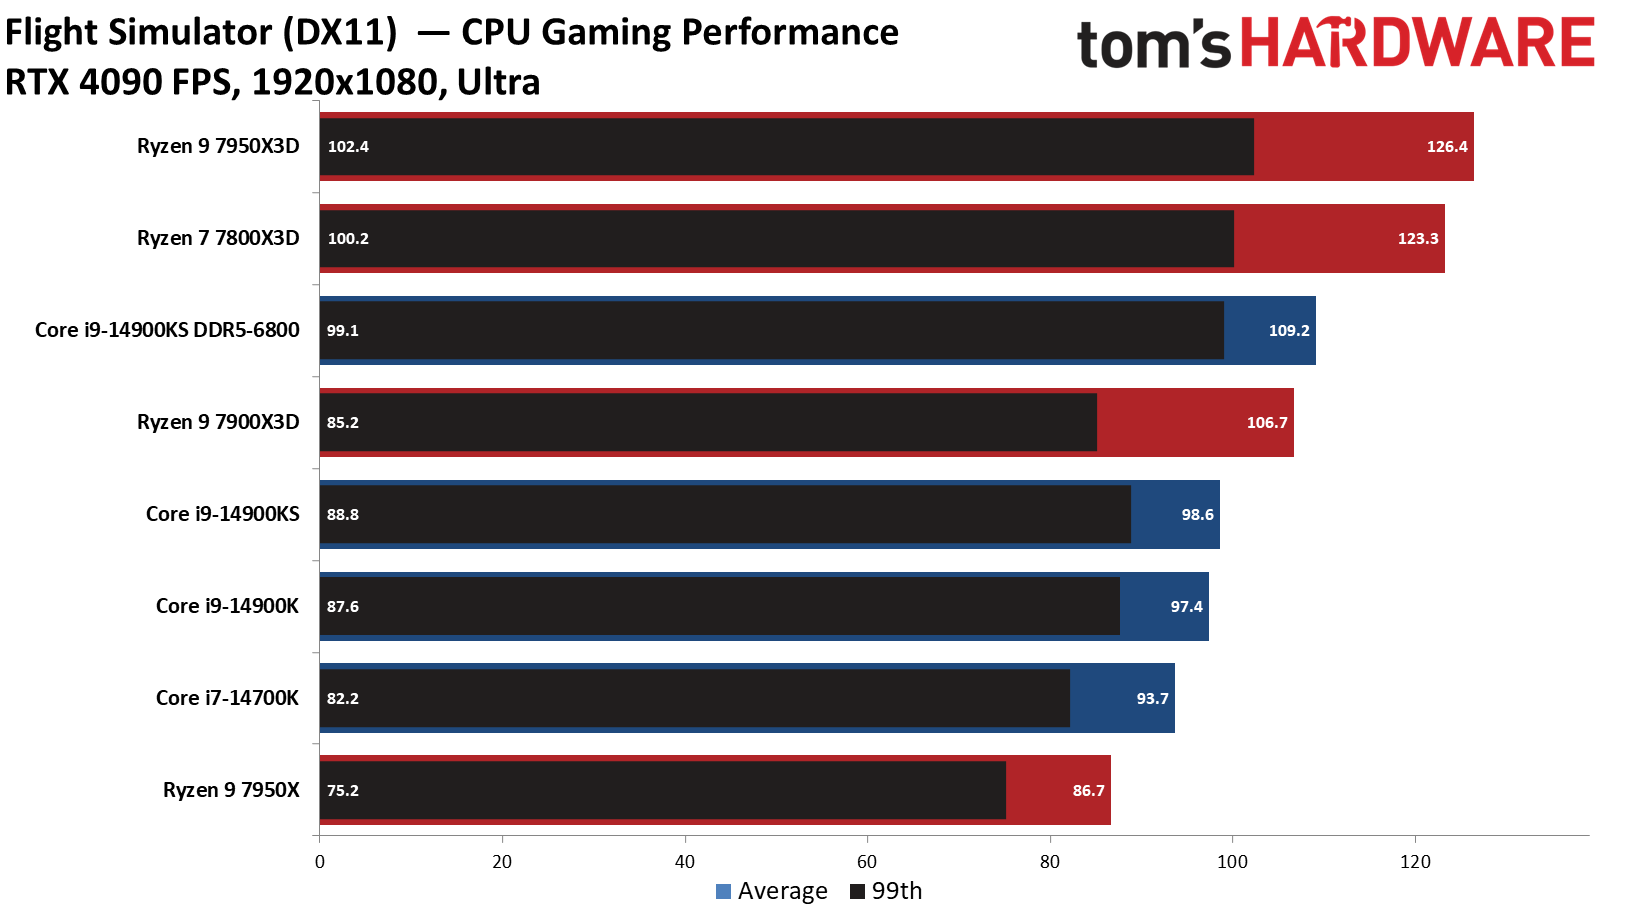
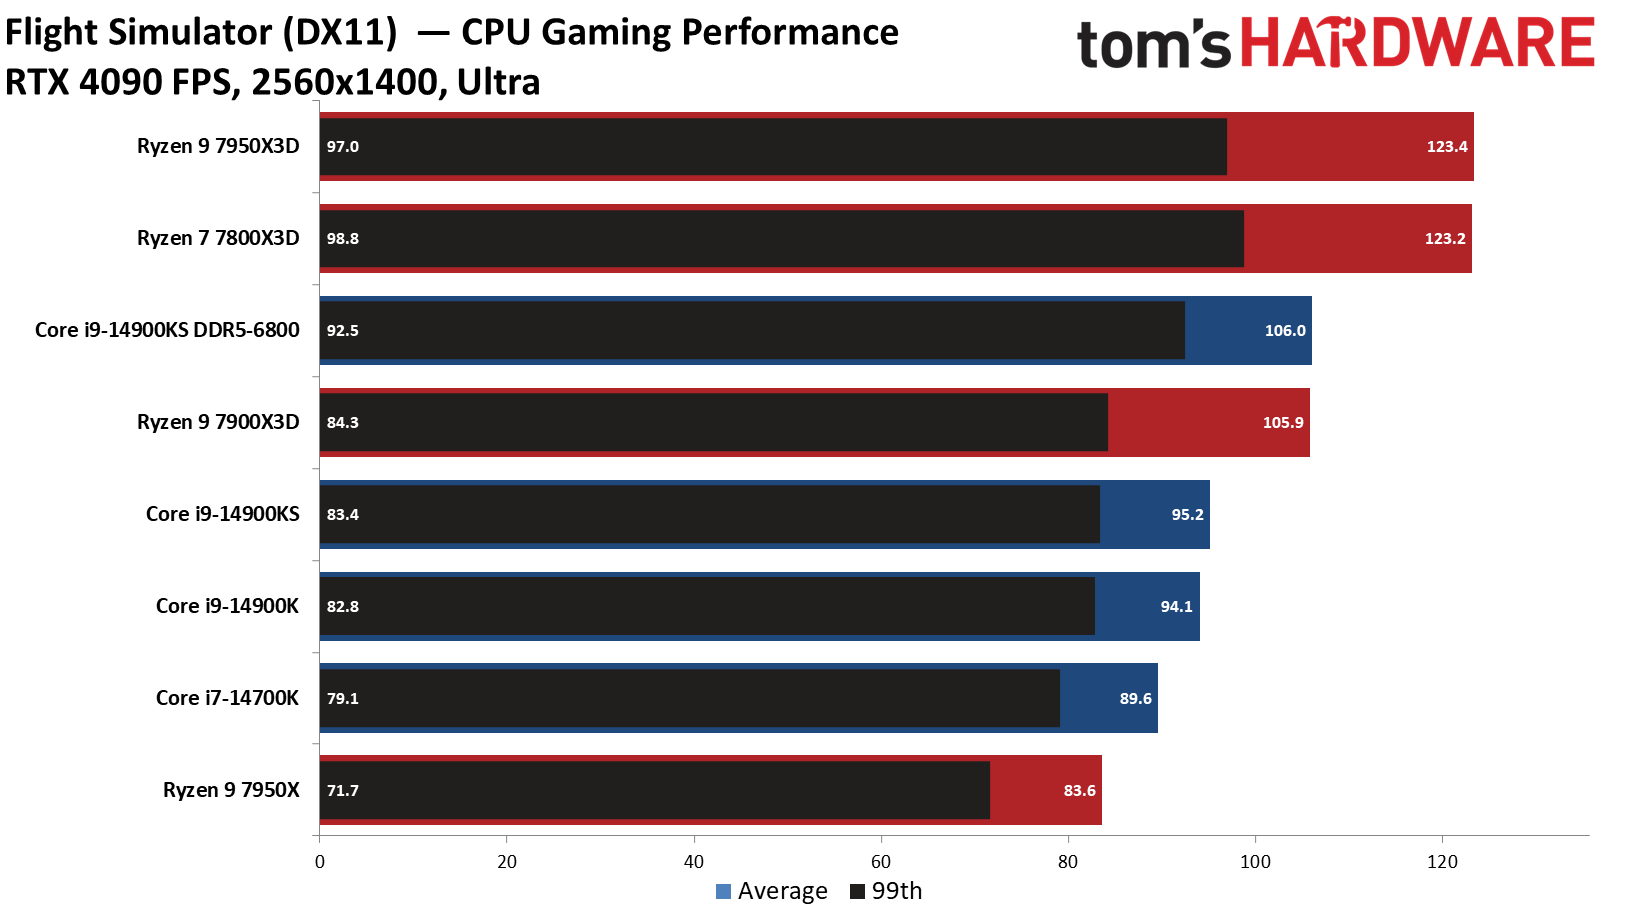
Microsoft Flight Simulator obviously benefits tremendously from the extra L3 cache, so the Ryzen 7000X3D chips are simply incredible in this title. This is the exception rather than the rule, but AMD's X3D chips can run over 25% faster than Intel's chips at both 1080p and 1440p in this title. Note that this game is fully CPU limited on the RTX 4090, up until 4K ultra.
Watch Dogs Legion on Intel Core i9-14900KS
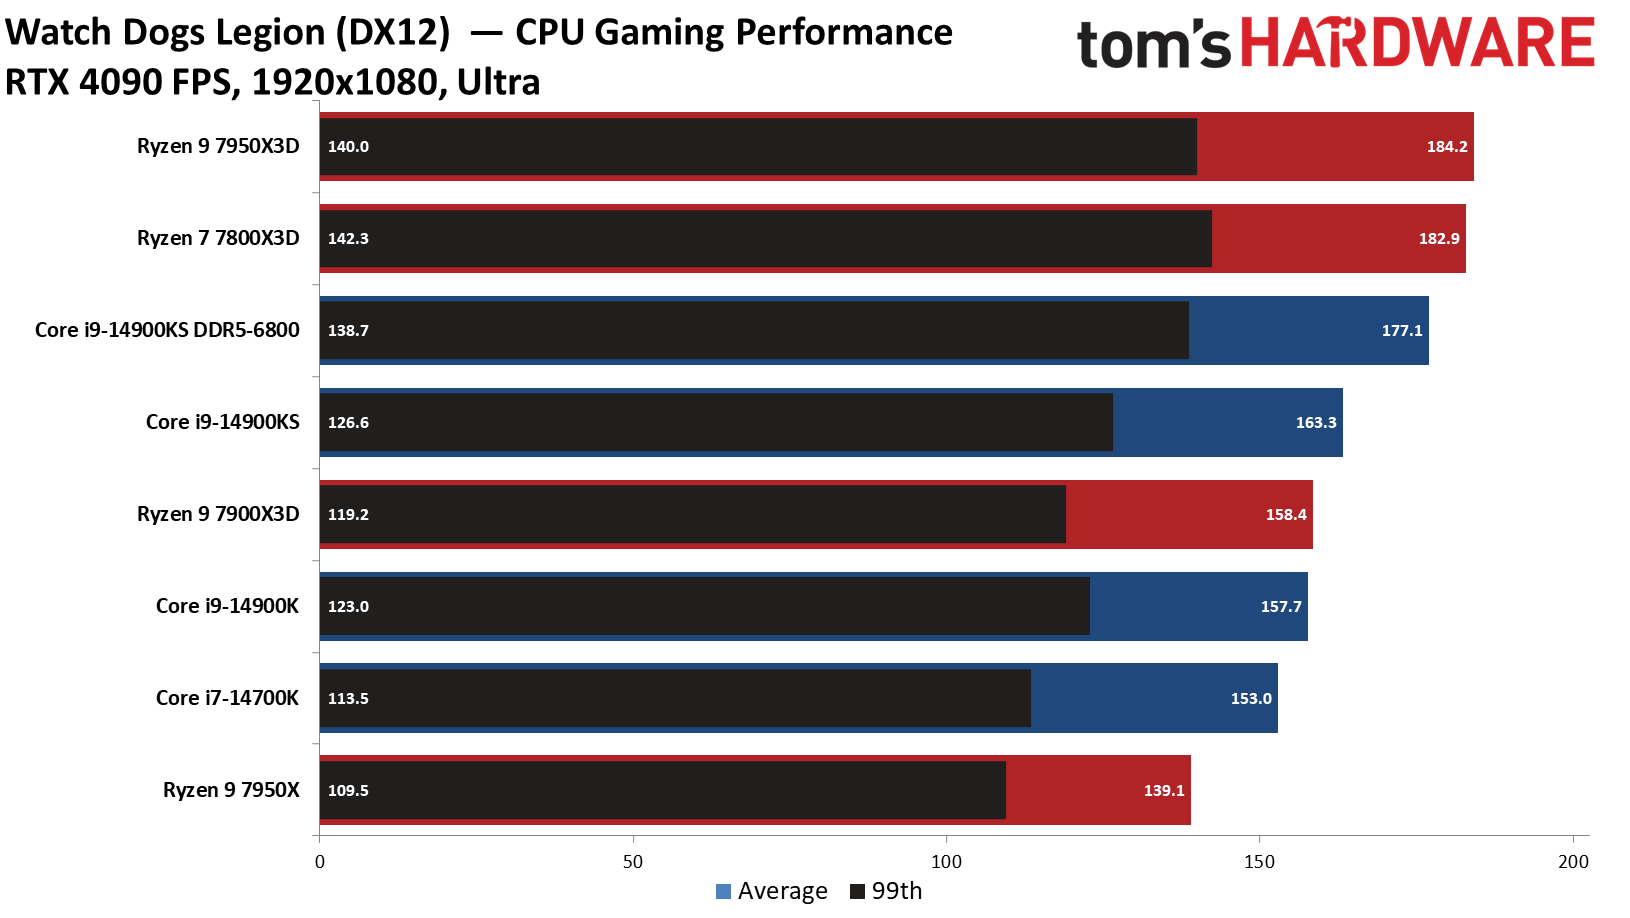
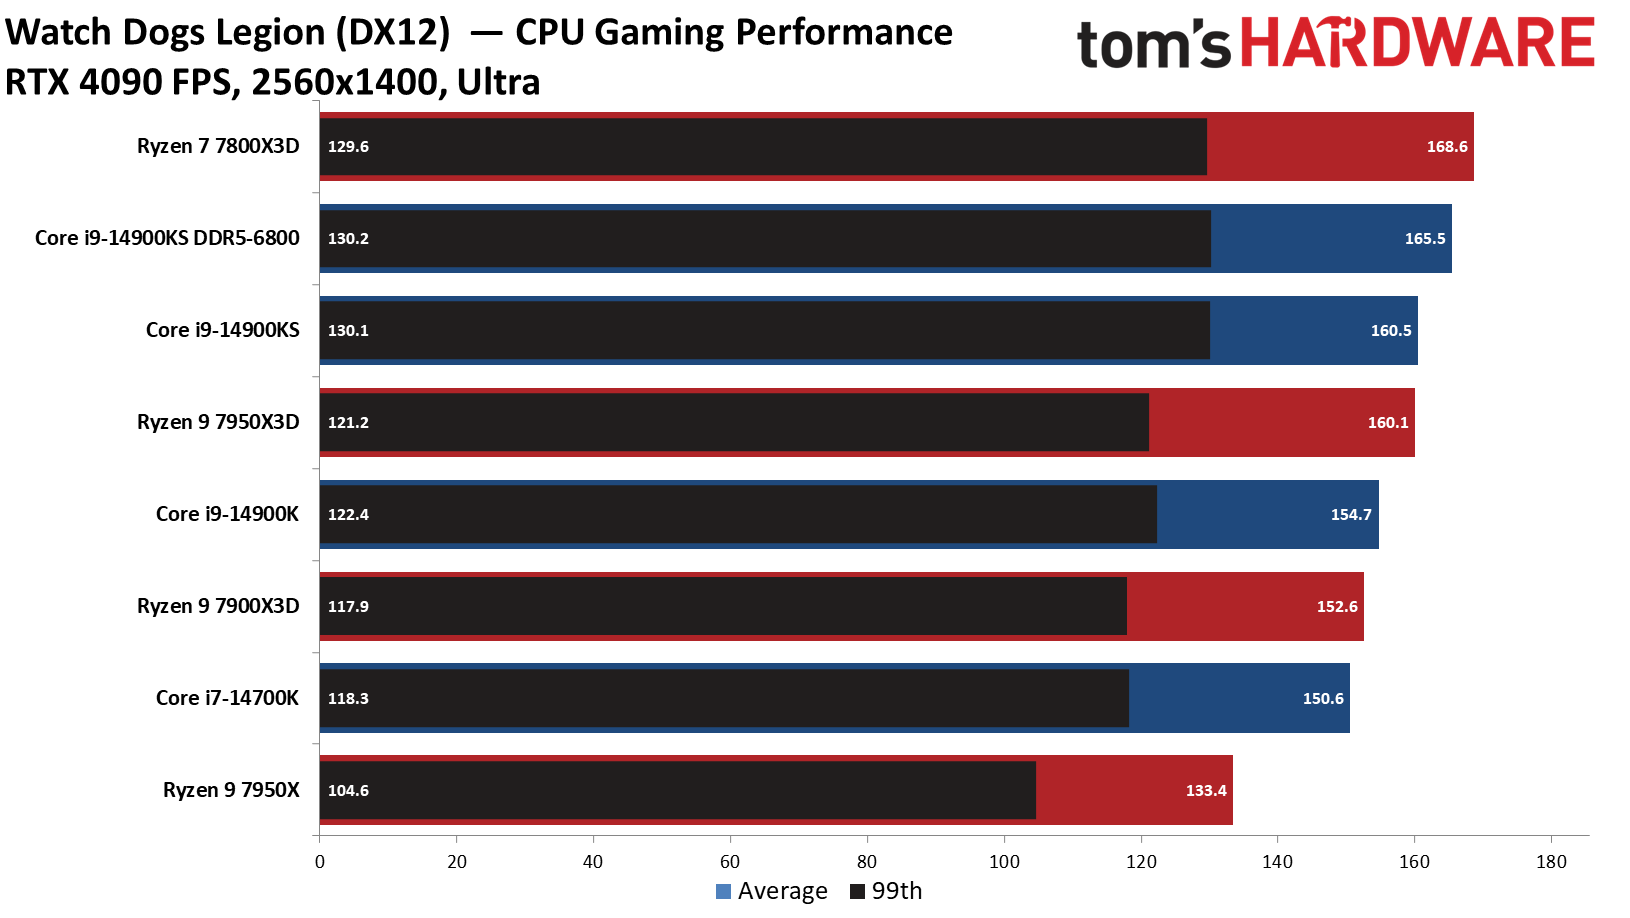
Watch Dogs Legion also favors AMD's X3D chips — not by quite the large margins as Flight Simulator, but the 7950X3D this time comes out on top, while the 7800X3D lands in second place by less than two fps. The deltas shrink at 1440p, but we're still not fully GPU limited.
Productivity Benchmarks on Intel Core i9-14900KS — The TLDR:
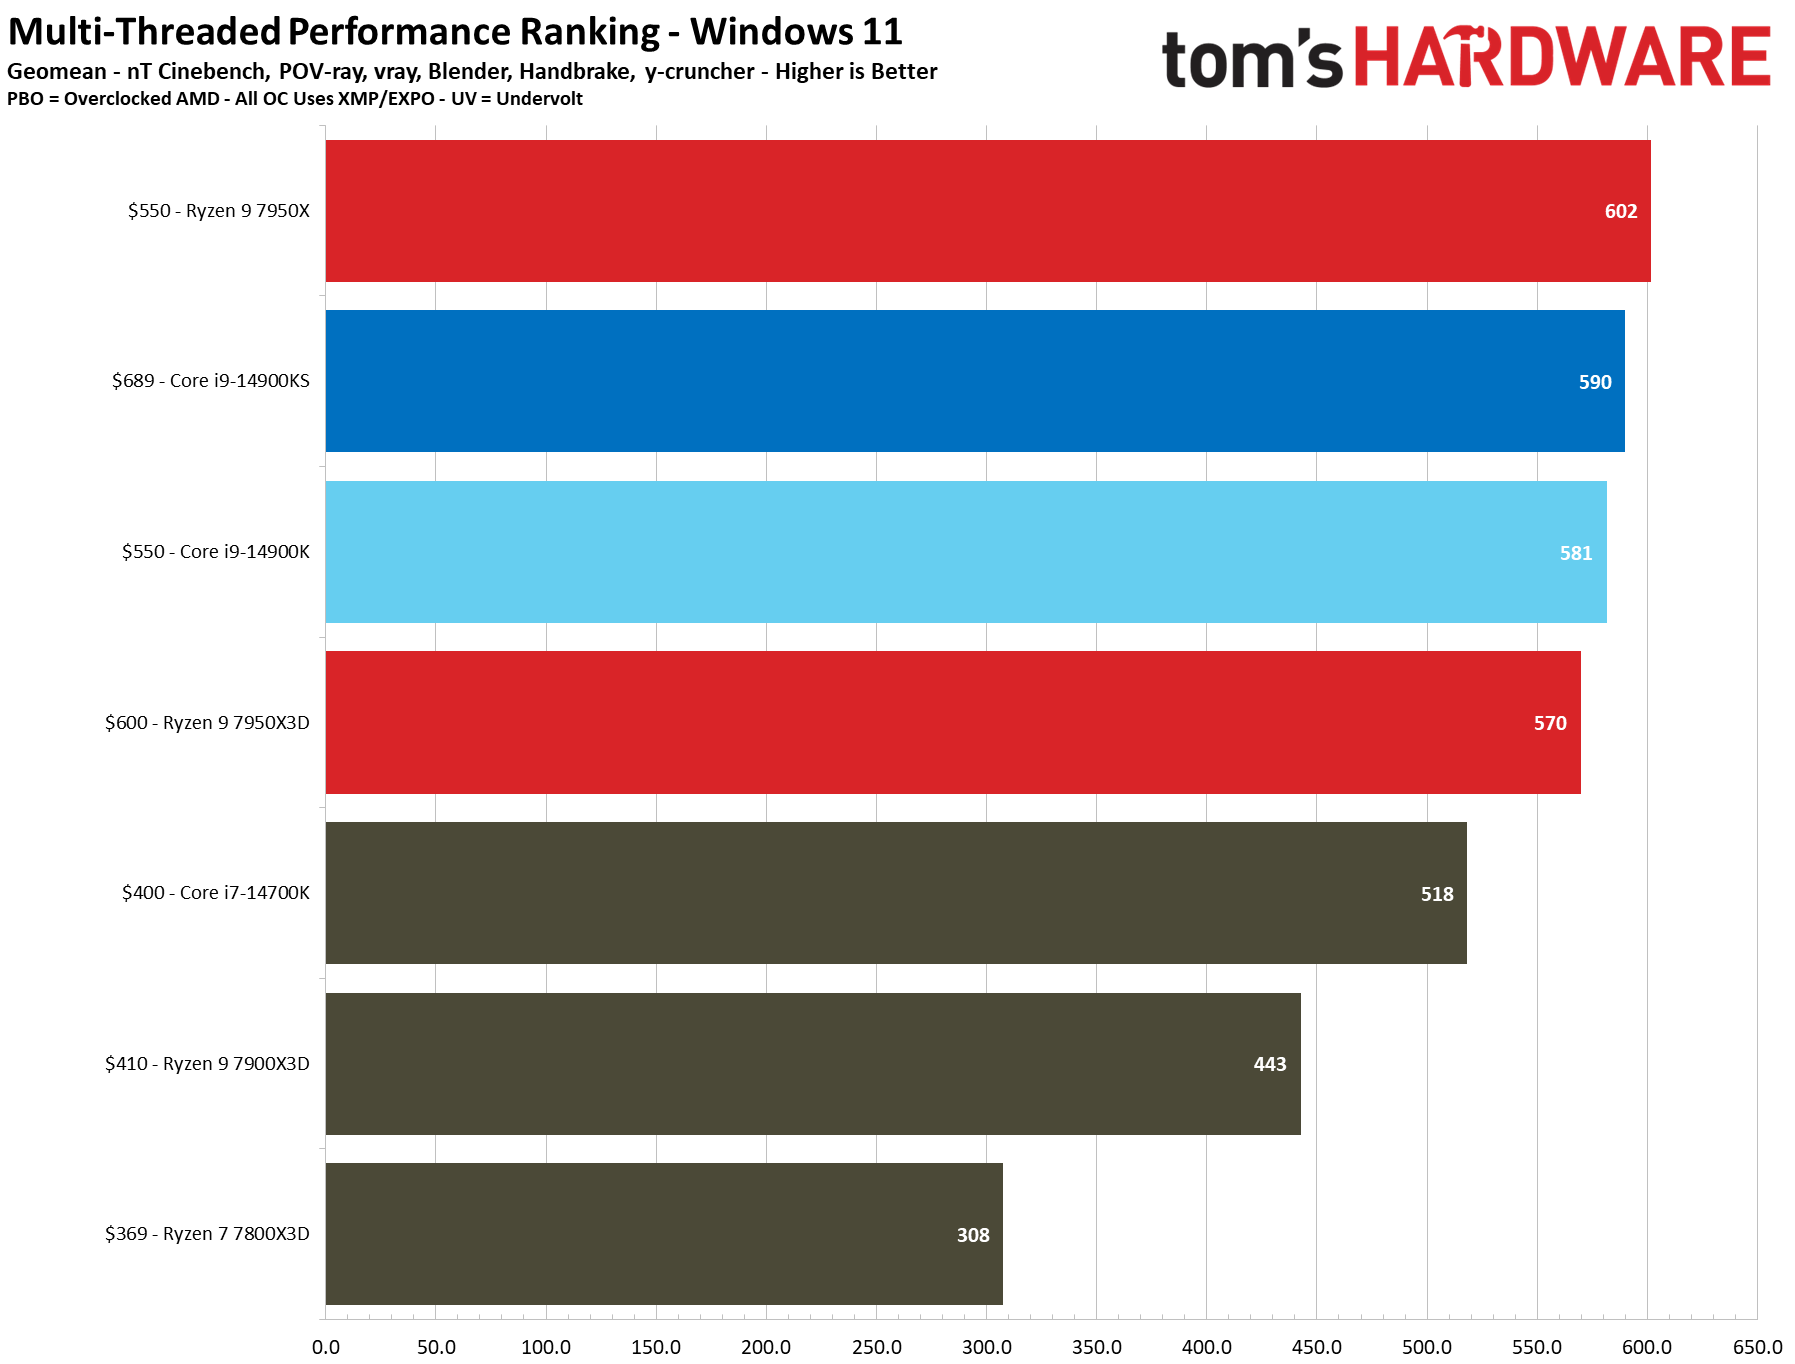
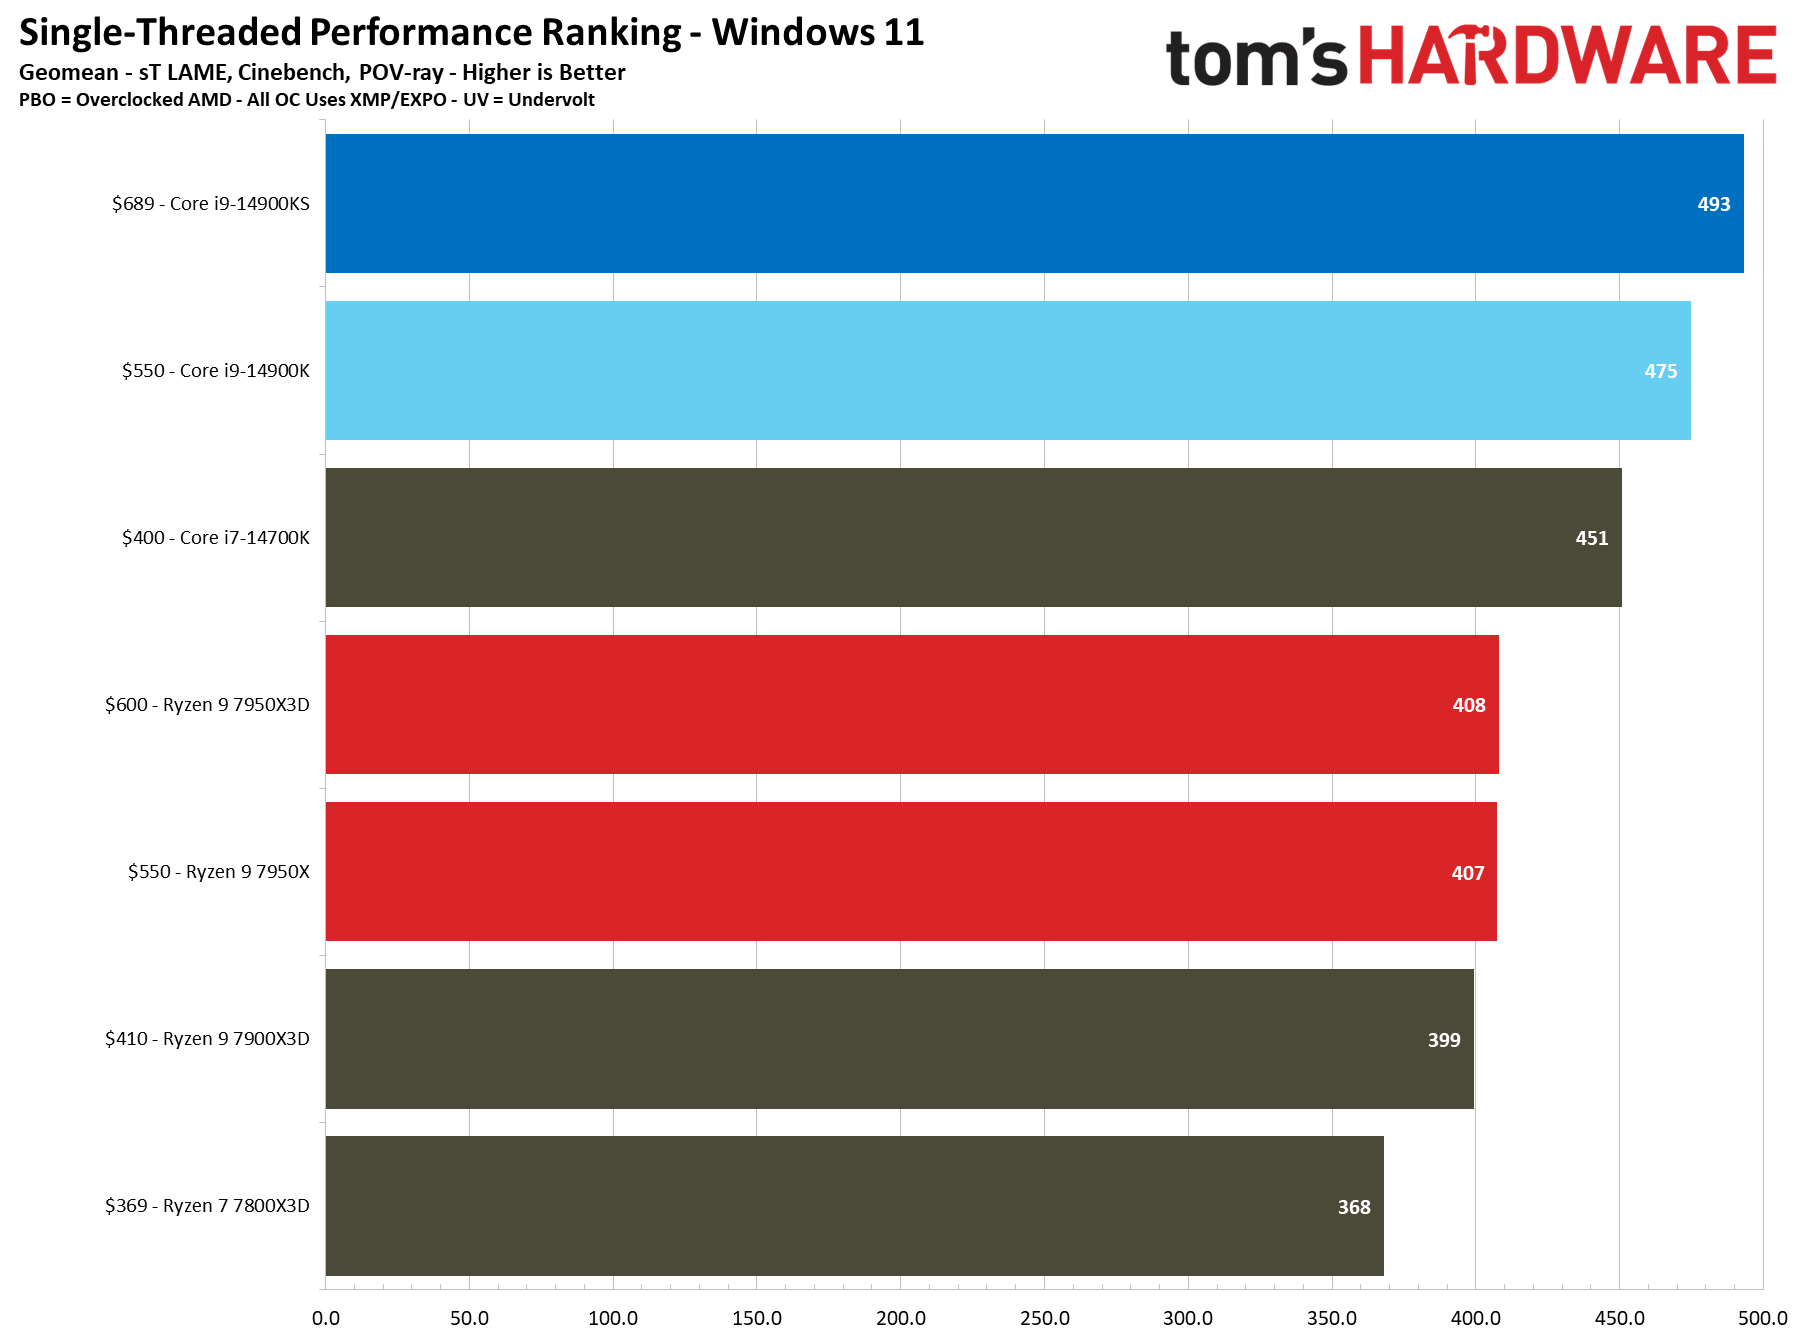
We can boil down productivity application performance into two broad categories: single- and multi-threaded. These slides show the geometric mean of performance in several of our most important tests in each category, but be sure to look at the expanded results below.
As expected, the Core i9-14900KS only shows marginal gains over the vanilla 14900K, with a 3.8% lead in single-threaded work and a 1.5% lead in multi-threaded work. That isn't a great deal, given that the 14900KS is 25% more expensive ($139). We didn't have time to run the chip through its paces with the faster DDR5-6800 memory, but those same gains would also apply to the 14900K, resulting in nearly identical performance gains.
Naturally, there might be a few applications where the KS model would have a tangible lead over the vanilla model, but realistically we're looking at an extra 200 MHz, or about 3.3% at best. Still, aside from an edge case that applies directly to your workload, you should stick with the 14900K if you're looking for the best value.
The $550 Ryzen 9 7950X is 2% faster than the $689 Core i9-14900KS in our overall measurement of multi-threaded performance, which is quite a stellar result given the price differential. Meanwhile, the Core i9-14900KS is 3.5% faster than the Ryzen 9 7950X3D. As we saw above, the 7950X3D is geared more toward gaming than apps, which is a strong showing from the Ryzen chip.
Both Ryzen 7950X/3D chips are formidable foes in threaded work. Still, the Core i9-14900KS is a whopping 21% faster in our cumulative single-threaded metric, showing that the 6.2 GHz clock rate delivers dividends in lightly threaded work. That will equate to a snappier desktop experience. But you could get a similar experience with the standard 14900K and save some cash in the process.
Rendering Benchmarks on Intel Core i9-14900KS
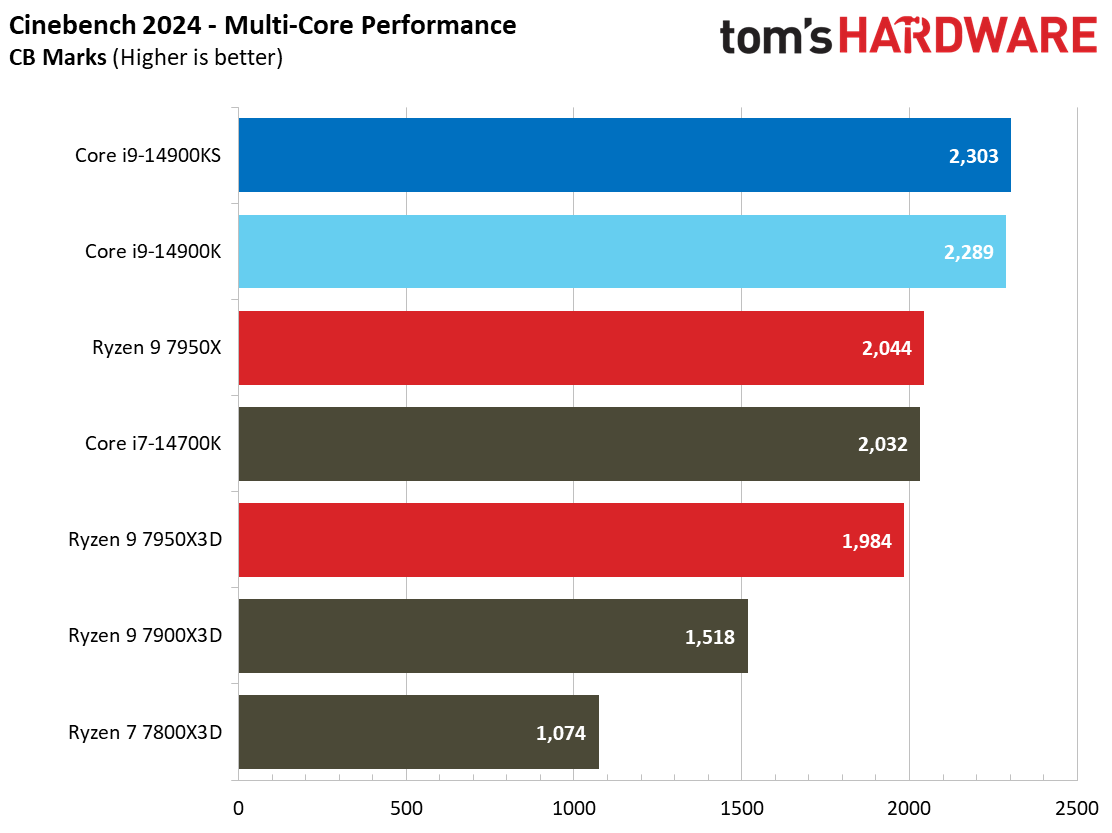
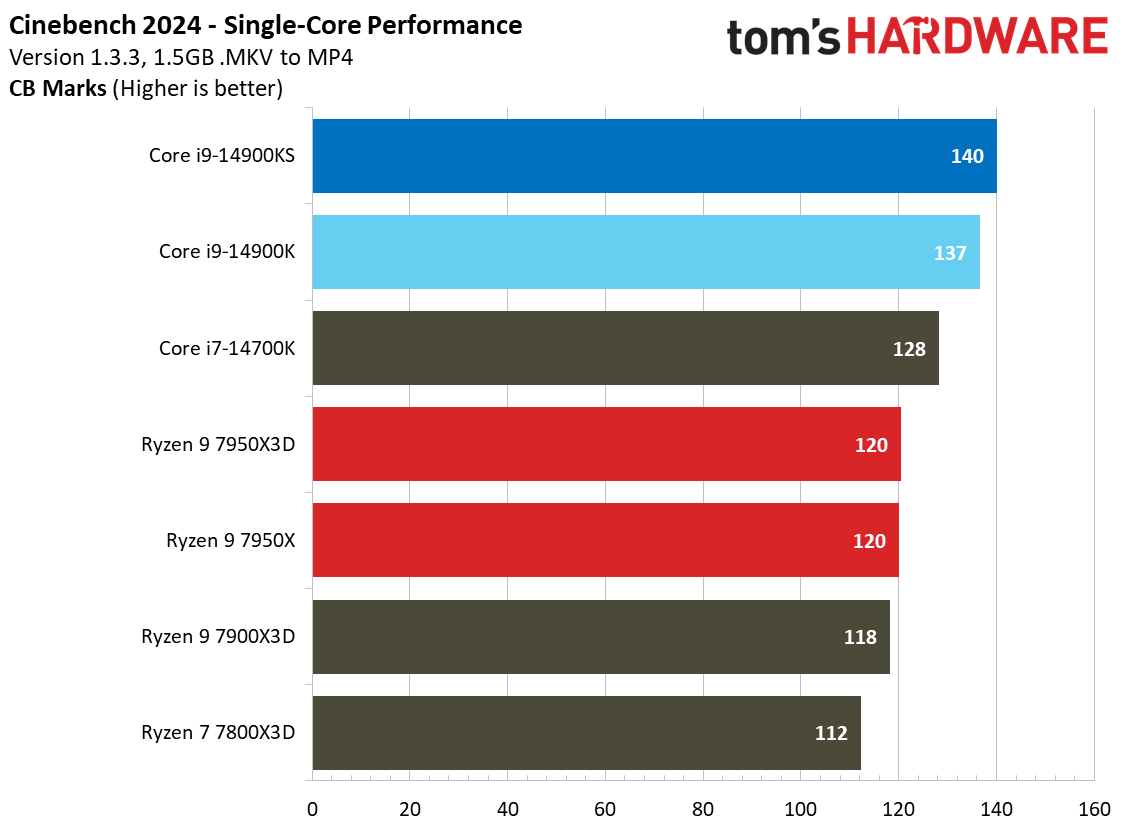
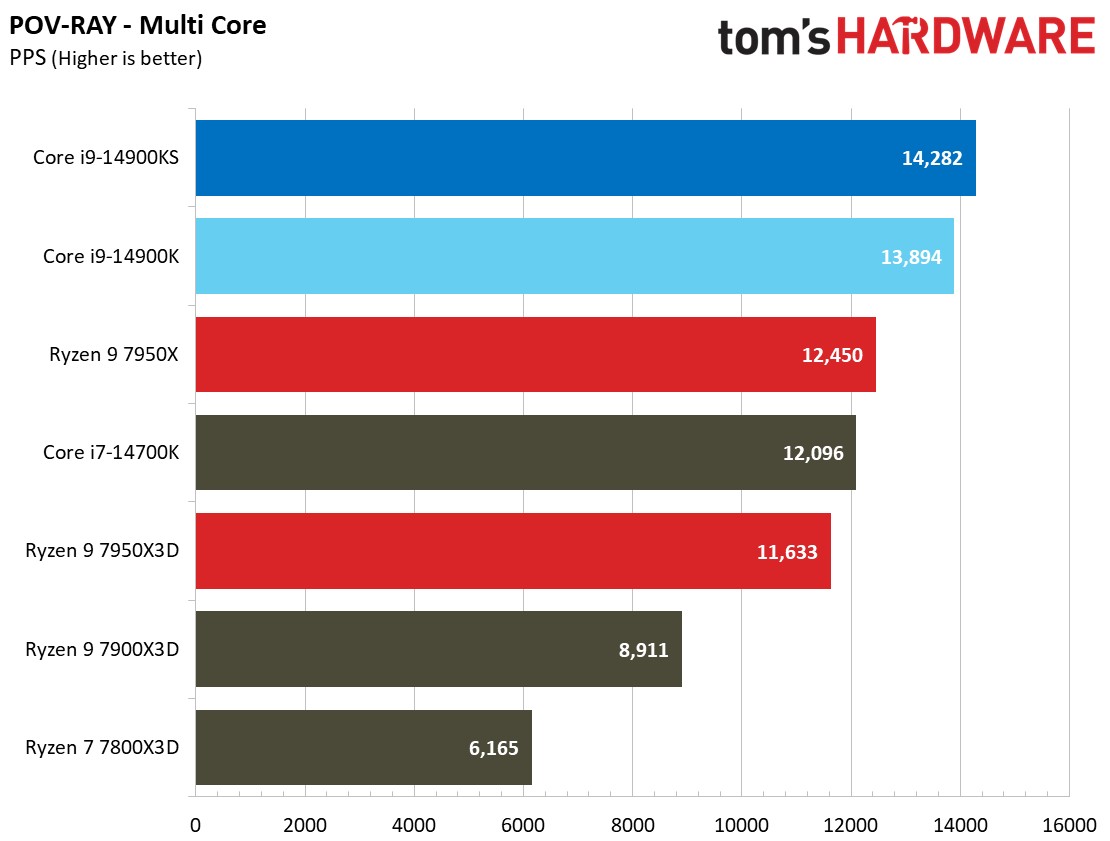
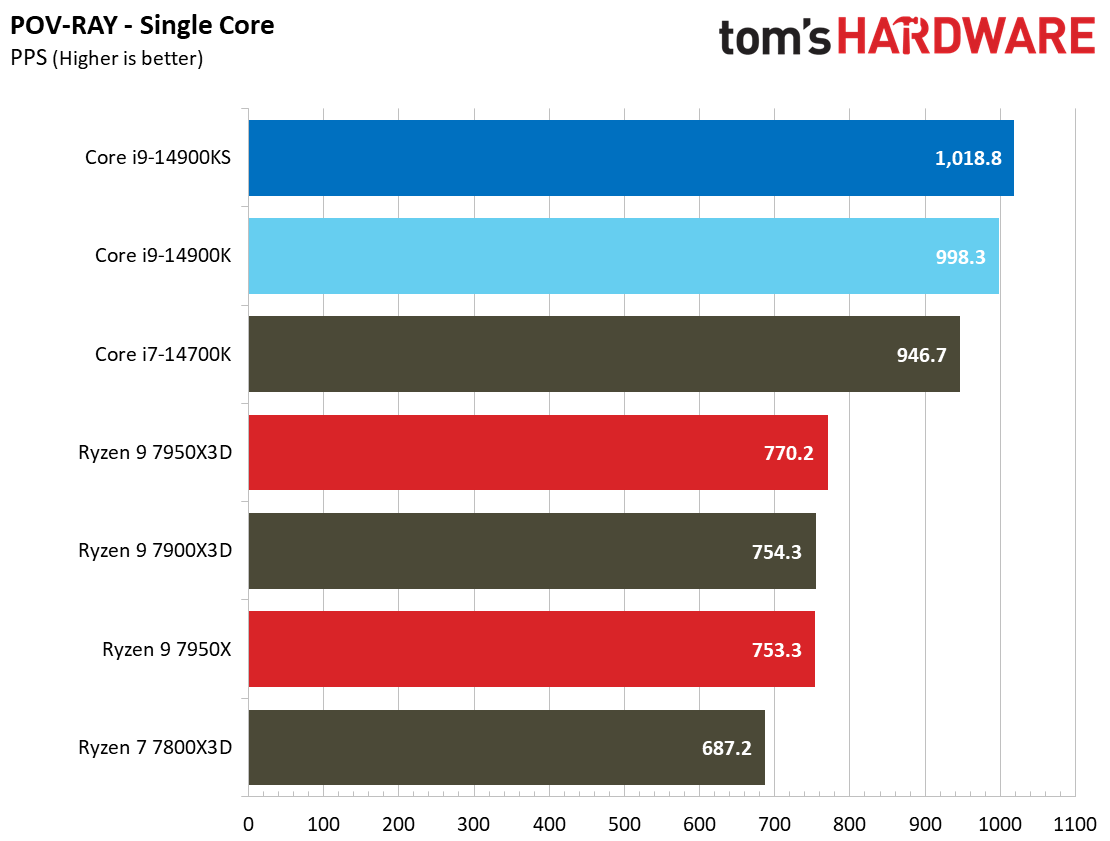
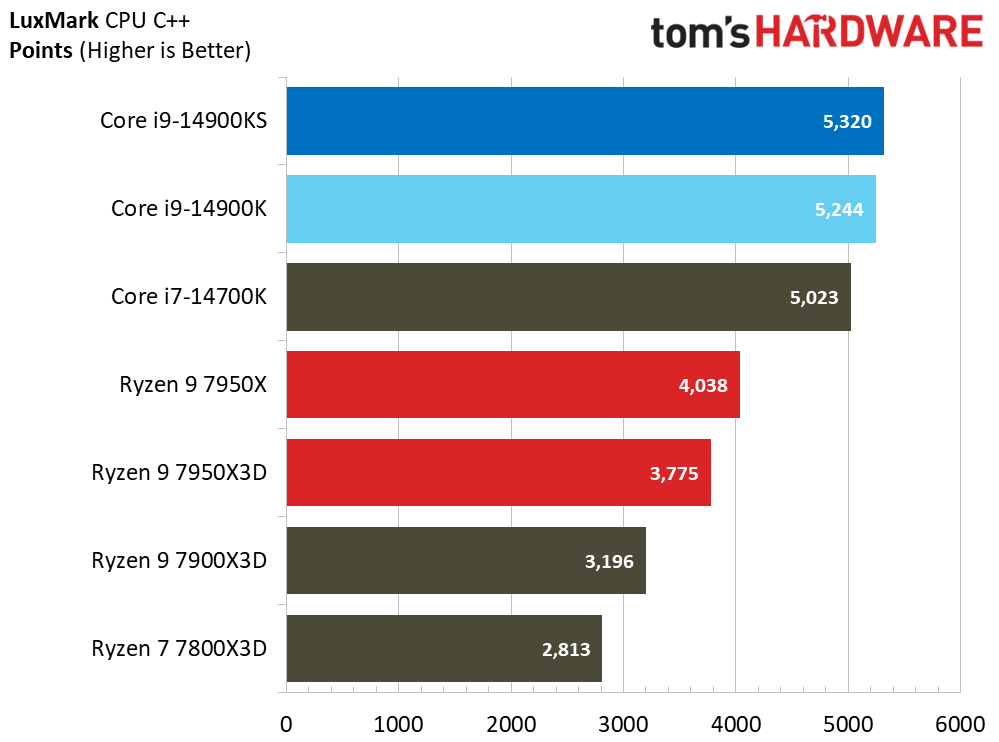
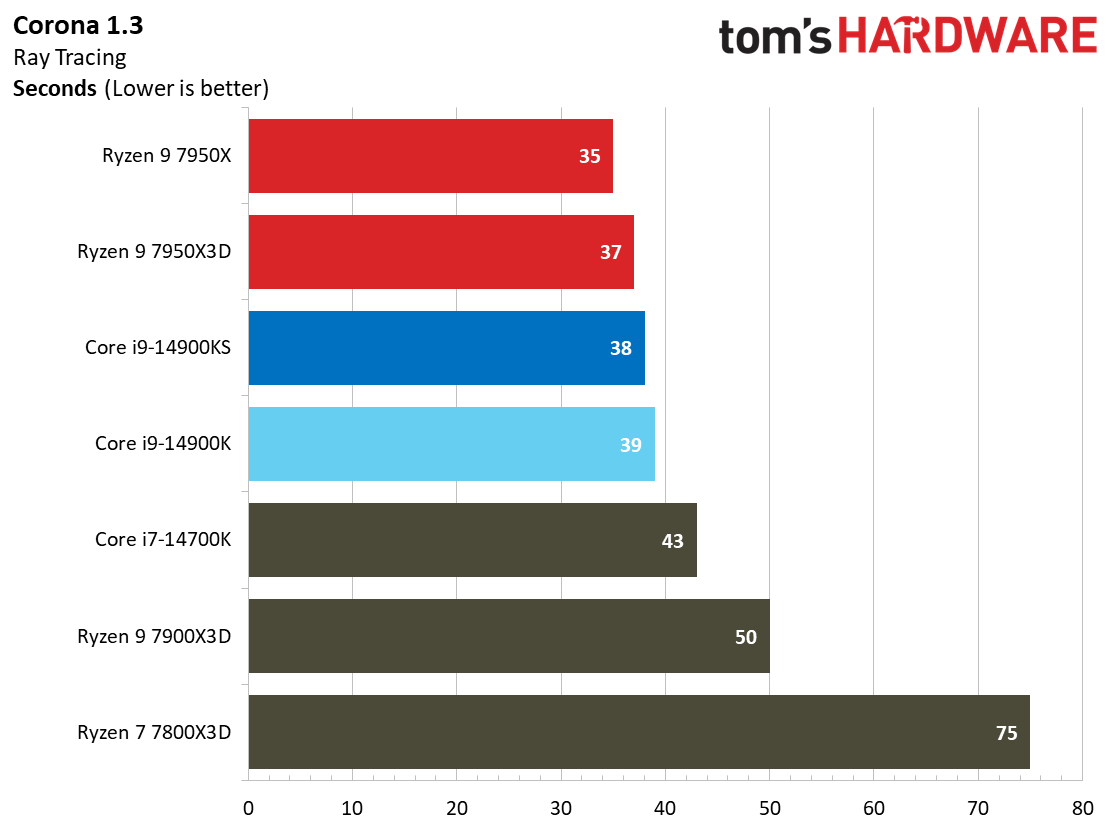
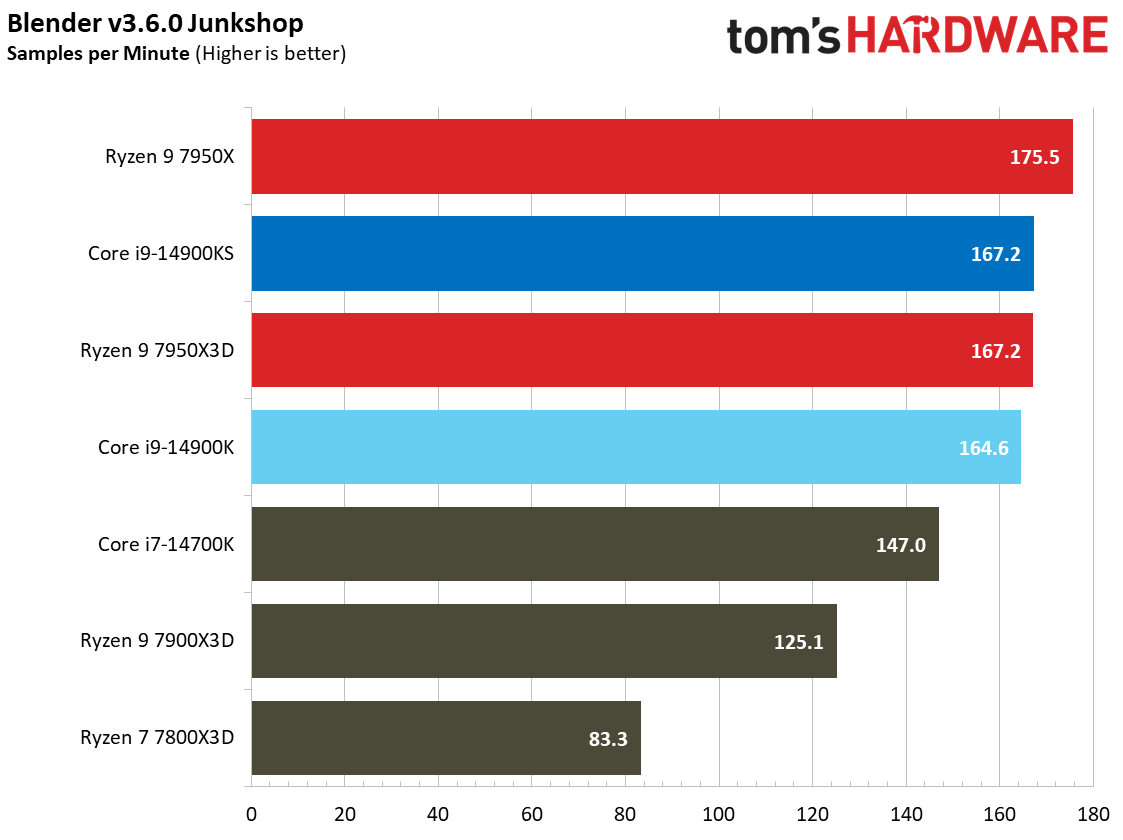
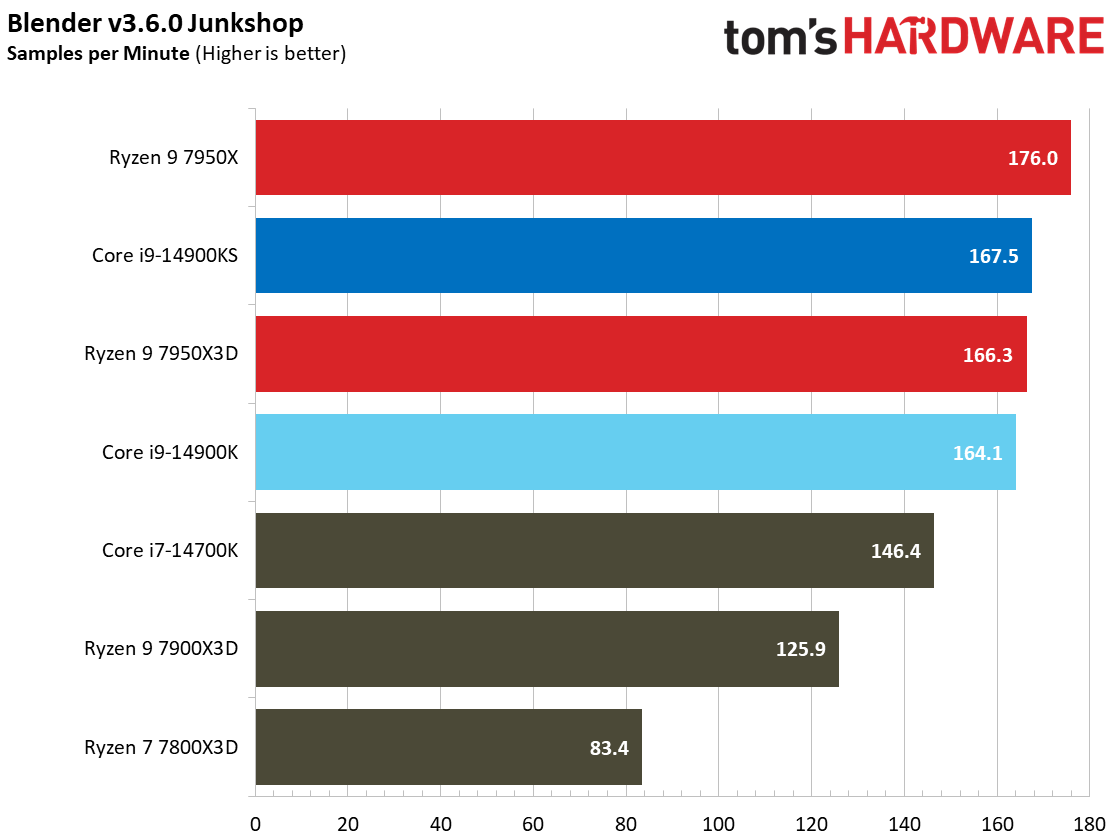
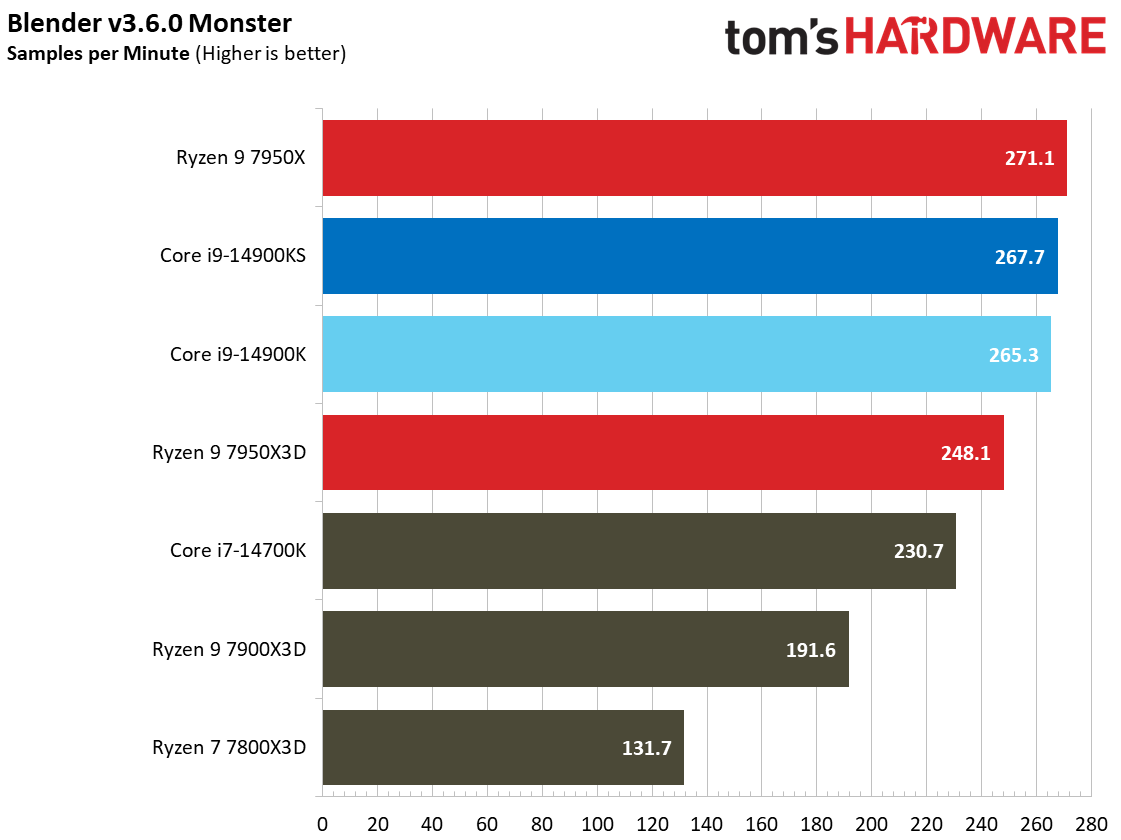
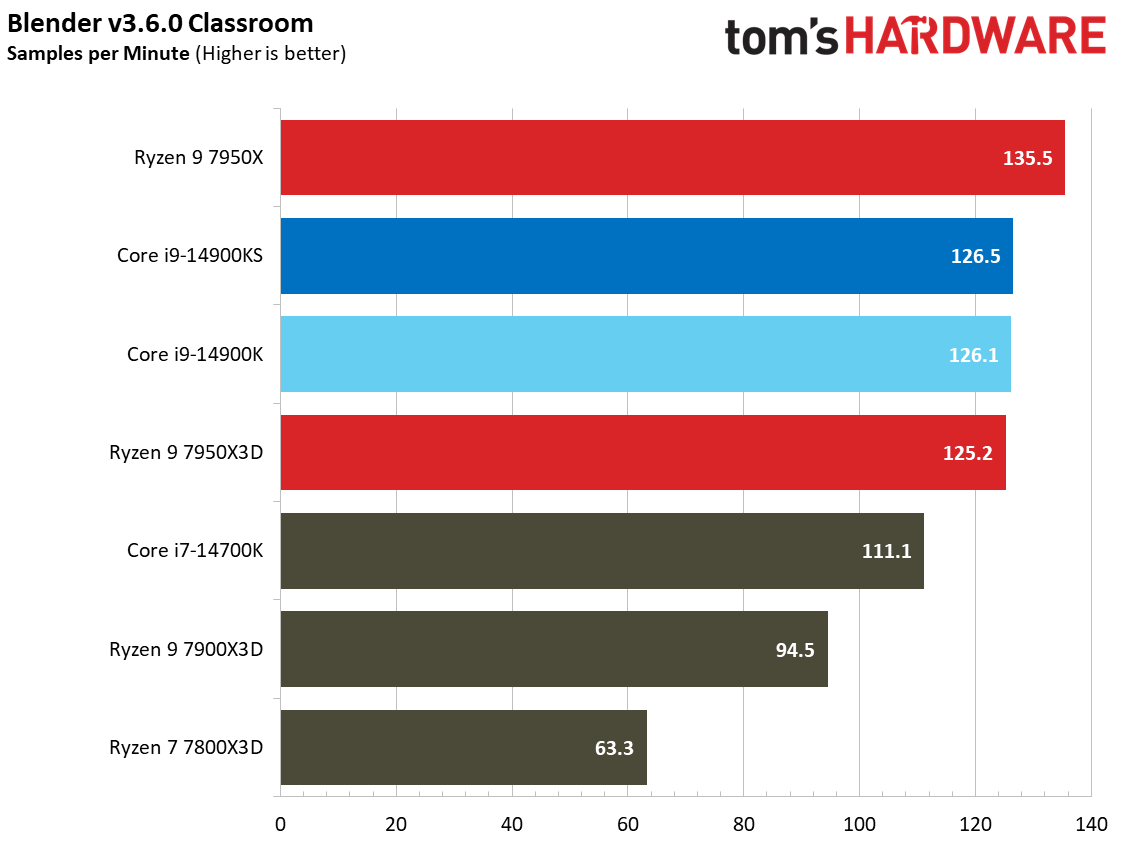
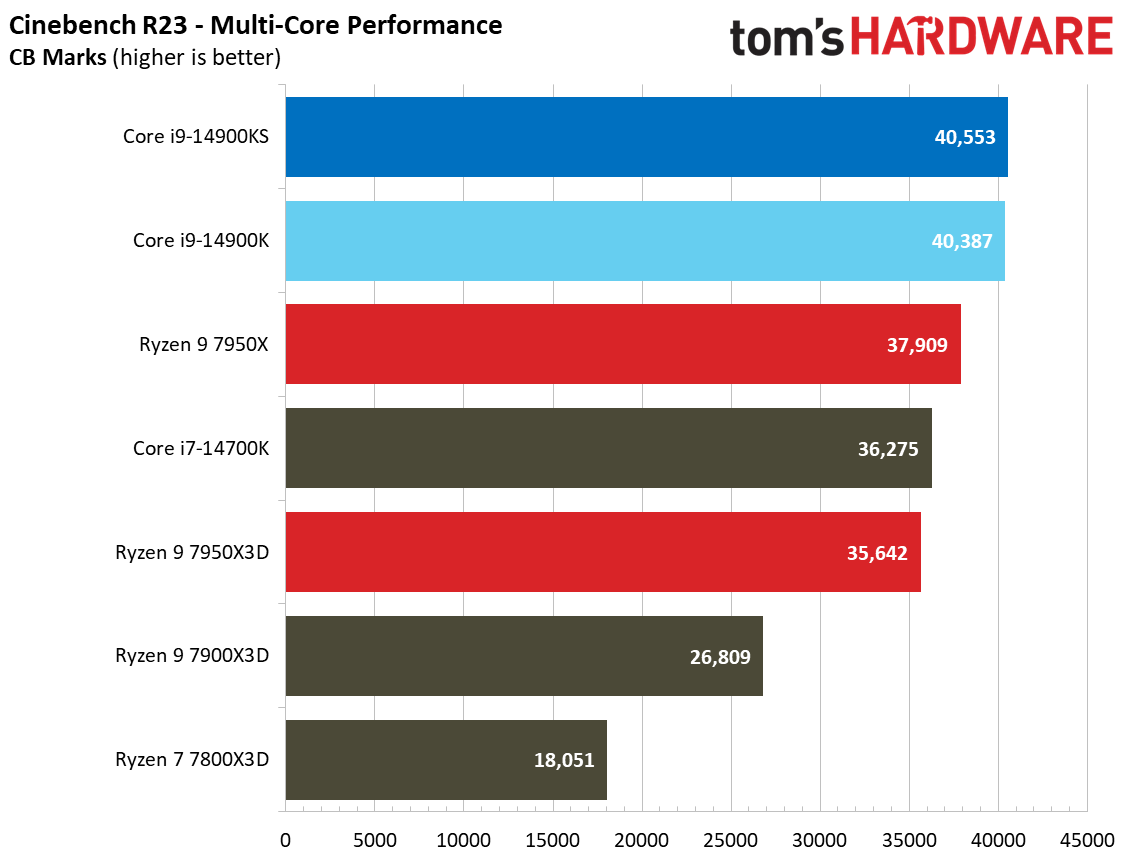
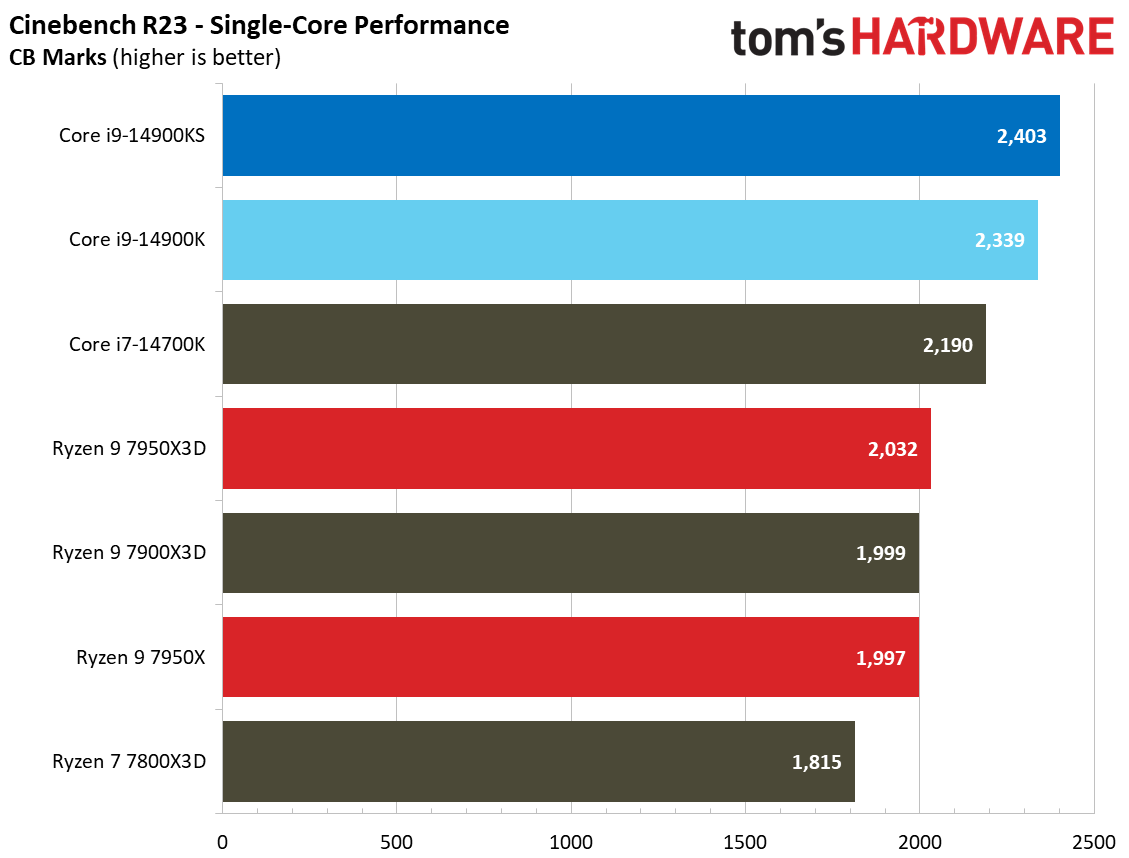
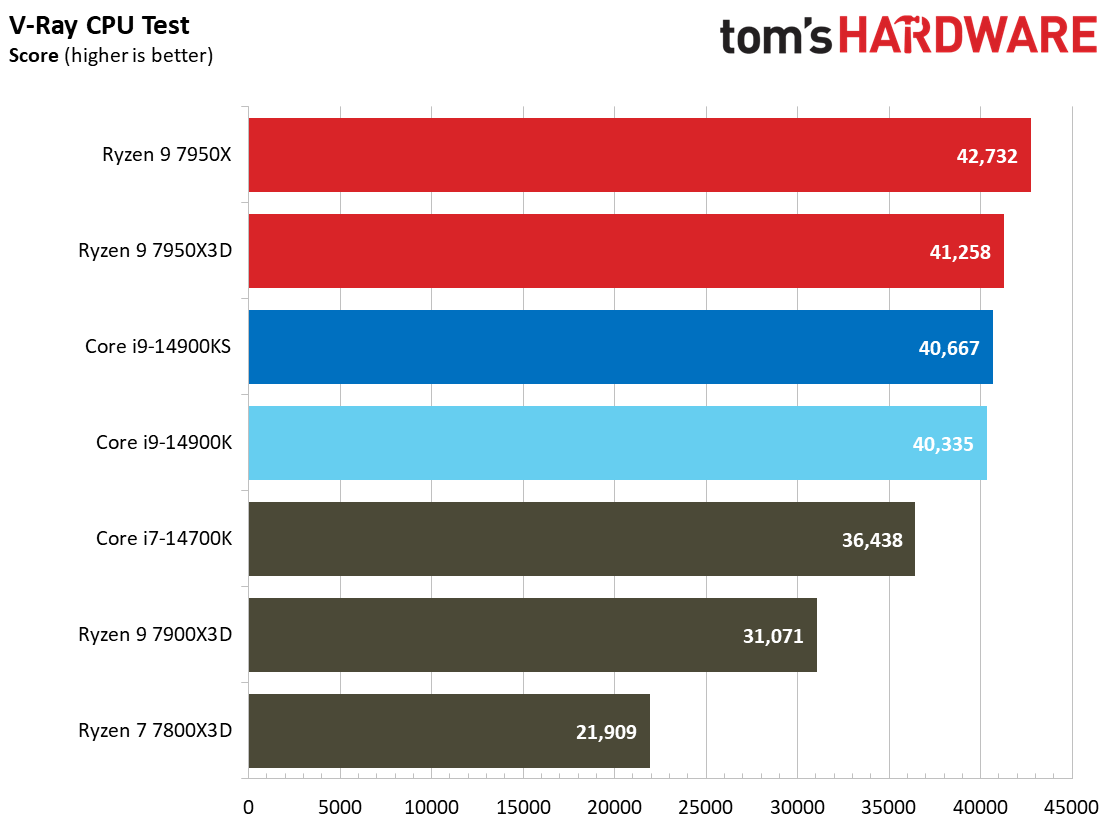
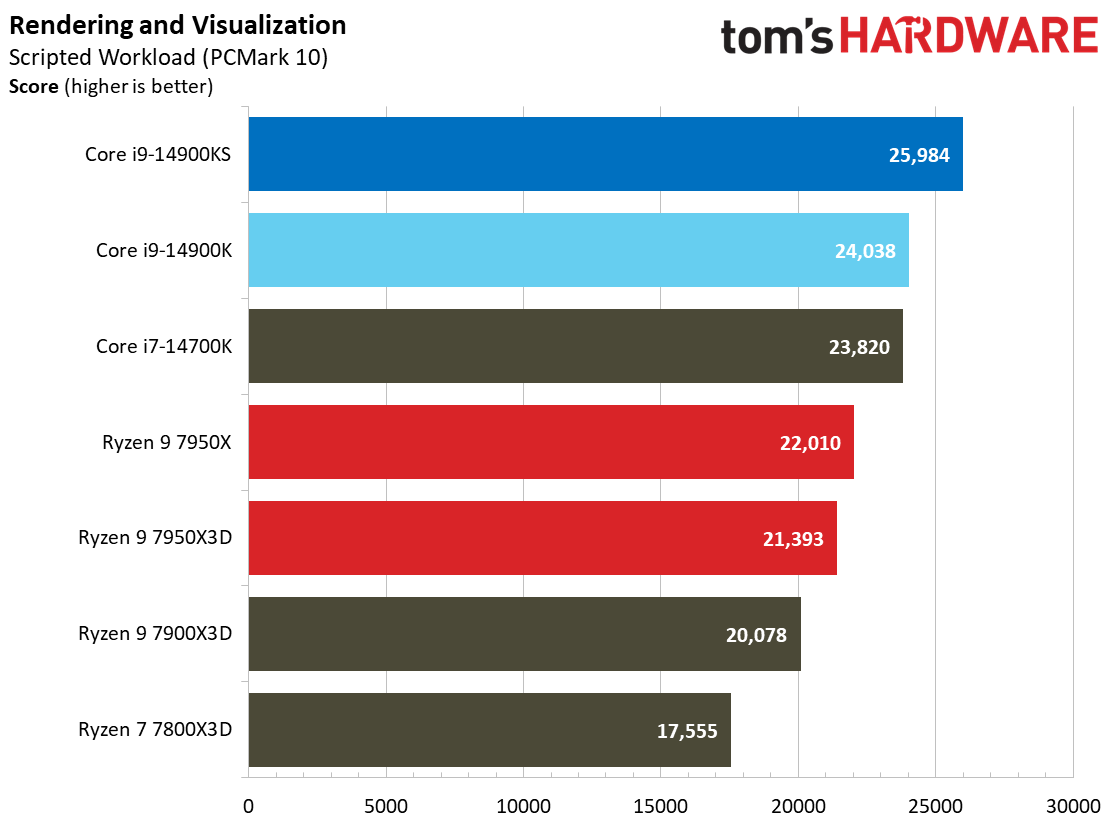
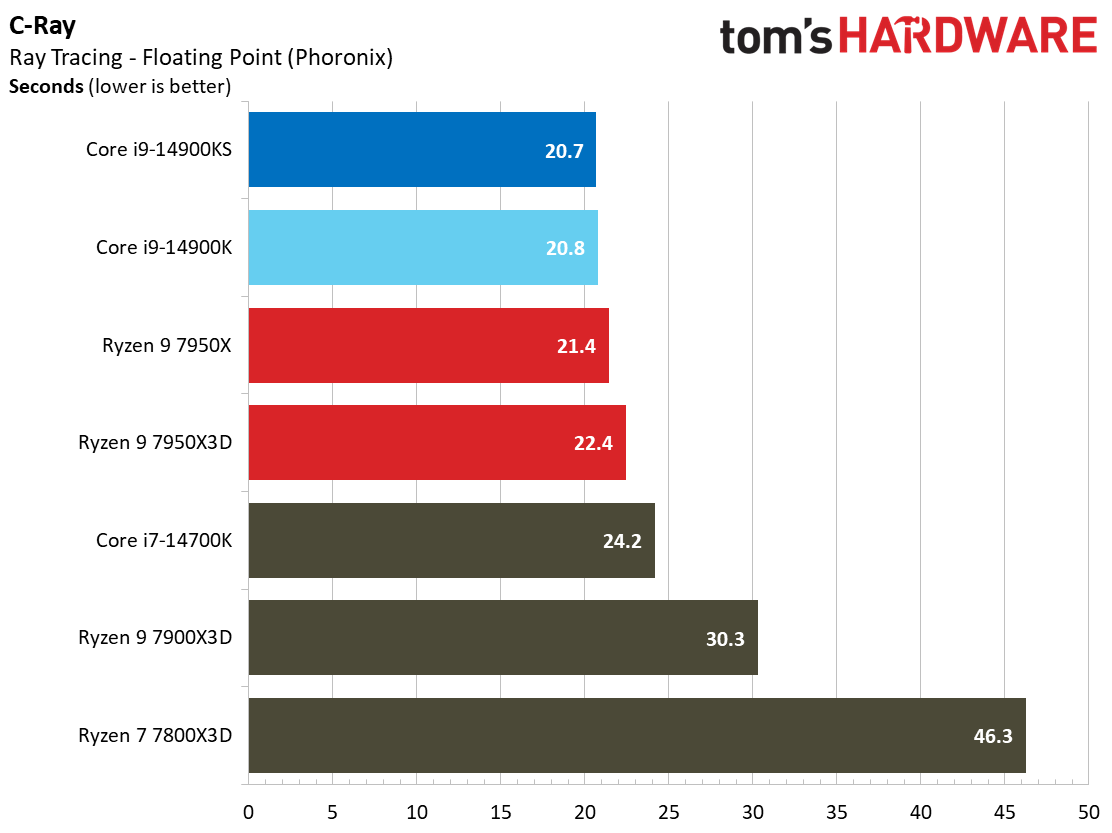
Overall, the two 14900K/S chips are closely matched in terms of threaded horsepower, but the KS carves out a slight lead in every benchmark. It can hit 100 MHz higher on the multi-threaded clocks, which represents a 1.8% theoretical improvement. The Intel chips trade blows with the Ryzen 9 7950X throughout this series of benchmarks, but the 7950X3D isn't quite as potent due to its use of a 3D-stacked L3 cache that restricts clock speeds on one of the CPU chiplets.
Encoding Benchmarks on Intel Core i9-14900KS
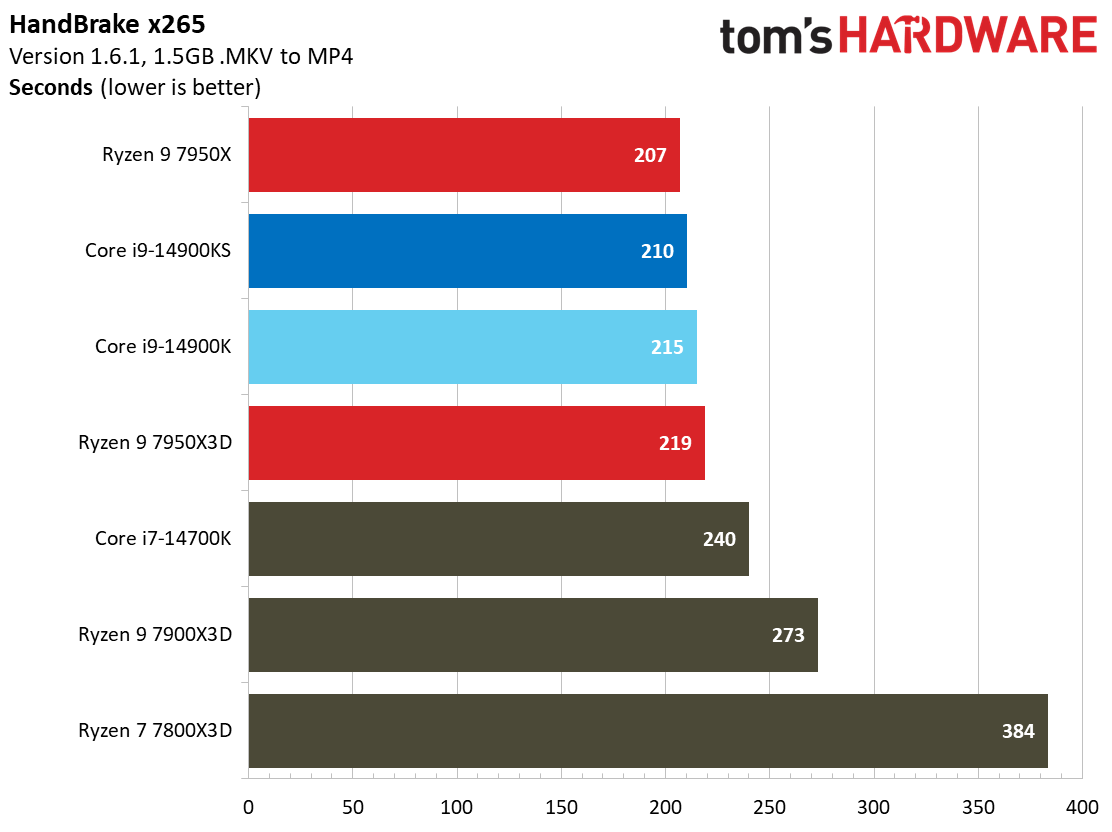
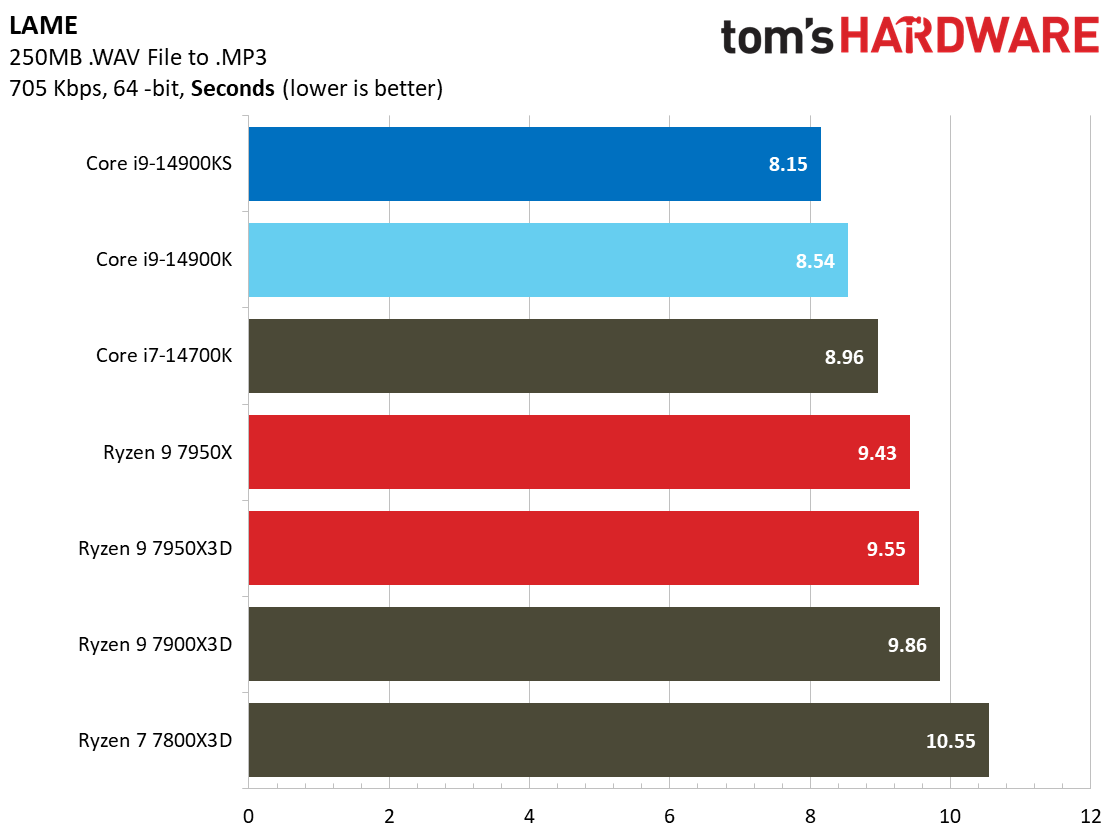
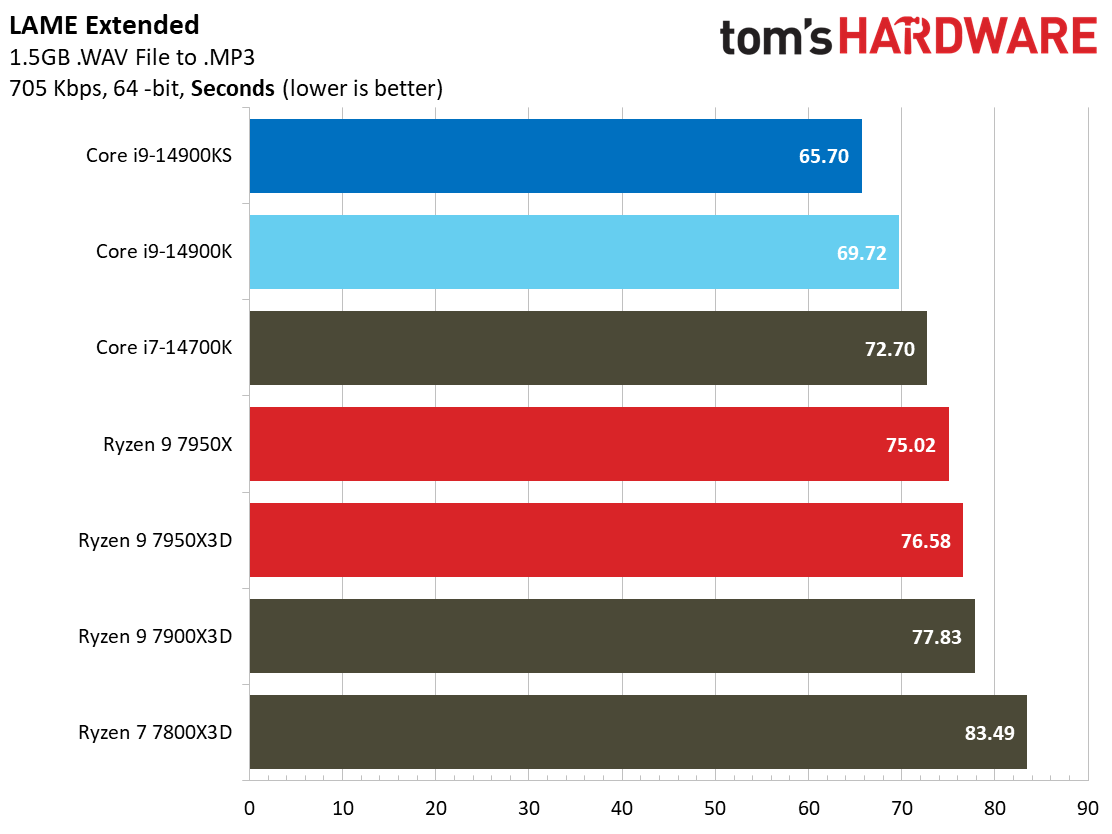
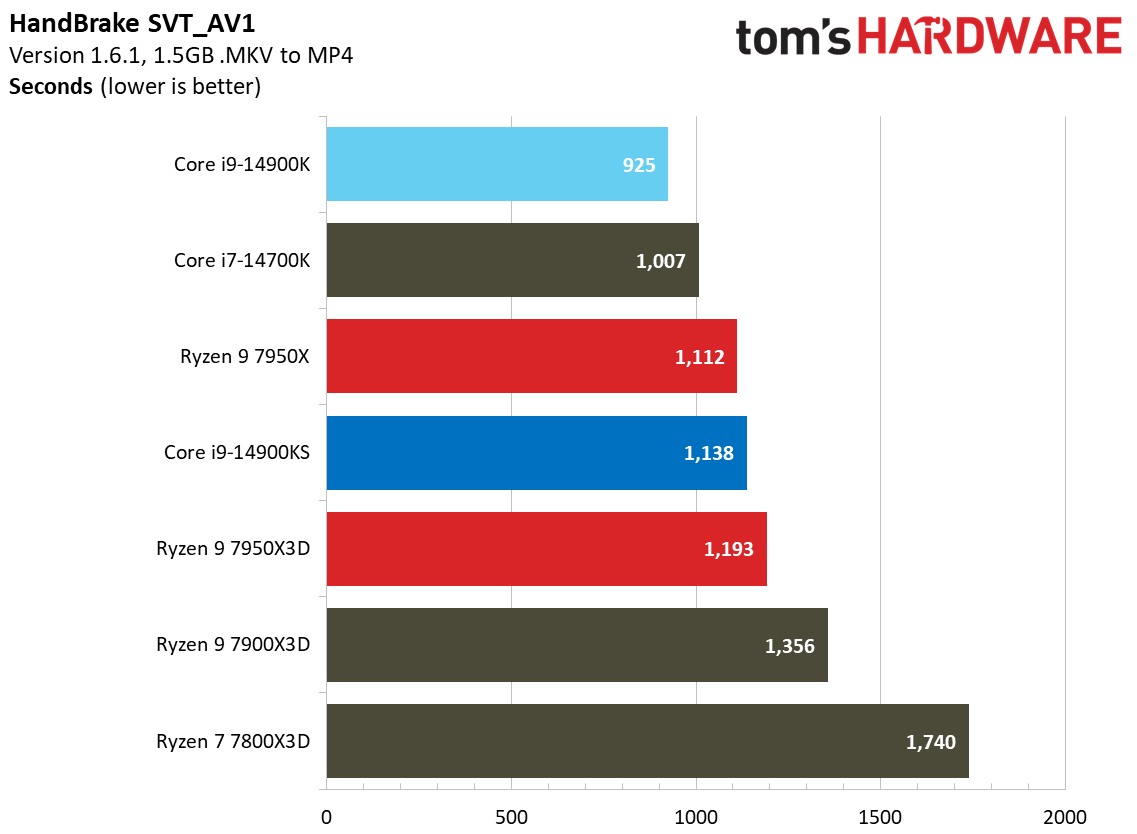
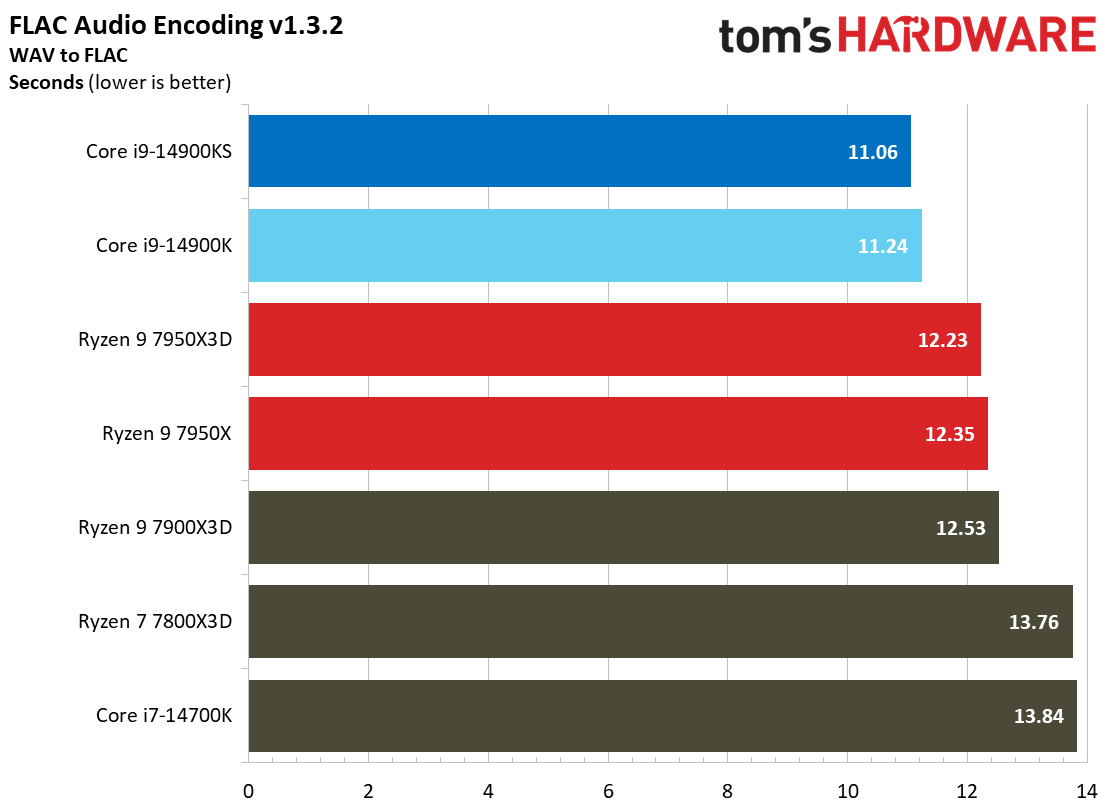
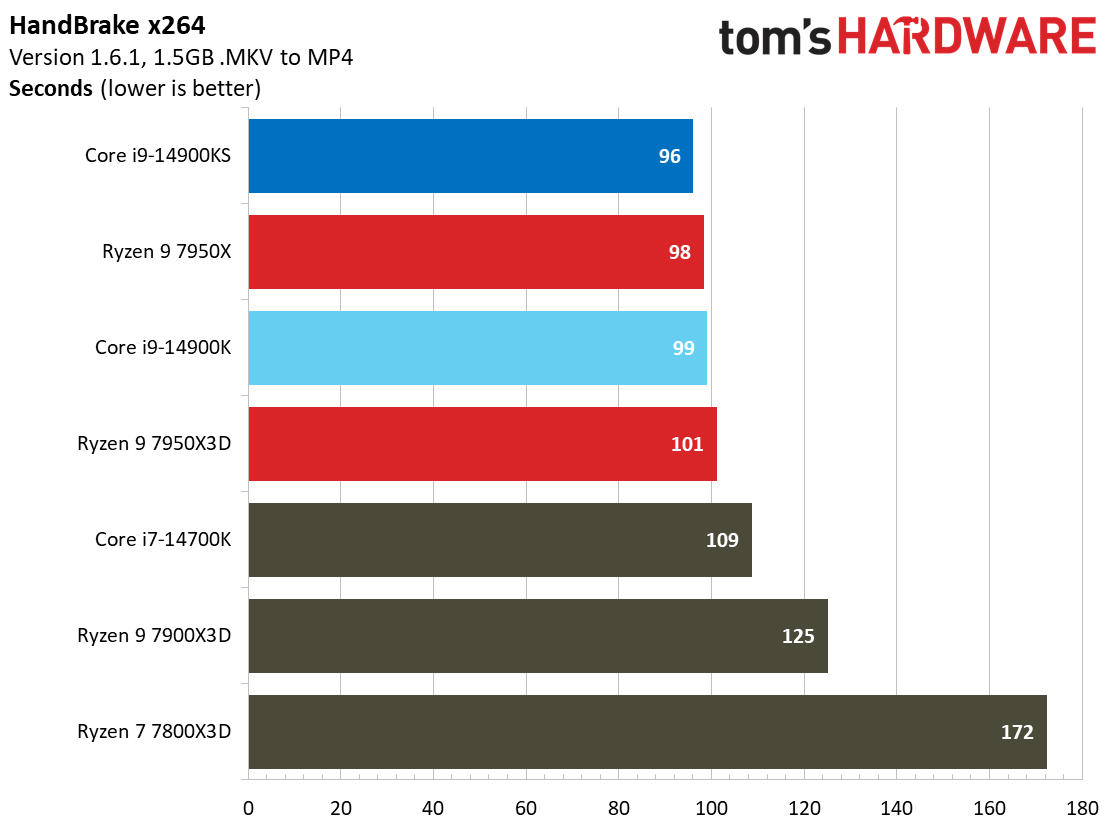
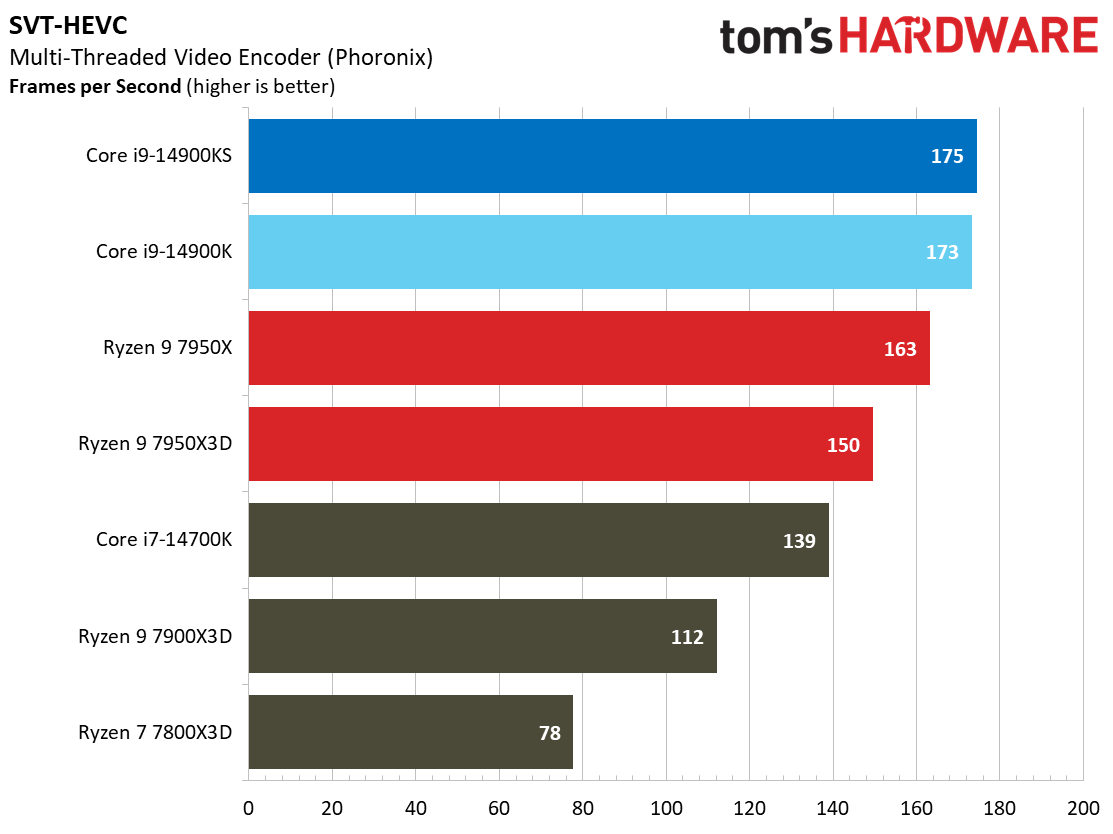
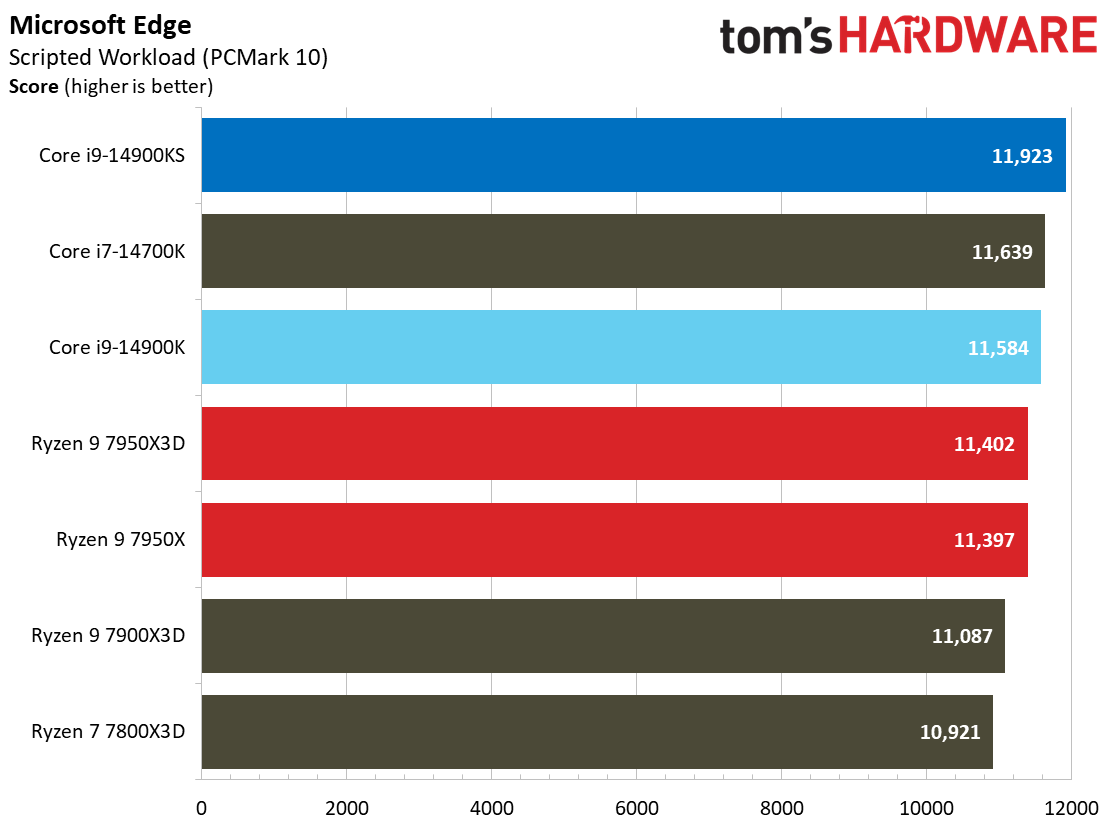
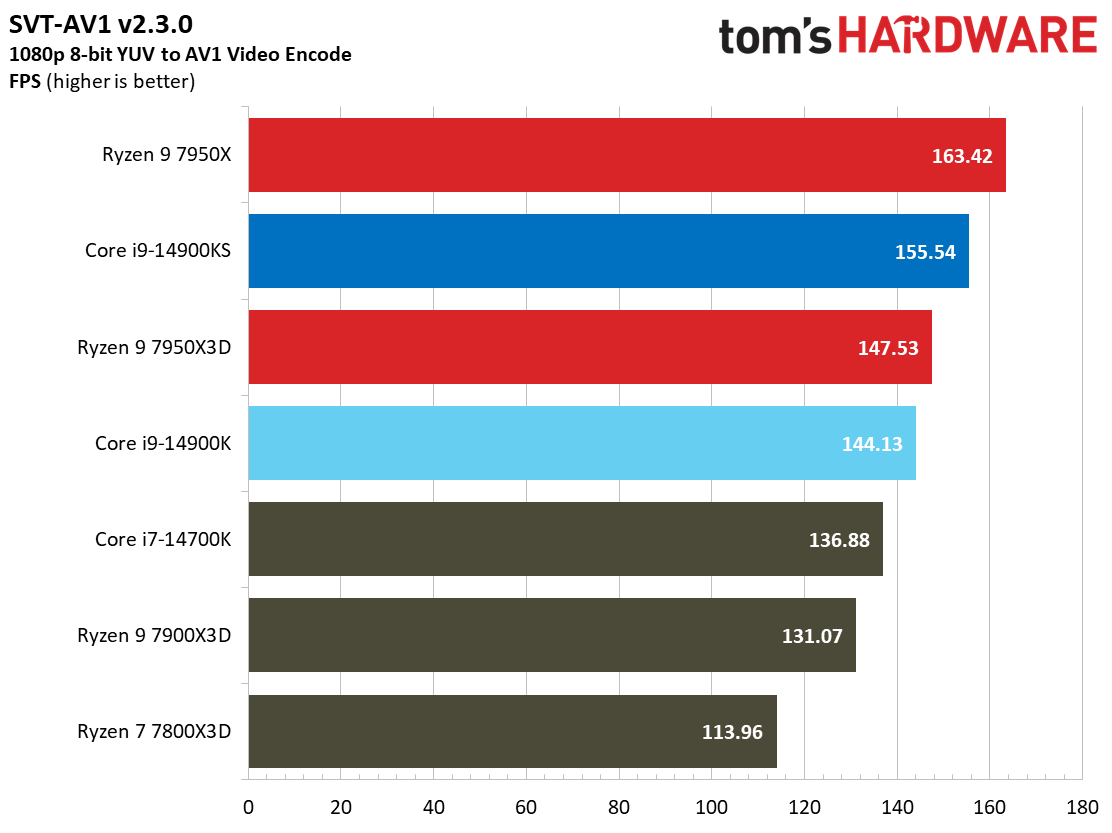
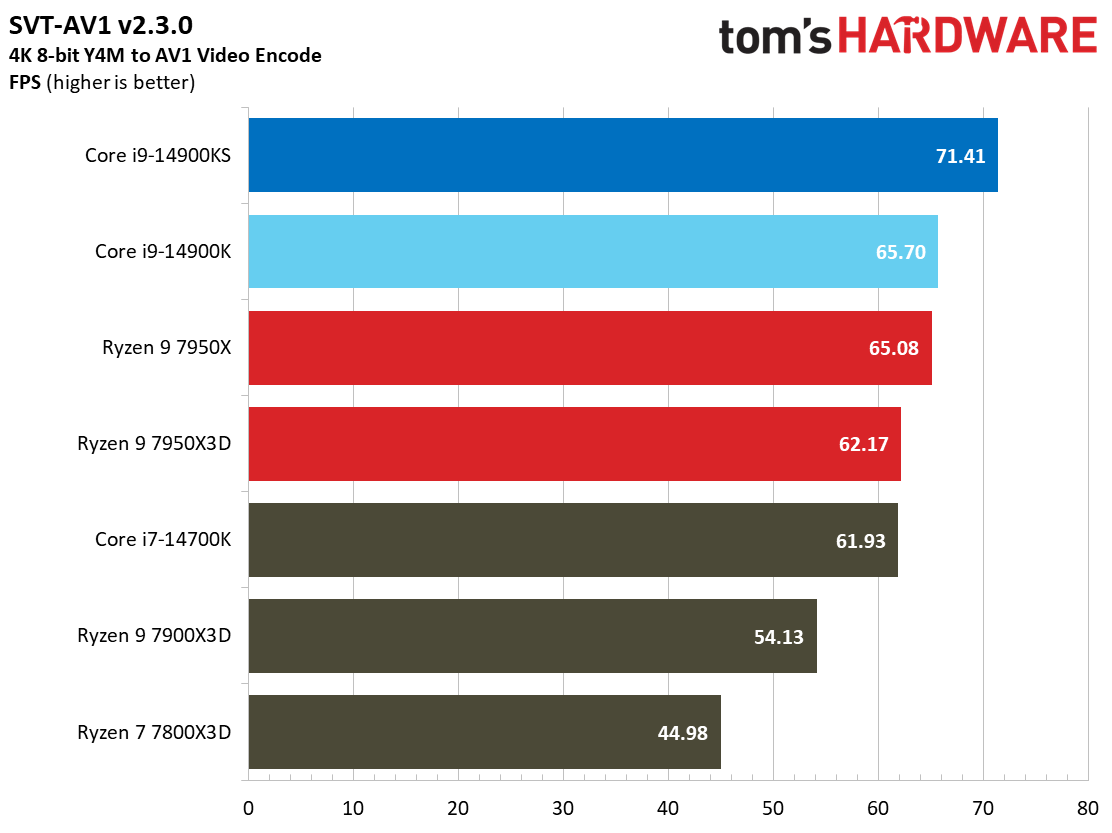
Most encoders tend to be either heavily threaded or almost exclusively single-threaded — it takes an agile chip to master both disciplines. Handbrake, SVT-HEVC, and SVT-AV1 serve as our threaded encoders, while LAME, FLAC, and WebP are indicative of how the chips handle lightly-threaded engines.
Depending on the particular task, the 14900K/S either do very well or perform similarly to AMD's top CPUs. The single-threaded tasks tend to favor Intel more than the multi-threaded encodes.
Compilation, Compression, AI Chess Engines, AVX on Intel Core i9-14900KS
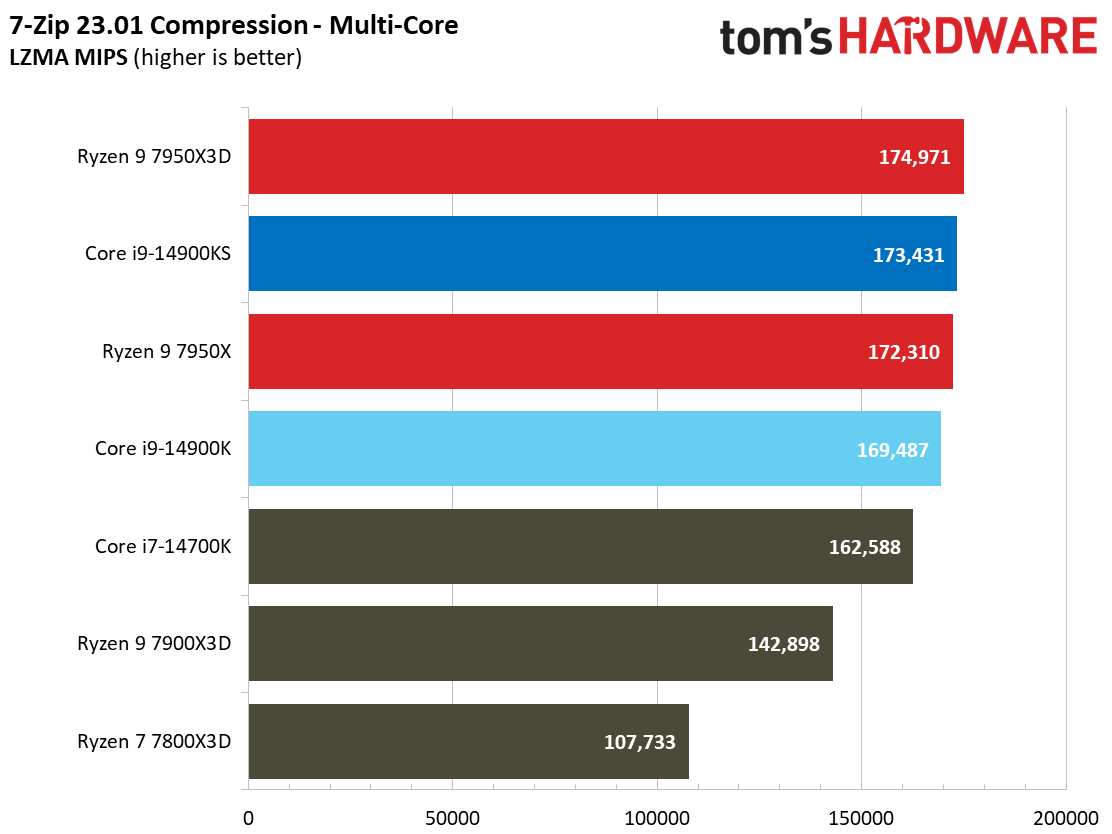
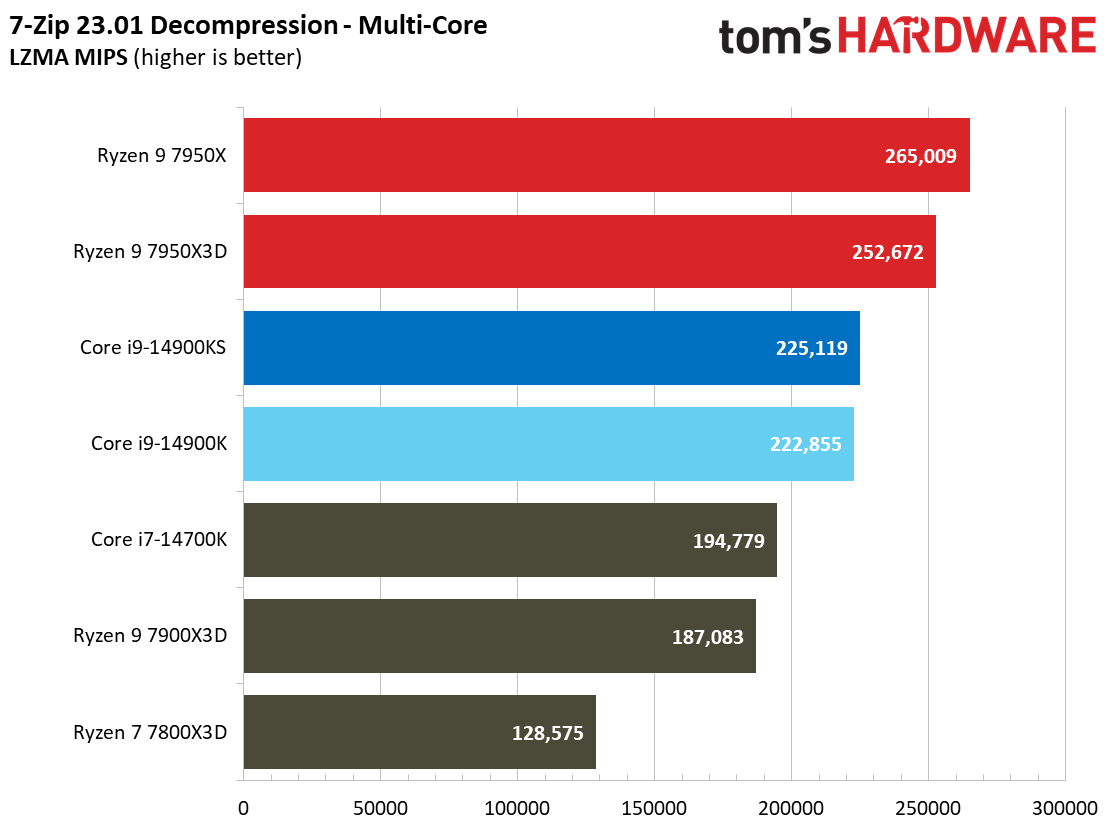
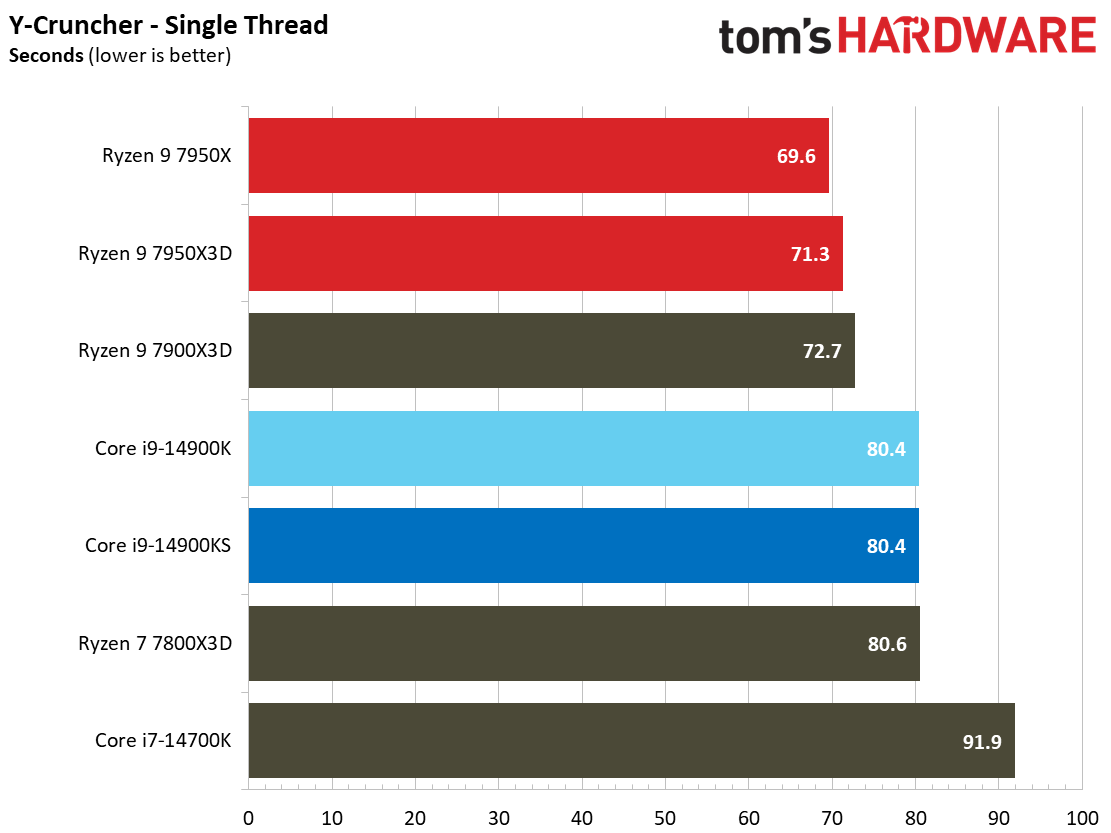
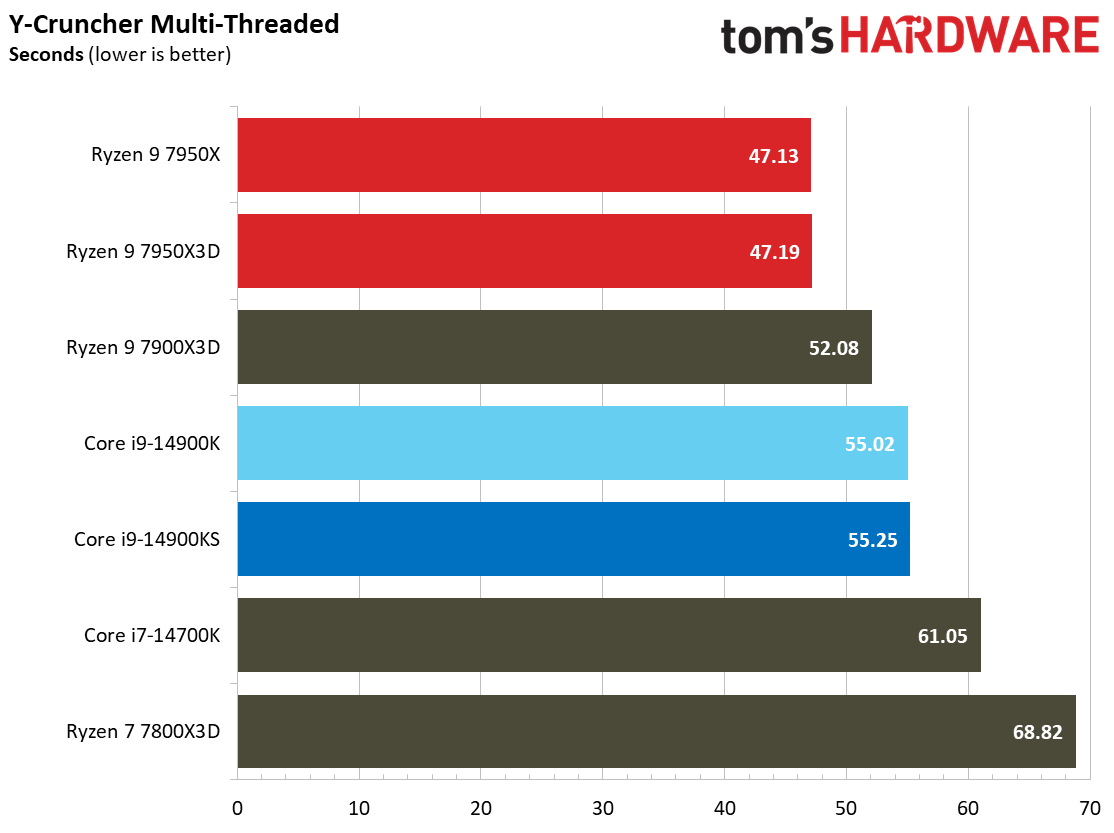
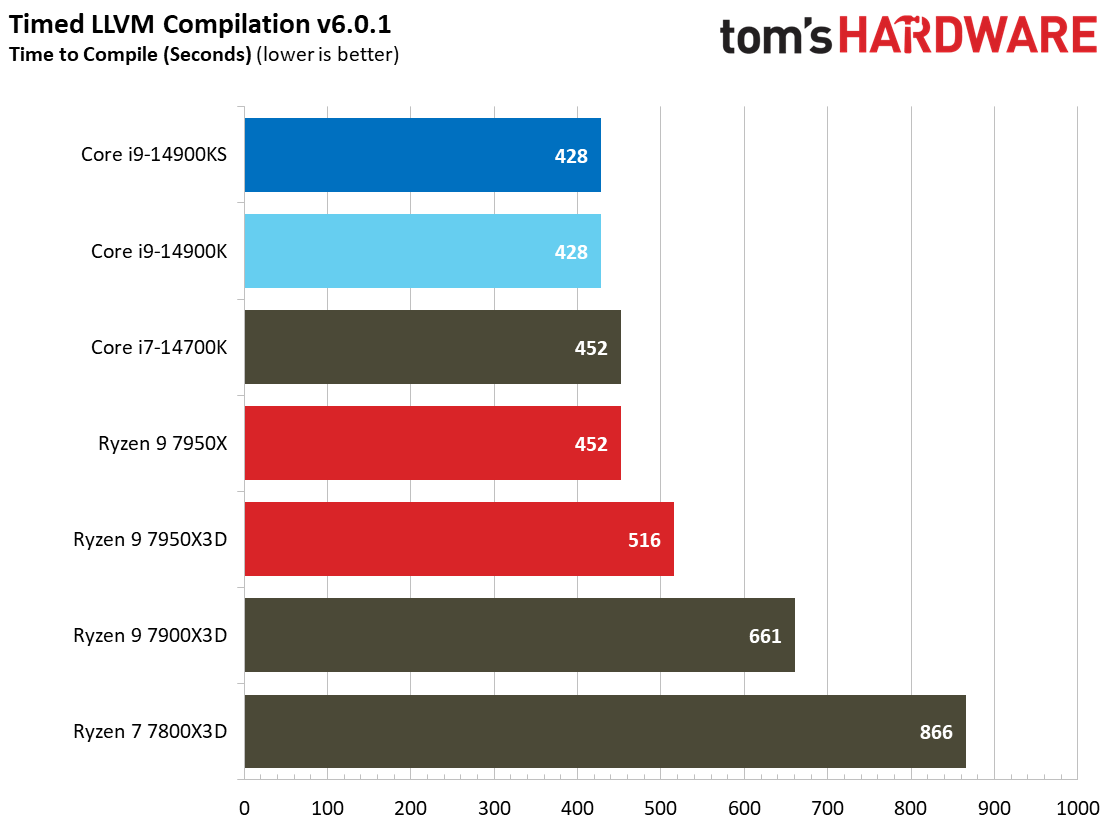
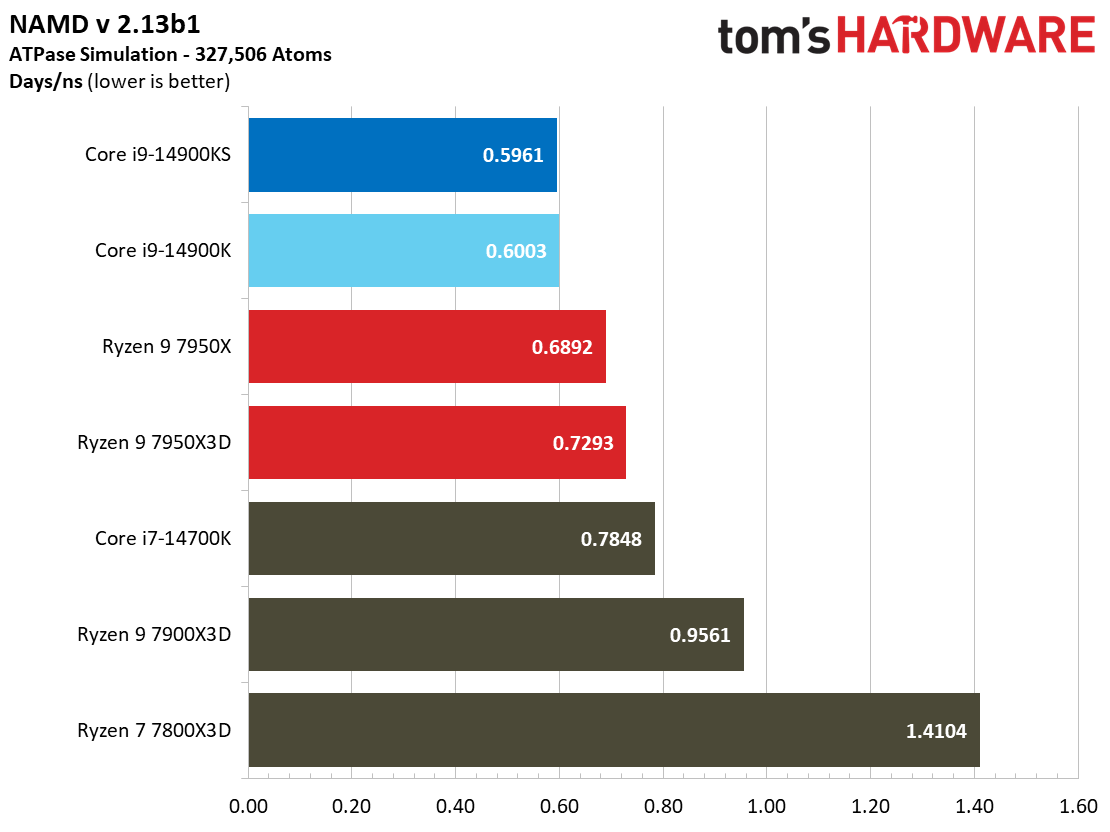
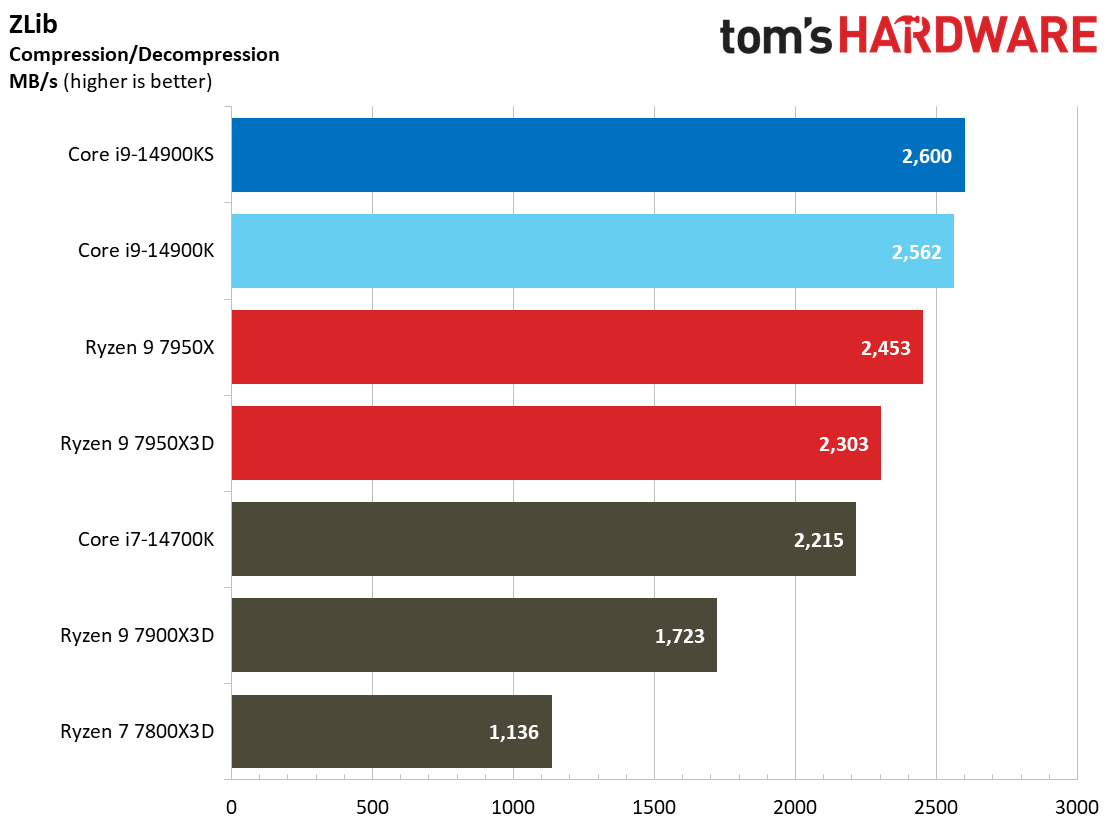
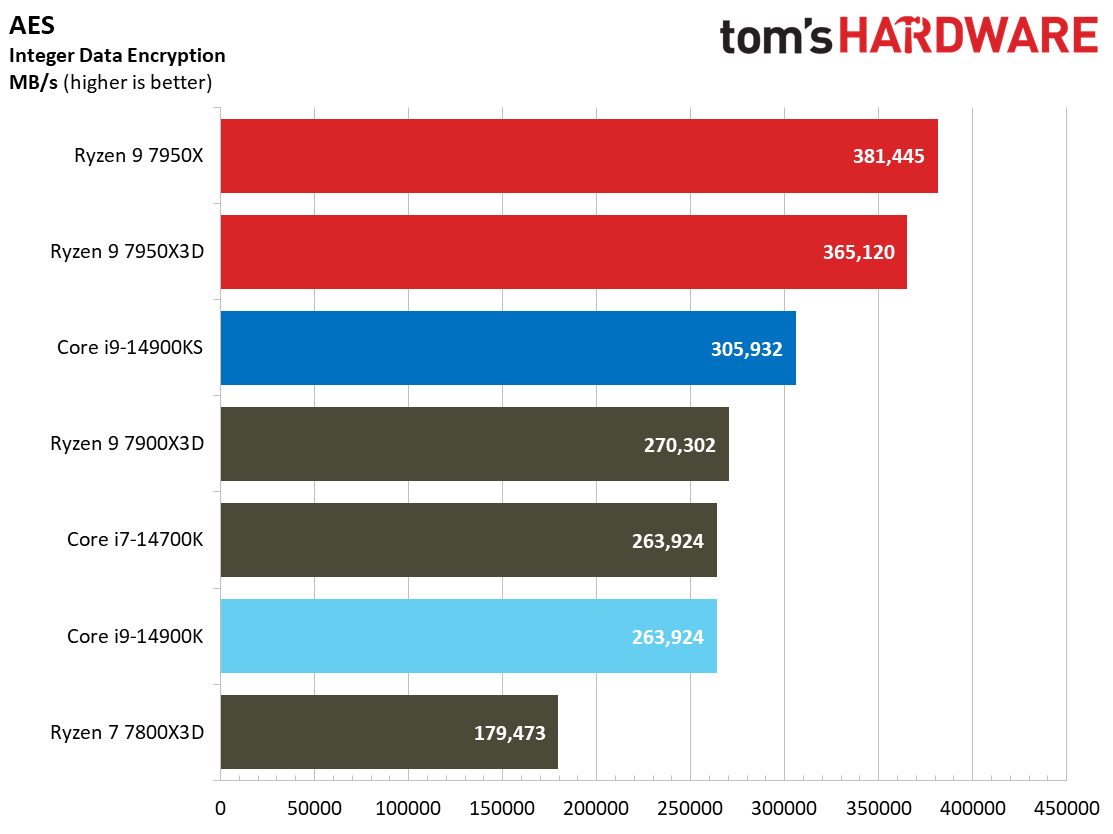
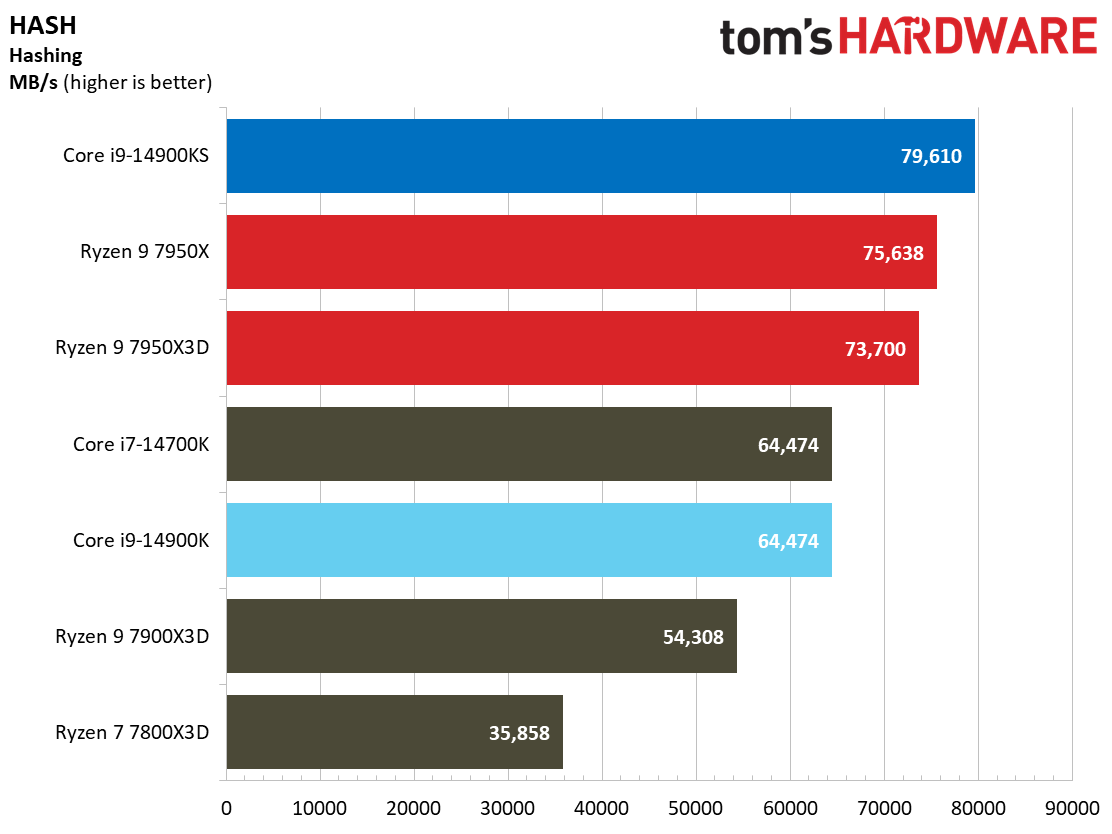
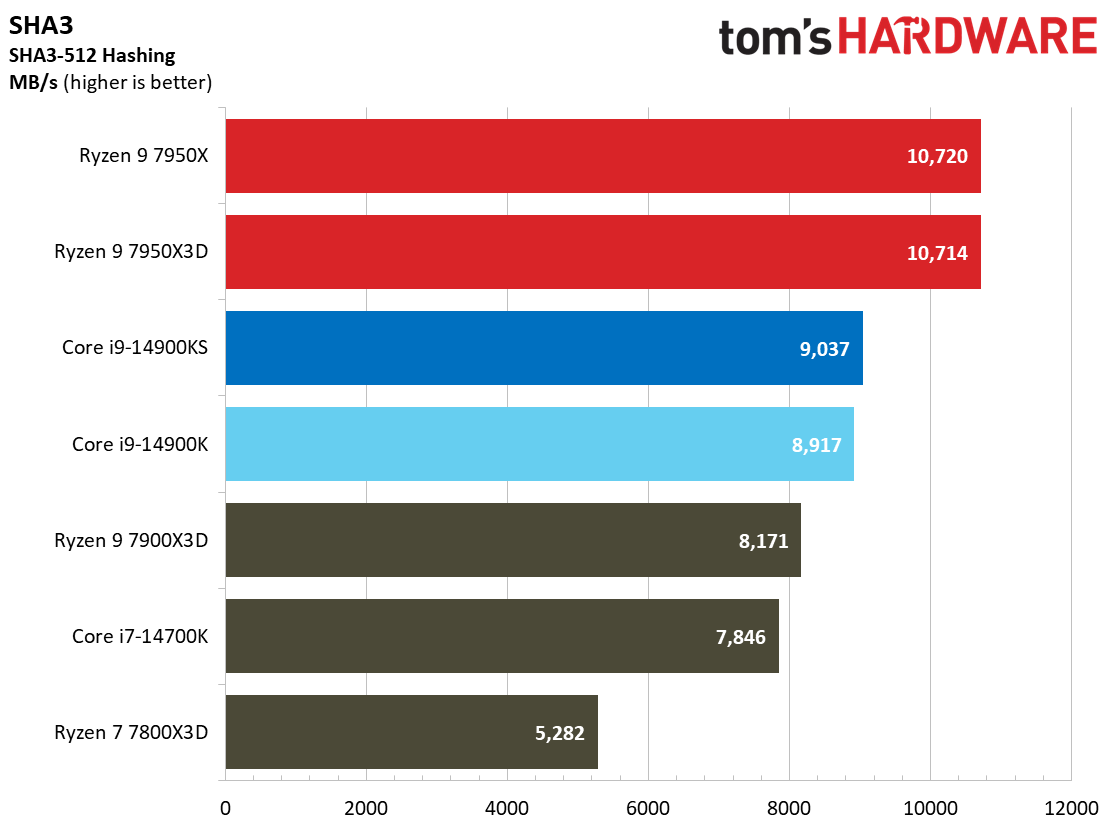
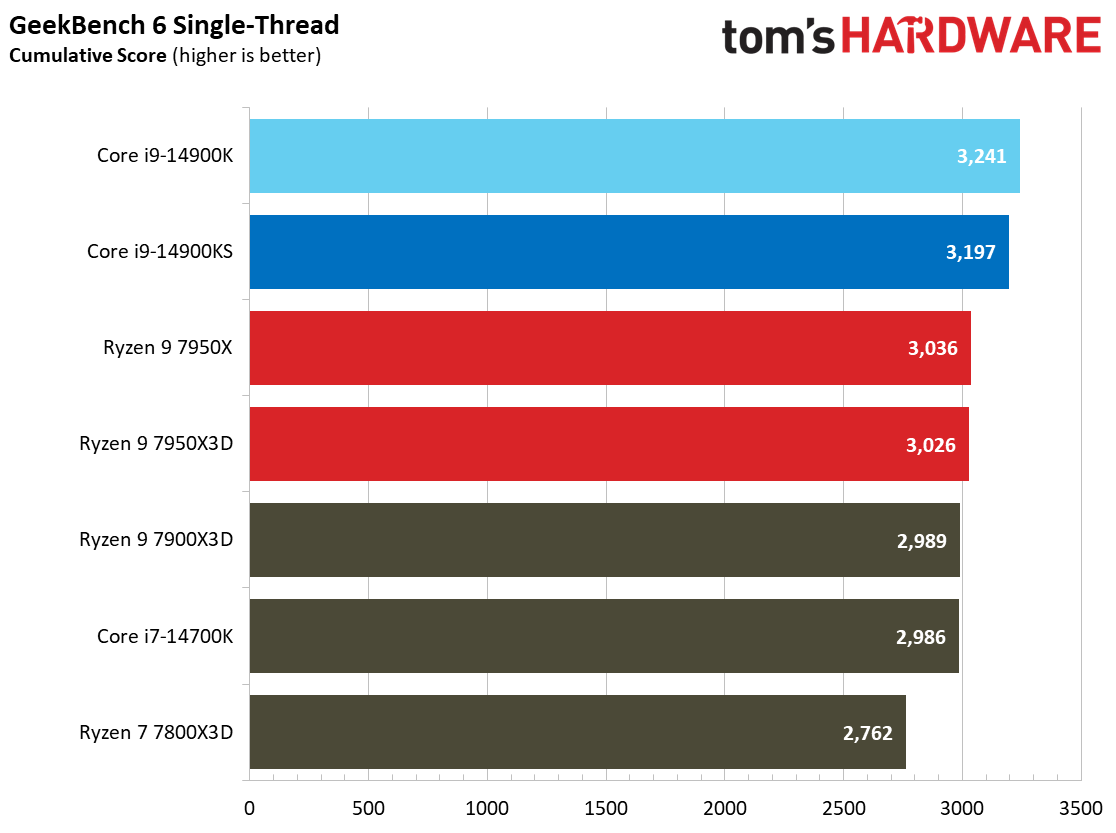
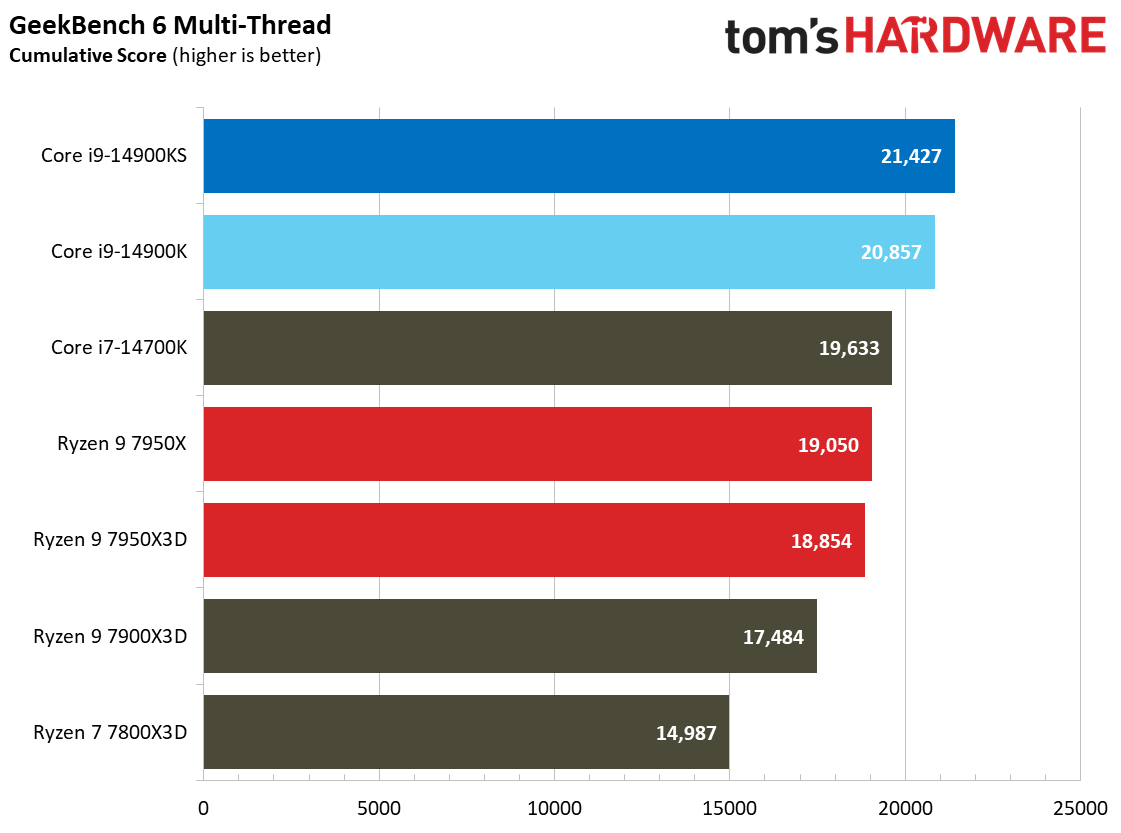
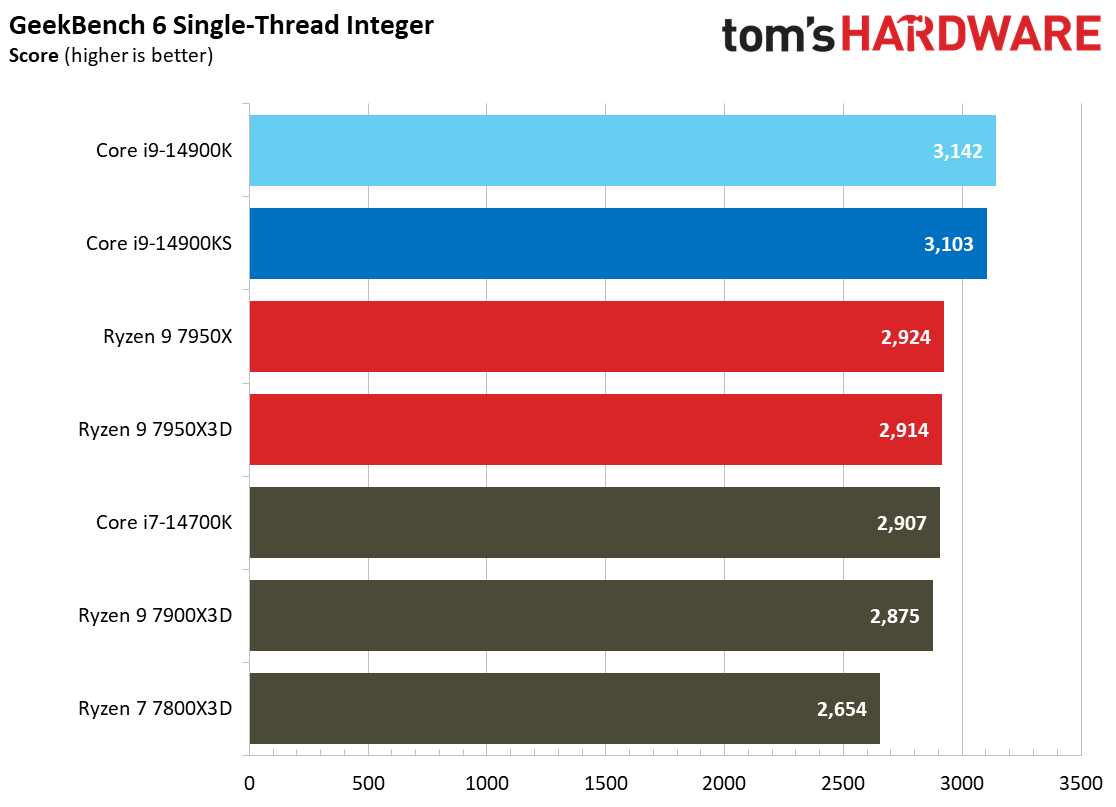
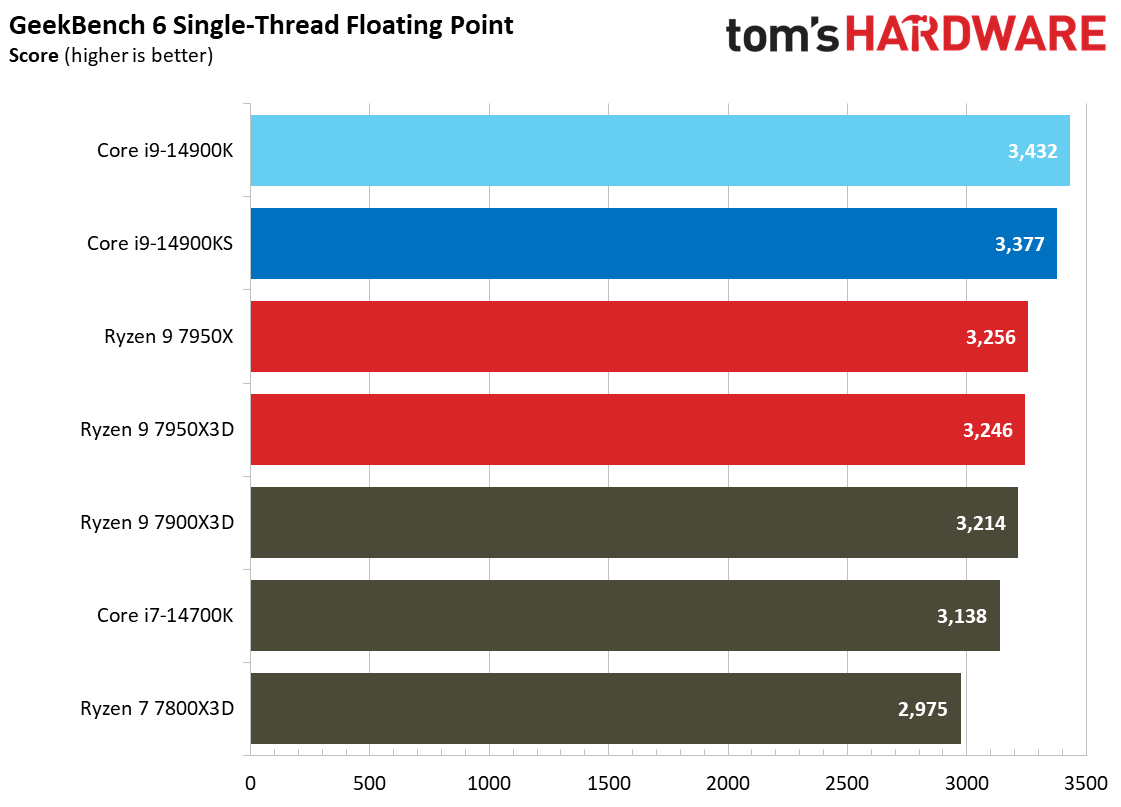
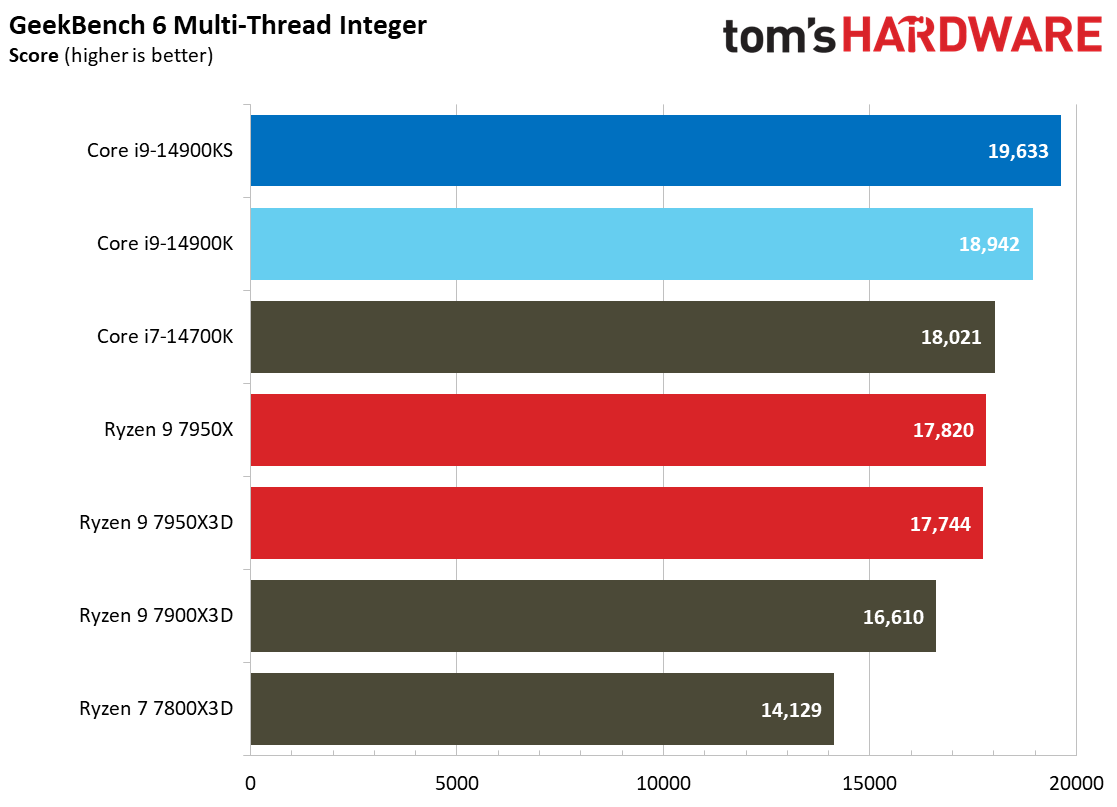
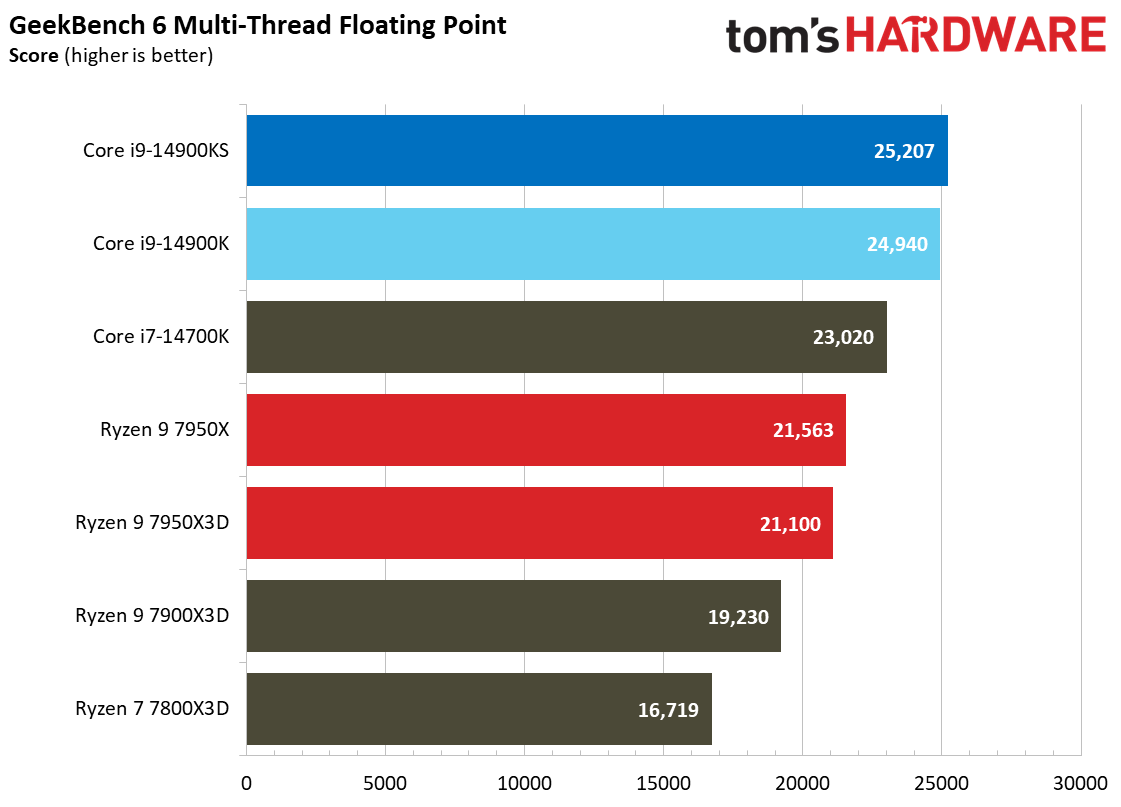
This selection of tests runs the gamut from massively parallel molecular dynamics simulation code in NAMD to compression/decompression performance. Y-cruncher computes Pi with the AVX instruction set, making for an exceedingly demanding benchmark. This benchmark was recently updated with specific tuning for AMD's AVX-512 implementation, and here we can see the new code delivering a big boost to Ryzen.
Thermals, Power Consumption on Intel Core i9-14900KS
| 14900K / KS Performance Power Delivery Profile | PL1 (PBP) | PL2 (MTP) | ICCMax |
| 14900K and KS Default Profile | 253W | 253W | 307A |
| 14900K Extreme Power Profile | 253W | 253W | 400A |
| 14900KS Extreme Power Profile | 320W | 320W | 400A |
Above, you can see the power limits for the Core i9-14900KS, including the Extreme Power Profile that Intel uses to define its official TDP specifications. This is largely a misnomer, as most enthusiast motherboards default to much higher 'limits' of up to 4096W and 512A. Regardless, as you'll see below, the performance of your cooler will limit how much power the chip can actually consume before it reaches its safe limits.
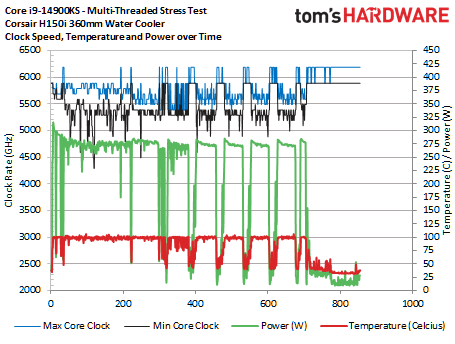
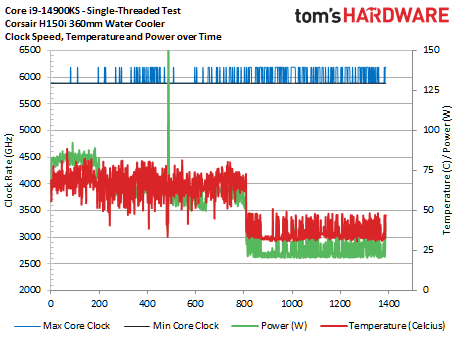
The Core i9-14900KS easily hits its rated 6.2 GHz boost clock in single-threaded workloads, but its P-core clock rates fluctuate during the multi-threaded tests, which include workloads like y-cruncher, Cinebench, Blender, and POV-Ray.
Despite using a 360mm Corsair iCue Link H150i watercooler, we peaked at 100C for extended periods of time during our tests. That's because the chip has Adaptive Boost Technology (ABT), which dynamically boosts to higher all-core frequencies based on available thermal headroom and electrical conditions.
By design, ABT allows the chip to operate at 100C during normal operation. If the chip runs under the 100C threshold, it will consume more power until it reaches the safe 100C limit, thus extracting the utmost performance within the available thermal headroom. ABT improvements will vary. The frequency uplift depends upon the quality of your chip, along with cooling and power delivery capabilities. The silicon lottery also comes into play.
We reached Intel's performance guidelines for performance in single- and multi-threaded workloads, but better cooling, which would require a custom loop in this case, might be able to eke out a bit more performance. However, the chip is at the top of the voltage/frequency curve, where increased power consumption is incredibly inefficient. As you near peak power, double-digit percentage increases in power consumption often only yield single-percentage performance gains, so slightly higher power will not make much difference in actual benchmarks.
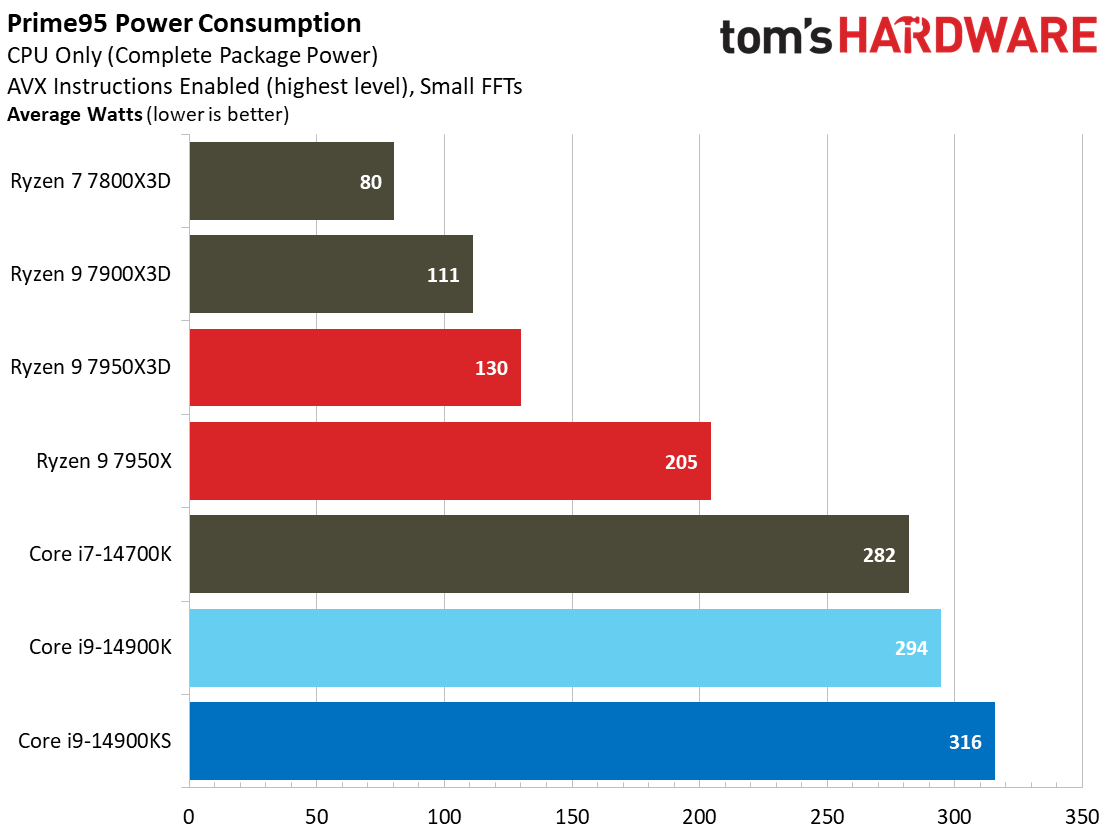
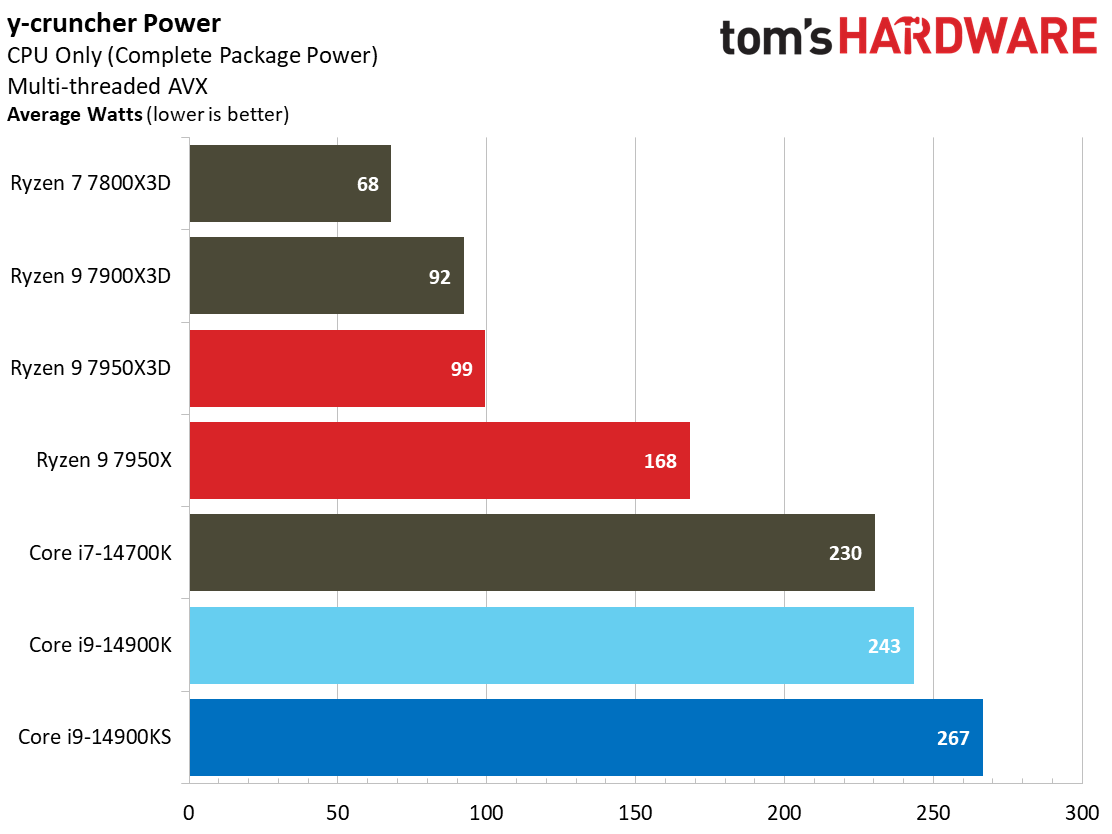
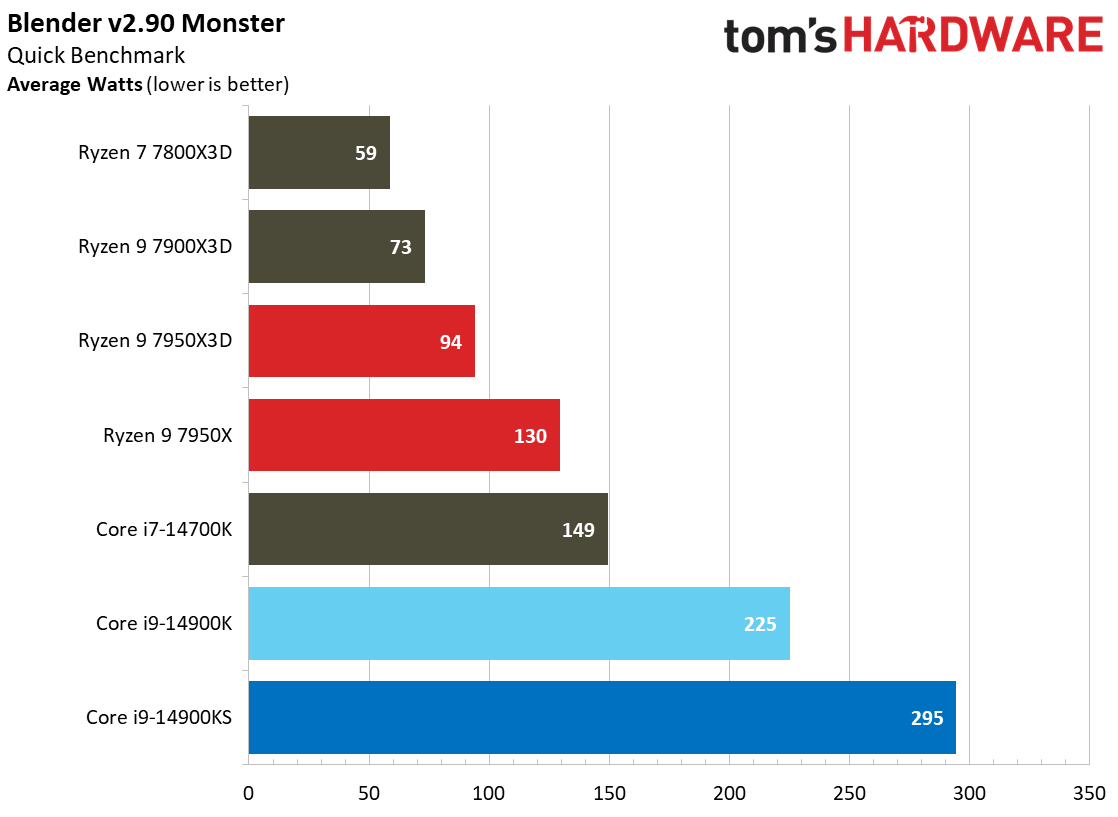
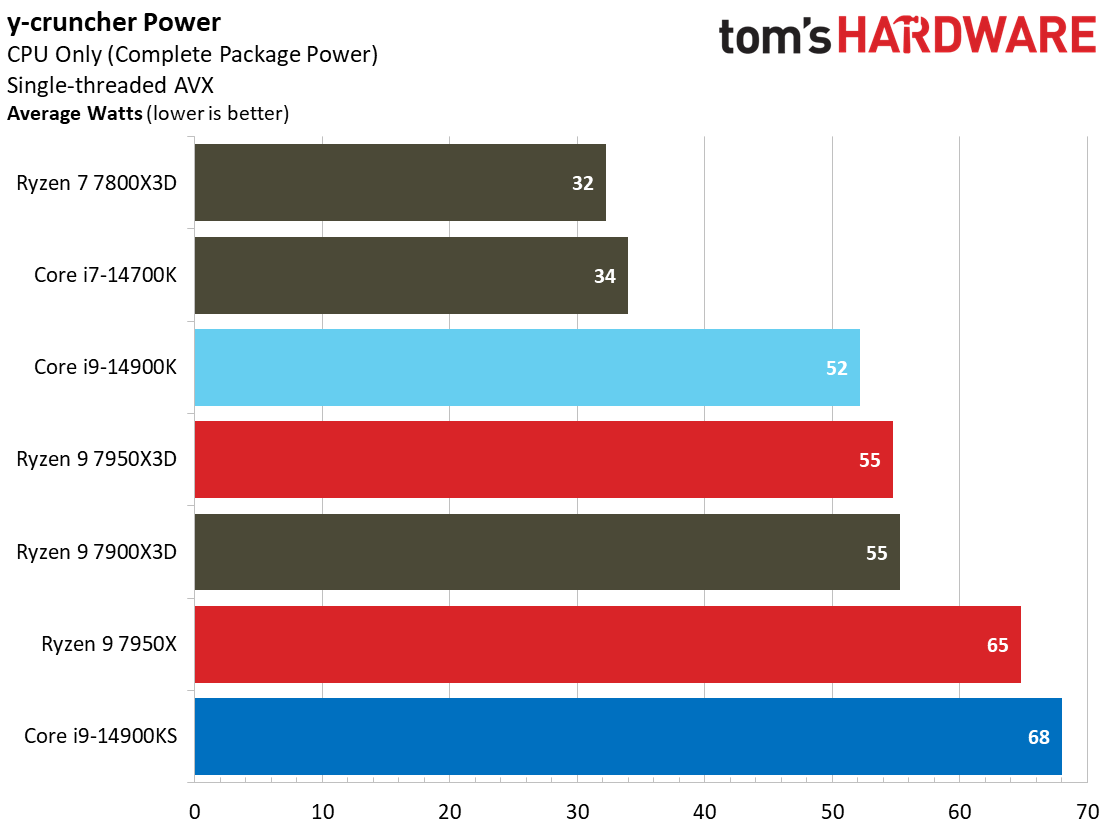
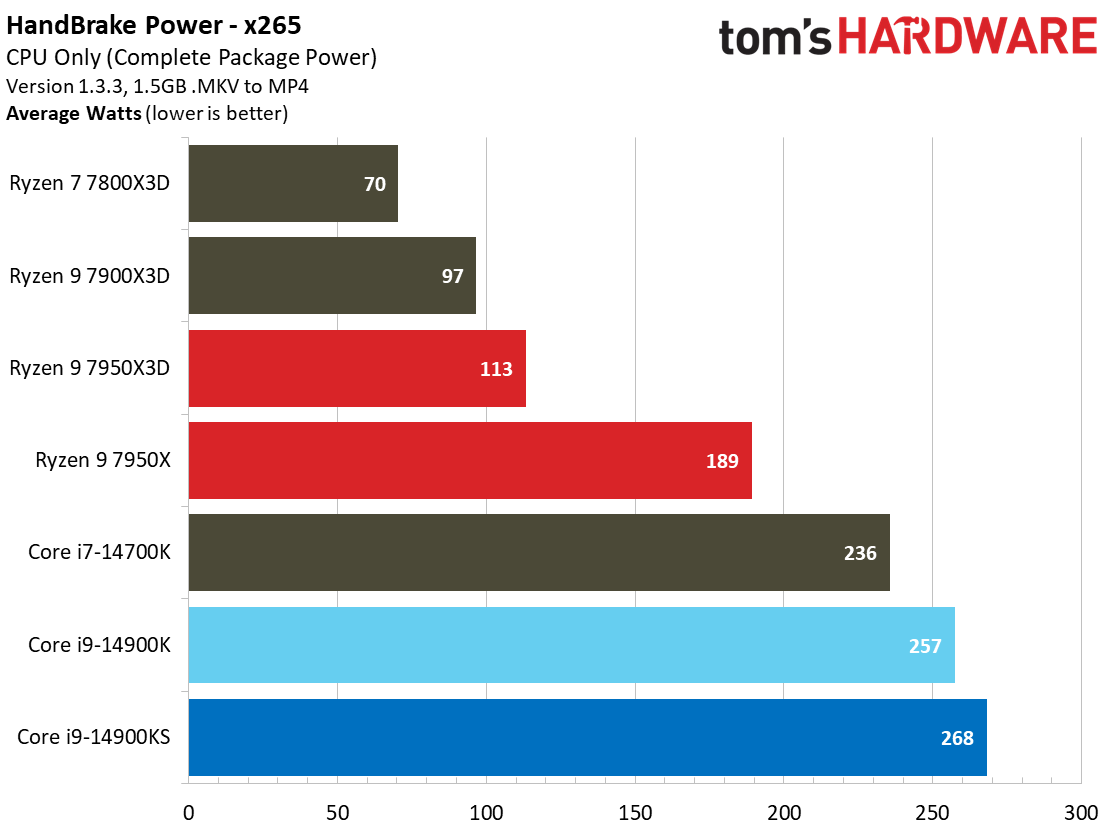
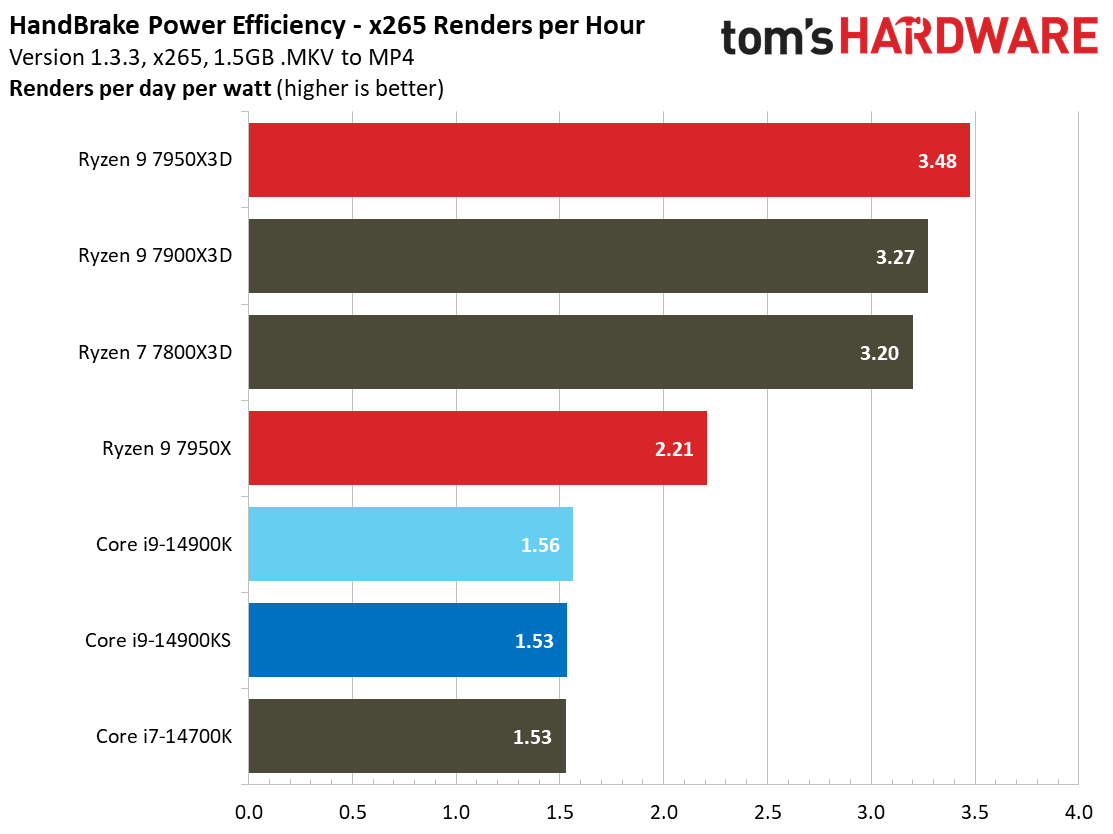
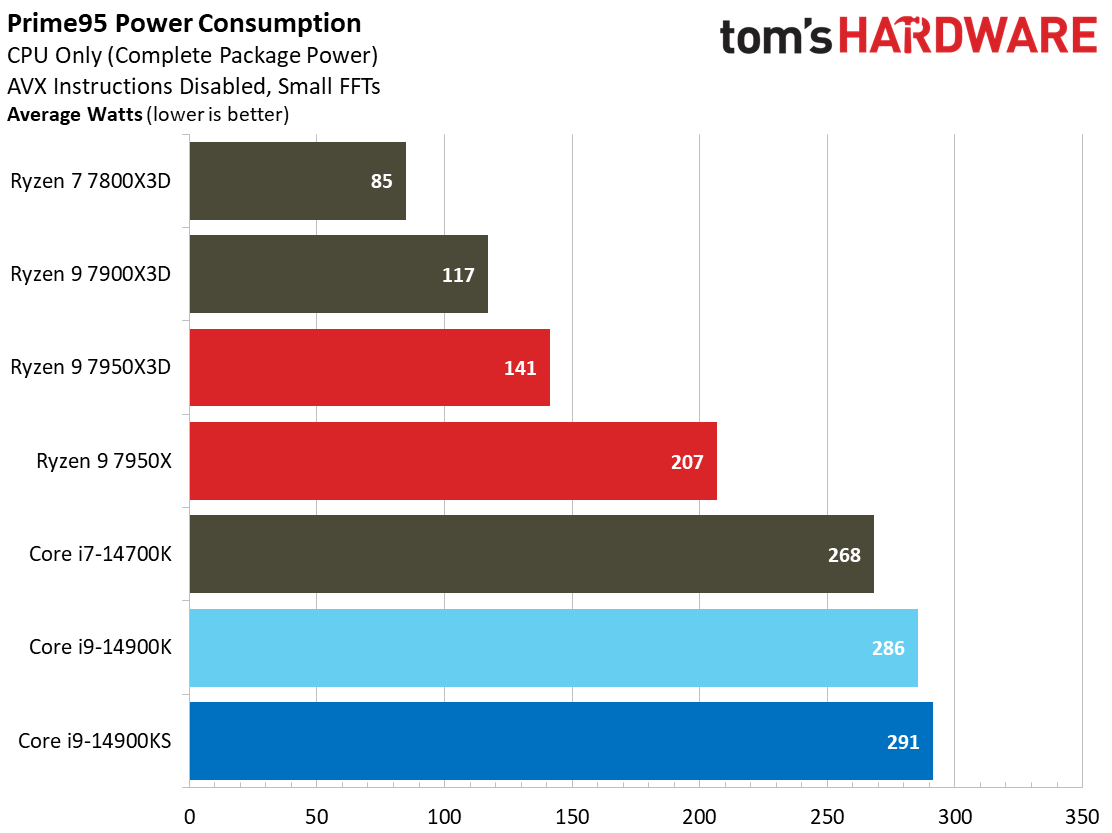
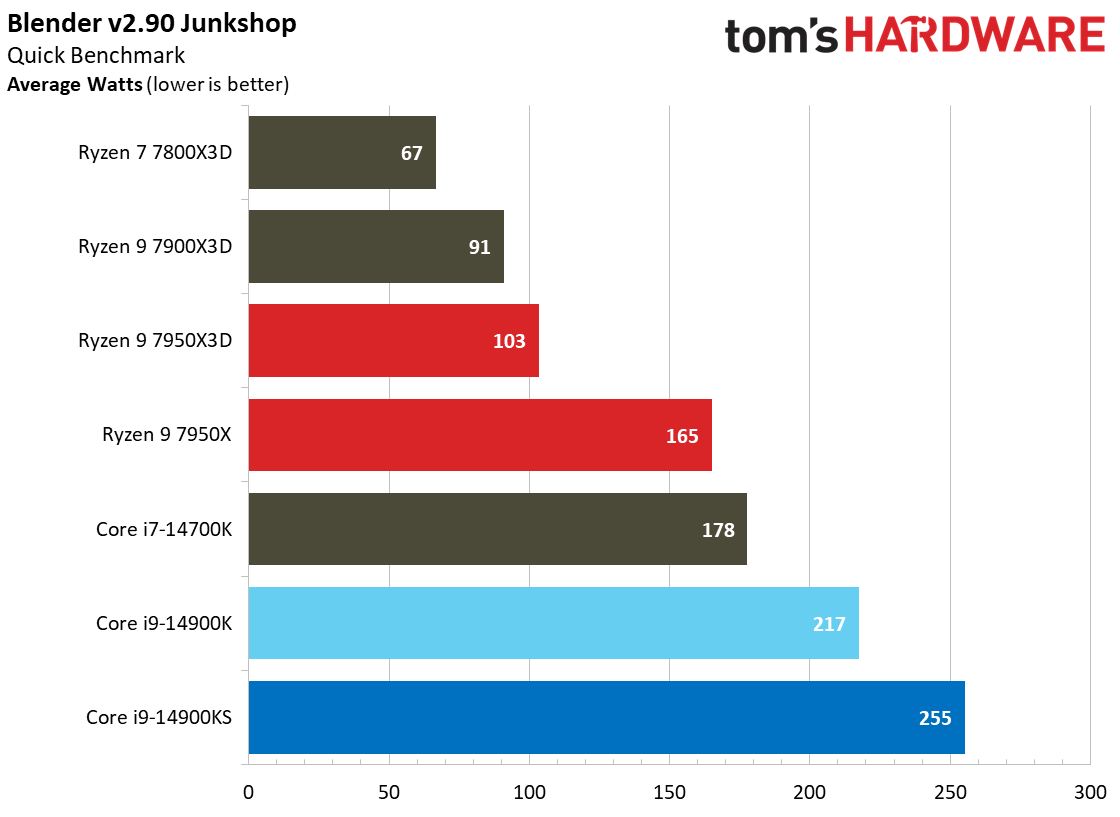
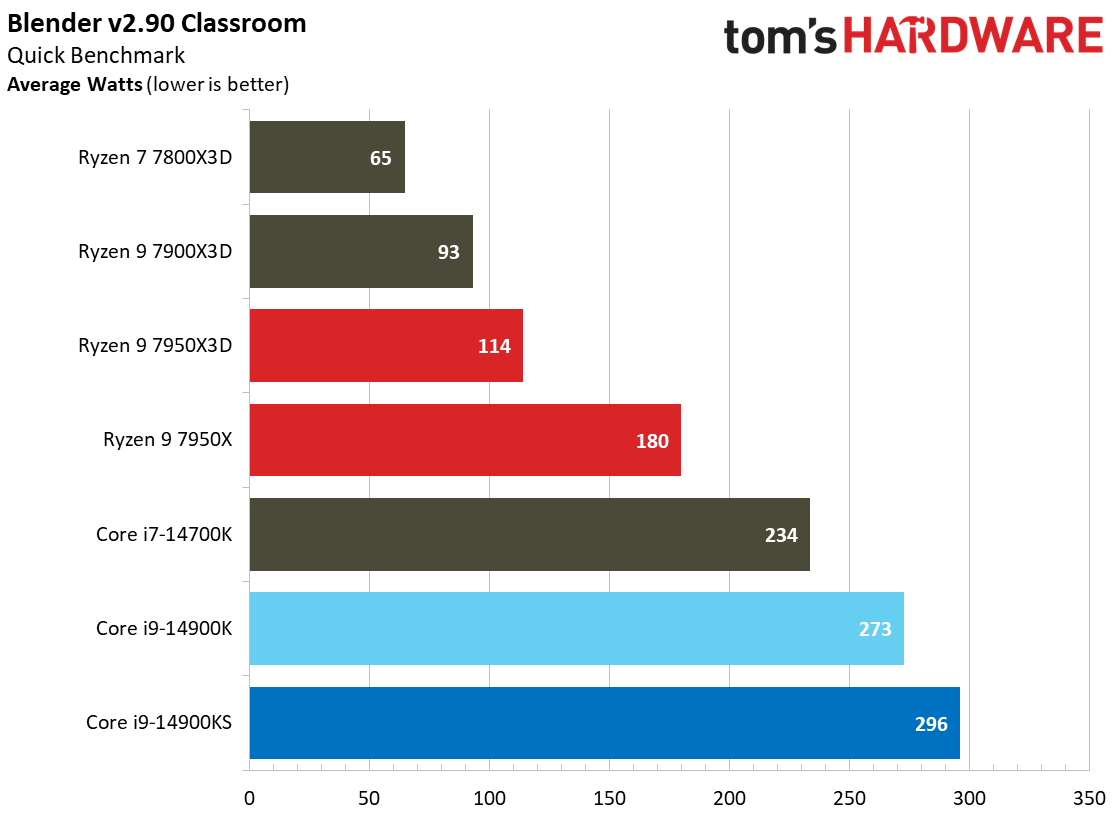
Prime95 isn't the best proxy for most real-world workloads; it's a power virus in many respects. Here, we see the 14900KS pull 326W with AVX enabled in Prime95, but it peaks at 295W in the real-world Blender render.
Flipping through the album yields no surprises — the Core i9-14900KS pulls more power than any of the competing chips. Given the prodigious amount of extra power required to achieve just a few more percentage points of performance, it isn't at all surprising that the Core i9-14900KS put up an exceptionally bad result in the renders-per-day/watt efficiency metric.
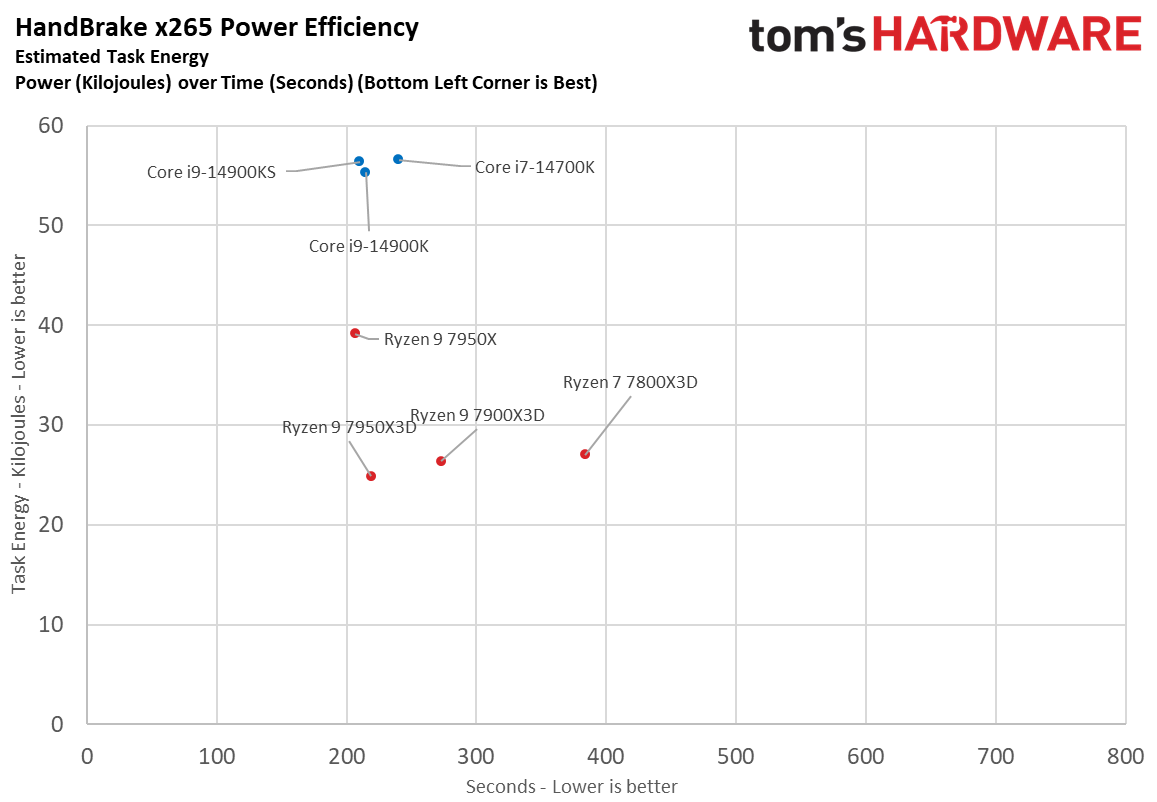
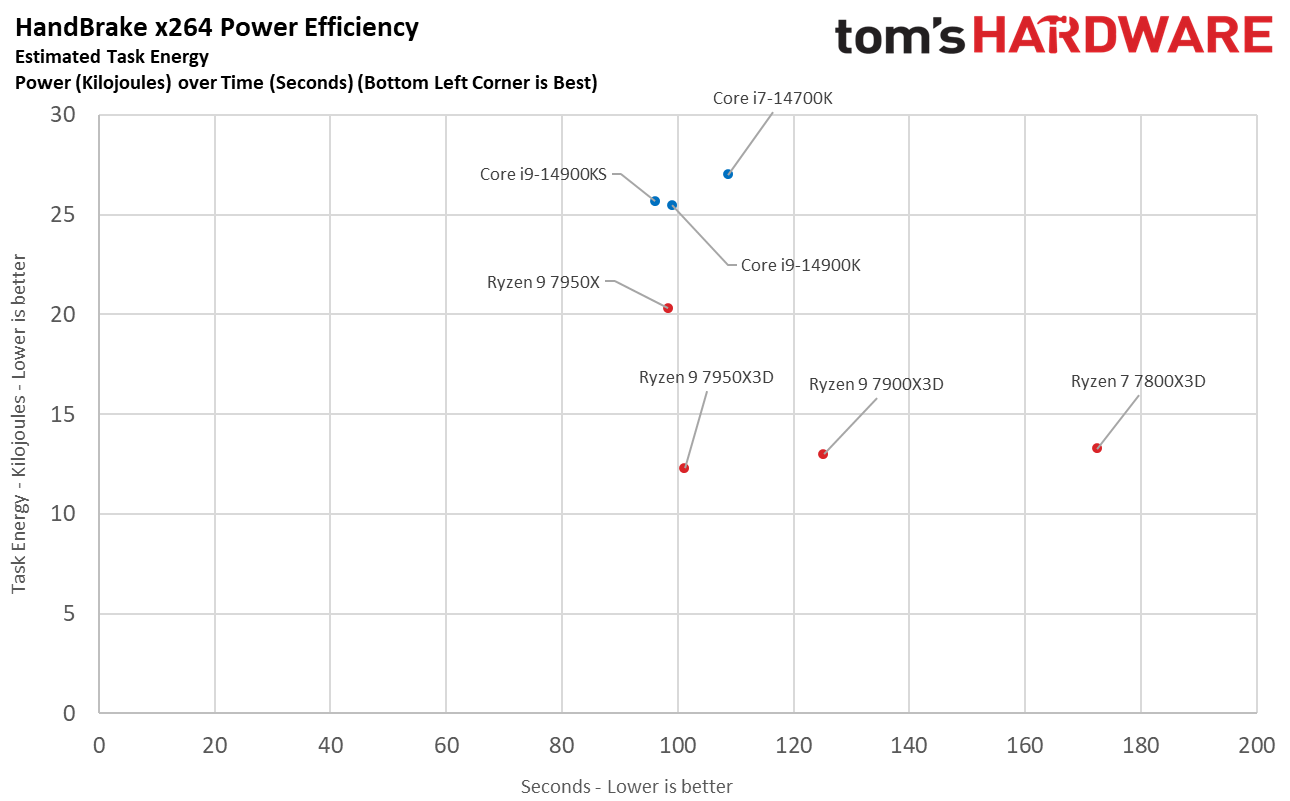
The final image takes a slightly different look at power consumption by calculating the cumulative energy required to execute an x265 HandBrake workload. We plot this 'task energy' value in Kilojoules on the left side of the chart.
These workloads are comprised of a fixed amount of work, so we can plot the task energy against the time required to finish the job (bottom axis), thus generating a really useful power chart. Bear in mind that faster compute times and lower task energy requirements are ideal. That means processors that fall the closest to the bottom left corner of the chart are the best.
As you can see, the Ryzen processors dominate the power efficiency metrics, while Intel's 14900K/S sit far higher up on the Y-axis.
The Special Edition Tax
As we saw with its predecessors, the Core i9-14900KS Special Edition doesn't materially impact Intel's 14th Gen competitive positioning against AMD's Ryzen 7000 family, largely due to the limited number of processors that will be made and the $689 price tag. The chip is purpose-built for deep-pocketed enthusiasts and extreme overclockers looking to build the highest-performance Intel system at any cost, and that involves paying a $140 premium for a few scant percentage points of extra performance.
Overall, that equates to a subpar price-to-performance ratio, especially once you factor in the pricey components you'll need to extract the best out of the Core i9-14900KS.
Below, we have the geometric mean of our gaming test suite at 1080p and 1440p and a cumulative measure of performance in single- and multi-threaded applications. We conducted our gaming tests with an Nvidia RTX 4090, so performance deltas will shrink with lesser cards and higher resolution and fidelity settings.


The $689 Core i9-14900KS is only 1.7% faster than the standard $550 Core i9-14900K in 1080p gaming and 2.5% faster at 1440p, making its 25% ($140) price tag hard to justify for gamers. We also only recorded a 1.5% gain in threaded applications and a 3.8% speed-up in single-threaded work, neither of which are worth the extra cash — and that's before we factor in the type of components you'll need to buy for this chip.
The Core i9-14900KS will need the highest-end motherboard and PSU to pump 400A and 320W+ of power to the processor, along with a potent liquid-cooler to handle the 100C operating temperatures when the chip is under heavy load. If you're buying this class of chip, you'll also want to buy a quality XMP memory kit to eke out a bit more performance. Overall, you'll pay a high price for a few percentage points (at best) of extra performance over the standard 14900K, not to mention that AMD's competing 7000X3D chips still hold the lead in gaming.
The big appeal for the KS is that you're theoretically guaranteed to get Intel's best silicon, so you're basically buying the winning ticket for the silicon lottery. That makes Special Edition chips popular with extreme overclockers, especially those chasing world records. Unfortunately, we didn't have time to test overclocking with our chip; we only had about a day and a half to complete our testing. However, the overclocking advantage can vary, and we've seen cases, albeit rare, where standard chips have binned better than KS models — there's still at least a slight lottery in play.
The Core i9-14900K's blistering 6.2 GHz dual-core boost sets a milestone as the fastest yet for a desktop PC, a fitting exit for the Core i9 series. However, that extra clock speed doesn't equate to enough real-world performance to justify the price tag. The previous-gen KS models took the lead in gaming over competing AMD processors, but the Core i9-14900KS can't lay claim to the gaming crown, making its steep price tag much harder to swallow.
| Intel Socket 1700 DDR5 (Z790) | Intel Core i9-14900KS, Core i9-14900K, i7-14700K |
| Motherboard | MSI Z790 Carbon Wifi |
| RAM | G.Skill Trident Z5 RGB DDR5-6800 - Stock: DDR5-5600 |
| AMD Socket AM5 (X670E) | Ryzen 9 7950X3D, 7900X3D, 7900X3D, 7950X, 7900X, Ryzen 7 7700X Ryzen 5 7600X |
| Motherboard | ASRock X670E Taichi |
| RAM | G.Skill Trident Z5 Neo DDR5-6000 - Stock: DDR5-5200 |
| All Systems | 2TB Sabrent Rocket 4 Plus, Silverstone ST1100-TI, Open Benchtable, Arctic MX-4 TIM, Windows 11 Pro |
| Gaming GPU | Asus RTX 4090 ROG Strix OC |
| Application GPU | Nvidia GeForce RTX 2080 Ti FE |
| Cooling | Corsair iCue Link H150i RGB |
| Note: | Microsoft advises gamers to disable several security features to boost gaming performance. As such, we disabled secure boot, virtualization support, and fTPM/PTT. |

Paul Alcorn is the Editor-in-Chief for Tom's Hardware US. He also writes news and reviews on CPUs, storage, and enterprise hardware.
-
cknobman Intel just flat out sux now.Reply
Also it seems like the limits of the x6 architecture's performance are getting close to the limit.
Besides the hundreds of watts it consumes to run this fast the heat output is getting out of control. -
ingtar33 so basically 400+W of power draw and still second place... technically further back then that depending on how many x3D amd chips you want to benchmark.Reply
seems like there is another bottleneck in the system then clock speed, they barely got any extra performance out of it.
whats hilarious is the AMD chips killing it are doing it while sipping power at like 80W and lower. this is just like the old piledriver days. remember the 9000 series piledrivers? 200W and 5ghz out of the box. still a distant second place to sandy/ivybridge sipping power at like 80W? same basic show going on this time only the tables have been flipped.
this is intel's 9000 series piledriver. -
JasonovichClone Reply
Tough for Intel at the moment. Its thrown the kitchen sink plus the farmers cow to wrest back the gaming crown from 7800X3D but failed miserably.ingtar33 said:so basically 400+W of power draw and still second place... technically further back then that depending on how many x3D amd chips you want to benchmark.
seems like there is another bottleneck in the system then clock speed, they barely got any extra performance out of it.
whats hilarious is the AMD chips killing it are doing it while sipping power at like 80W and lower. this is just like the old piledriver days. remember the 9000 series piledrivers? 200W and 5ghz out of the box. still a distant second place to sandy/ivybridge sipping power at like 80W? same basic show going on this time only the tables have been flipped.
this is intel's 9000 series piledriver.
There is Lunar Lake on the horizon and Intel are buoyant that it will do well against AMD's latest offering. Though I have heard from the rumour mill, Zen 5 is going to be a monster. Best to wait until the official benchmarks are released. -
bit_user Reply
I believe Lunar Lake is set to replace Meteor Lake, for laptops.JasonovichClone said:There is Lunar Lake on the horizon
On the desktop we have Arrow Lake to look forward to. Both should launch later this year, but I think Lunar Lake won't ship in volume until Q1 2025.
Regarding Intel's struggles with the Gen 14 CPUs, let's not forget that the original plan was to have Meteor Lake (made on the Intel 4 (EUV) node) to replace Raptor Lake-S. That didn't happen, so the Raptor Refresh is Intel's plan B. -
bourgeoisdude Sounds like you did about everything you could to make this sound appealing to enthusiasts, when it really is just the fourth release of the same part: the i9 13900K. Literally exactly the same silicon except 400MHz higher boost clock and 200MHz higher base clock. But hey: let's compare using ridiculous speed RAM to AMD processors that don't have OC RAM so we can make it look like it trades blows. Why not add in the Intel Xeon Platinum 8558U for comparison? I'm sure it blows AMD's 7800X3D out of the water at multithreading.Reply -
JasonovichClone Reply
Yes you are correct, laptop replacement not desktop.bit_user said:I believe Lunar Lake is set to replace Meteor Lake, for laptops.
On the desktop we have Arrow Lake to look forward to. Both should launch later this year, but I think Lunar Lake won't ship in volume until Q1 2025.
Regarding Intel's struggles with the Gen 14 CPUs, let's not forget that the original plan was to have Meteor Lake (made on the Intel 4 (EUV) node) to replace Raptor Lake-S. That didn't happen, so the Raptor Refresh is Intel's plan B.
Really stretching it though, Intel calling Raptor Lake 14 Gen?
It's very much an Intel modus operandi, to incentivize people to upgrade, Intel had to create pretext to make it their worthwhile, 13+ Gen doesn't quite cut it. :) -
TheHerald Curious how much better it is compraed to the 13900k. Both locked to 5.5 ghz, the ks will probably drop power draw by around 100 watts.Reply -
UnforcedERROR Reply
That's a distinction between Intel and AMD at the moment. It would be oddly unfair to test a component below its theoretical performance barrier, wouldn't you agree?bourgeoisdude said:But hey: let's compare using ridiculous speed RAM to AMD processors that don't have OC RAM so we can make it look like it trades blows.
If anything it does Intel a disservice, as they aren't outperforming AMD on anything except absurd power consumption.
