How to Benchmark a Raspberry Pi Using Vcgencmd
Get all the data from your favorite single board computer

Get Tom's Hardware's best news and in-depth reviews, straight to your inbox.
You are now subscribed
Your newsletter sign-up was successful
The vcgencmd has been buried deep in Raspberry Pi OS for many years, but it took the Raspberry Pi 5 for us to truly learn to love it. At its most basic level, the command is used to output information from the VideoCore GPU, which forms part of the SoC. But with a few extra options / arguments we can get live CPU temperature data, voltages, clock speeds for many different components and much more.
In this how to we will introduce the basic usage of the command and then write a custom Bash script which will benchmark any Raspberry Pi system.
Basic Usage of Vcgencmd
The command has multiple options to measure clock speeds, temperatures, voltages etc. Let's go through them and see how each command is used, and an example of its output.
Measure Clock Speeds
Every computer has more than one clock speed. The CPU may be running in the Gigahertz, but some parts of your computer will be running at much lower speeds. The vcgencmd command has options to monitor
| Description | Command | Example Output |
|---|---|---|
| Get Arm CPU core speed | vcgencmd measure_clock arm | frequency(0)=1500004352 |
| Get GPU core speed | vcgencmd measure_clock core | frequency(0)=500001504 |
| Get H.264 block speed | vcgencmd measure_clock h264 | frequency(0)=0 |
| Get image sensor pipeline speed | vcgencmd measure_clock isp | frequency(0)=500000672 |
| Get 3D block speed | vcgencmd measure_clock v3d | frequency(0)=500001504 |
| Get UART speed | vcgencmd measure_clock uart | frequency(0)=43999120 |
| Get PWM block (analog audio output) | vcgencmd measure_clock pwm | frequency(0)=0 (Raspberry Pi 5 has analog video out, but no audio) |
| Get SD card interface clock speed | vcgencmd measure_clock emmc | frequency(0)=200000432 |
| Get pixel values | vcgencmd measure_clock pixel | frequency(0)=107999800 |
| Get analogue video encoder speed | vcgencmd measure_clock vec | frequency(0)=0 |
| Get HDMI clock | vcgencmd measure_clock hdmi | frequency(0)=648002816 |
| Get display parallel interface clock speed | vcgencmd measure_clock dpi | frequency(0)=0 |
Measure Voltages
Using vcgencmd, we can measure the voltages of the VideoCore chip, RAM and the voltages, currents in use on the many power sources, including the Power Management IC (PMIC).
| Description | Command | Example Output |
|---|---|---|
| Get VideoCore voltage | vcgencmd measure_volts core | volt=0.7200V |
| Get RAM core voltage | vcgencmd measure_volts sdram_c | volt=0.6000V |
| Get RAM I/O voltage | vcgencmd measure_volts sdram_i | volt=0.6000V |
| Get RAM Phy voltage | vcgencmd measure_volts sdram_p | volt=1.1000V |
| Read PMIC voltages | vcgencmd pmic_read_adc | 3V7_WL_SW_A current(0)=0.00390372A 3V3_SYS_A current(1)=0.05562801A 1V8_SYS_A current(2)=0.16493220A DDR_VDD2_A current(3)=0.02049453A DDR_VDDQ_A current(4)=0.00000000A 1V1_SYS_A current(5)=0.18152300A 0V8_SYS_A current(6)=0.32693650A VDD_CORE_A current(7)=0.71440000A 3V3_DAC_A current(17)=0.48840000A 3V3_ADC_A current(18)=0.42735000A 1V1_SYS_A current(16)=5.55555000A HDMI_A current(22)=0.02344320A 3V7_WL_SW_V volt(8)=3.71462400V 3V3_SYS_V volt(9)=3.31096100V 1V8_SYS_V volt(10)=1.79926600V DDR_VDD2_V volt(11)=1.11355200V DDR_VDDQ_V volt(12)=0.60842430V 1V1_SYS_V volt(13)=1.10622600V 0V8_SYS_V volt(14)=0.80476110V VDD_CORE_V volt(15)=0.72097620V 3V3_DAC_V volt(20)=3.30768900V 3V3_ADC_V volt(21)=3.30494200V 1V1_SYS_V volt(19)=0.79765500V HDMI_V volt(23)=5.10004000V EXT5V_V volt(24)=5.09602000V BATT_V volt(25)=0.00683760V |
| Selective output of PMIC values. Find the value that you want from the list, add it as an argument. | vcgencmd pmic_read_adc EXT5V_V | EXT5V_V volt(24)=5.12416000V |
System Throttle Status
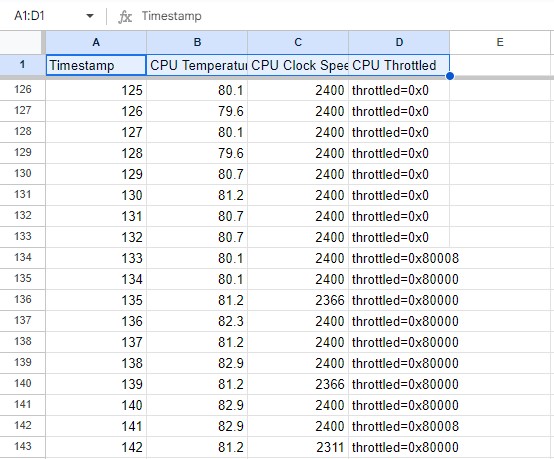
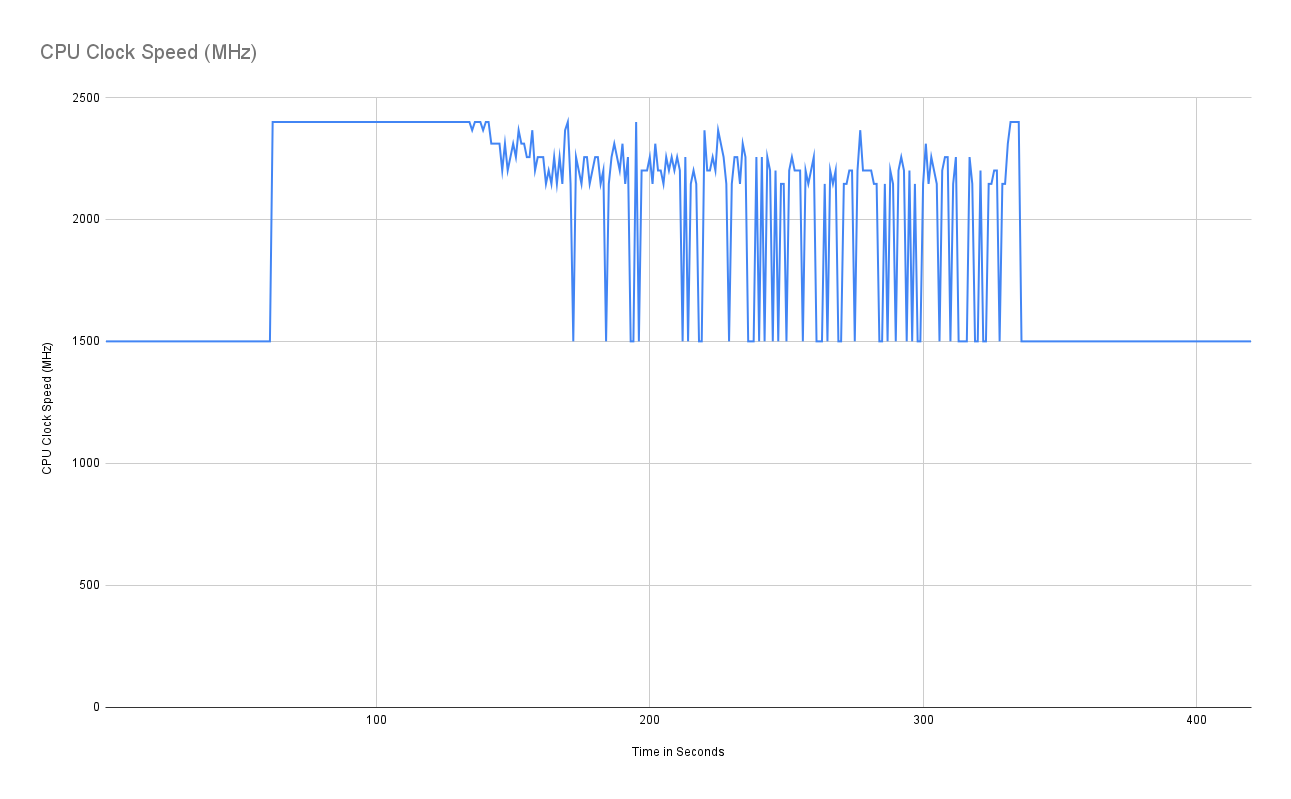
When the Raspberry Pi hits around 80 degrees Celsius, it will enter thermal throttle. This reduces the speed of the CPU in an attempt to keep it cool. When running benchmarks we need to know if a CPU is throttled, and vcgencmd has the command to tell us that.
| Description | Command | Example Output |
|---|---|---|
| Returns the system’s throttle state as a bit-pattern. | vcgencmd get_throttled | throttled=0x0 |
| Row 1 - Cell 0 | Row 1 - Cell 1 | Row 1 - Cell 2 |
System Throttle Status Bit Table
| Description | Bit | Hex Value |
|---|---|---|
| Under-voltage detected | 0 | 0x1 |
| Arm frequency capped | 1 | 0x2 |
| Currently throttled | 2 | 0x4 |
| Soft temperature limit active | 3 | 0x8 |
| Under-voltage has occurred | 16 | 0x10000 |
| Arm frequency capping has occurred | 17 | 0x20000 |
| Throttling has occurred | 18 | 0x40000 |
| Soft temperature limit has occurred | 19 | 0x80000 |
System Configuration Info with Vcgencmd
The vcgencmd can be used to inspect and dump the current system configuration. By default, the output is directed to the standard output (the terminal) but using a pipe the output can be redirected to a file for comparison.
Get Tom's Hardware's best news and in-depth reviews, straight to your inbox.
| Description | Command | Example Output |
|---|---|---|
| Returns system configuration | vcgencmd get_config int | arm_64bit=1 arm_boost=1 arm_freq=2400 arm_freq_min=1000 arm_peri_high=1 audio_pwm_mode=2 auto_initramfs=1 camera_auto_detect=1 core_freq=910 core_freq_min=500 disable_commandline_tags=2 disable_fw_kms_setup=1 disable_l2cache=1 disable_overscan=1 display_auto_detect=1 display_default_lcd=-1 display_hdmi_rotate=-1 display_lcd_rotate=-1 dvfs=4 enable_gic=1 enable_uart=-1 force_eeprom_read=1 force_pwm_open=1 framebuffer_depth=16 framebuffer_ignore_alpha=1 framebuffer_swap=1 gpu_freq_min=500 hdmi_enable_4kp60=1 hevc_freq =910 hevc_freq_min=500 ignore_lcd=-1 init_uart_clock=0x2dc6c00 isp_freq=910 isp_freq_min=500 mask_gpu_interrupt1=16418 max_framebuffers=2 over_voltage_avs=0x20404 pause_burst_frames=1 program_serial_random=1 total_mem=8192 usb_max_current_enable=1 v3d_freq=960 v3d_freq_min=500 vpred=8921 hdmi_force_cec_address:0=65535 hdmi_force_cec_address:1=65535 |
| Returns memory split for Arm CPU | vcgencmd get_mem arm | arm=1020M |
| Returns memory split for GPU | vcgencmd get_mem gpu | gpu=4M Note: For Pi 5 this seems to be dynamically allocated. |
A Simple Benchmarking Script with Vcgencmd
With our knowledge of vcgencmd and Bash scripting we can make a simple benchmarking tool that will take a CPU temperature, speed and throttle status reading every 60 seconds and then store the details in a CSV file.
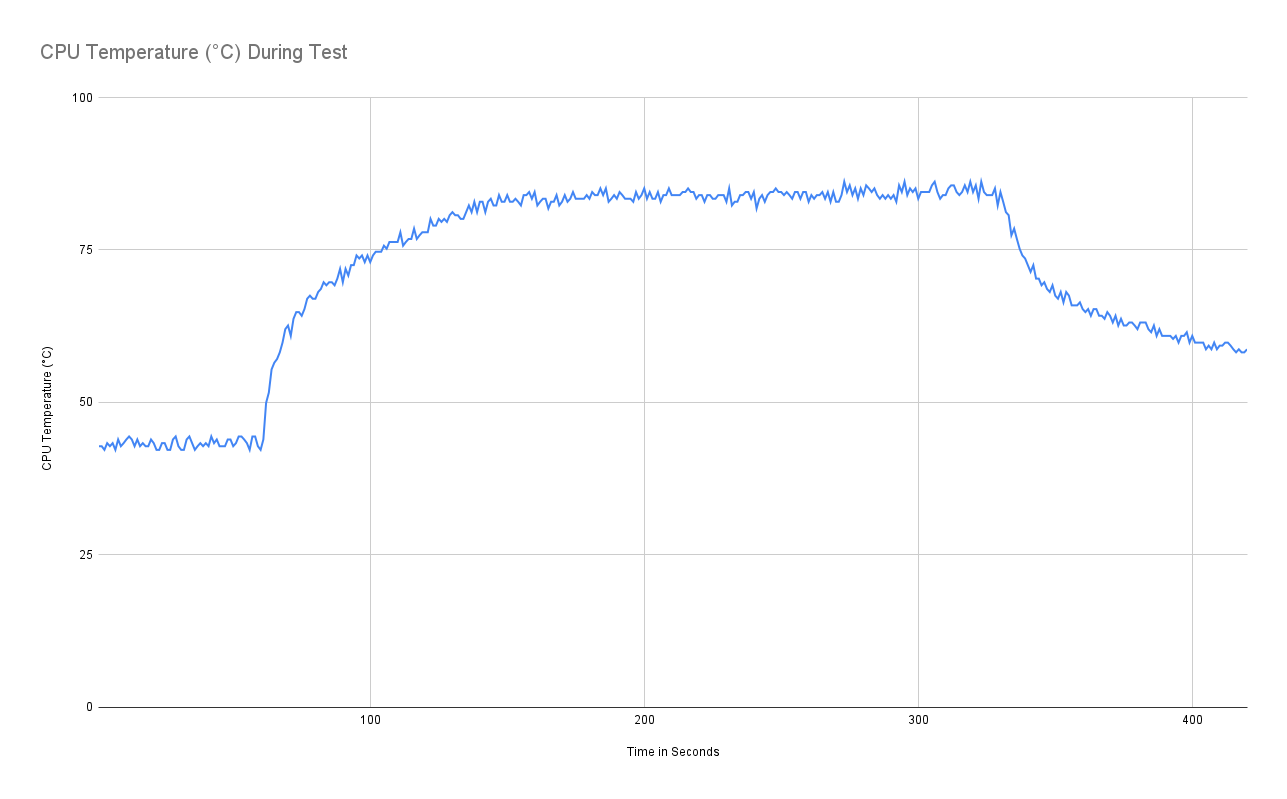
The script is split into three sections. A 60-second idle temperature reading which gives a baseline to reference from. The second part is the stress test itself, using stress to push all four cores for five minutes. Finally we repeat the idle period for 60-seconds to show the CPU cooling down.
We’re going to write this script on a Raspberry Pi 5, but the same script will work on all models of Raspberry Pi.
1. Open a terminal and update the software repositories and then install stress. Stress is a command line tool to stress test CPUs.
sudo apt update && sudo apt install stress2. From the main Raspberry Pi desktop menu select Programing >> Geany. Geany is a great and lightweight text editor for coding.
3. Tell the script where to find the system shell. This has the name “shabang” a concatenation of sharp (#) and bang (!).
#!/bin/bash4. Output a message to the shell, informing the user of what the application will do. Then create a variable to store the name of the output file. This should be a CSV file, but the name can be your choosing.
echo "Tom's Hardware Benchmark Tool"
output_file="benchmark.csv"
5. Create a header for the CSV file and write to the file. This will set the column headings in the CSV file and spreadsheet.
echo "Timestamp,CPU Temperature (°C),CPU Clock Speed (MHz),CPU Throttled" > "$output_file"6. Output a message to say that the application will idle for 60 seconds.
echo "Idle data for 60 seconds"7. Create a for loop that will iterate 60 times.
for i in {1..60}; do8. Write the current time to a variable, then print the timestamp to the shell.
   timestamp=$(date +"%Y-%m-%d %H:%M:%S")
   echo "$timestamp"
9. Use vcgencmd to get the current CPU temperature, cut out any information except for the temperature and save to a variable. Then echo the temperature to the shell. If we don’t do this then we will have to sanitize the data in the CSV file, but right now we can automate its removal.
   cpu_temp=$(vcgencmd measure_temp | cut -d= -f2 | cut -d\' -f1)
   echo "$cpu_temp"
10. Using vcgencmd, get the current CPU speed in MHz, save it to a variable and then print the speed to the shell. We have to slice the speed from the output of the command and then divide by 1.000,000 to get the speed in MHz.
   cpu_clock_speed=$(($(vcgencmd measure_clock arm | awk -F= '{print $2}') / 1000000))
   echo "$cpu_clock_speed"
11. Check if the CPU has been throttled, save the data to a variable and print to the shell. This will return a bit pattern, please refer to the table to decode.
   throttled_status=$(vcgencmd get_throttled)
   echo "$throttled_status"
12. Echo a series of # to the shell. This will help break the data into sections when it prints across the terminal window.
echo "################"13. Write the data to the CSV file. Note that we use >> to append the data to the CSV file. If there were only a single > it would be overwritten.
echo "$timestamp,$cpu_temp,$cpu_clock_speed,$throttled_status" >> "$output_file"14. Still inside the for loop, pause for one second and then close the for loop. The code in the for loop will write 60 readings to the CSV file, one per second of the idle time.
   sleep 1
done
15. Call the stress command to run a stress test on all four CPU cores for 300 seconds (five minutes). The “&” will place the command in the background and not block our script from running.
stress --cpu 4 -t 300 &16. Echo (print) a message to say that the stress test is now starting.
echo "Stress data for 300 seconds"17. We repeat the for loop from before, simply change the 60 to 300 and then record the same temperature, CPU speed and throttle status to the variables and then write to the CSV file.
for i in {1..300}; do
   timestamp=$(date +"%Y-%m-%d %H:%M:%S")
   echo "$timestamp"
   cpu_temp=$(vcgencmd measure_temp | cut -d= -f2 | cut -d\' -f1)
   echo "$cpu_temp"
   cpu_clock_speed=$(($(vcgencmd measure_clock arm | awk -F= '{print $2}') / 1000000))
   echo "$cpu_clock_speed"
   throttled_status=$(vcgencmd get_throttled)
   echo "$throttled_status"
   echo "################"
   echo "$timestamp,$cpu_temp,$cpu_clock_speed,$throttled_status" >> "$output_file"
   # Sleep for 1 second
   sleep 1
done
18. The final section is a cool down period, allowing the CPU to go back to normal. This is the same loop as the idle period.
echo "Cool down data for 60 seconds"
for i in {1..60}; do
   # Get current timestamp
   timestamp=$(date +"%Y-%m-%d %H:%M:%S")
   echo "$timestamp"
   # Get CPU temperature in degrees Celsius
   cpu_temp=$(vcgencmd measure_temp | cut -d= -f2 | cut -d\' -f1)
   echo "$cpu_temp"
   # Get CPU clock speed in MHz
   cpu_clock_speed=$(($(vcgencmd measure_clock arm | awk -F= '{print $2}') / 1000000))
   echo "$cpu_clock_speed"
   # Check if the CPU is throttled
   throttled_status=$(vcgencmd get_throttled)
   echo "$throttled_status"
   echo "################"
   # Append data to CSV file
   echo "$timestamp,$cpu_temp,$cpu_clock_speed,$throttled_status" >> "$output_file"
   # Sleep for 1 second
   sleep 1
done
19. Save the code as benchmark.sh to your home directory.
20. In a terminal, make the file executable.
chmod +x benchmark.sh21. From the terminal, run the code and wait for the benchmark to complete.
./benchmark.sh22. Import the CSV file into a spreadsheet and use it to produce graphs / tables of your findings.


Complete Code Listing
#!/bin/bash
echo "Tom's Hardware Benchmark Tool"
output_file="benchmark.csv"


echo "Timestamp,CPU Temperature (°C),CPU Clock Speed (MHz),CPU Throttled" > "$output_file"
echo "Idle data for 60 seconds"
for i in {1..60}; do
    timestamp=$(date +"%Y-%m-%d %H:%M:%S")
    echo "$timestamp"
    cpu_temp=$(vcgencmd measure_temp | cut -d= -f2 | cut -d\' -f1)
    echo "$cpu_temp"
    cpu_clock_speed=$(($(vcgencmd measure_clock arm | awk -F= '{print $2}') / 1000000))
    echo "$cpu_clock_speed"
    throttled_status=$(vcgencmd get_throttled)
    echo "$throttled_status"
    echo "################"
    echo "$timestamp,$cpu_temp,$cpu_clock_speed,$throttled_status" >> "$output_file"

    # Sleep for 1 second
    sleep 1
done
stress --cpu 4 -t 300 &

echo "Stress data for 300 seconds"
for i in {1..300}; do
    timestamp=$(date +"%Y-%m-%d %H:%M:%S")
    echo "$timestamp"
    cpu_temp=$(vcgencmd measure_temp | cut -d= -f2 | cut -d\' -f1)
    echo "$cpu_temp"
    cpu_clock_speed=$(($(vcgencmd measure_clock arm | awk -F= '{print $2}') / 1000000))
    echo "$cpu_clock_speed"
    throttled_status=$(vcgencmd get_throttled)
    echo "$throttled_status"
    echo "################"
    echo "$timestamp,$cpu_temp,$cpu_clock_speed,$throttled_status" >> "$output_file"

    # Sleep for 1 second
    sleep 1
done

echo "Stress test complete, 60 second cool down period"

echo "Cool down data for 60 seconds"
for i in {1..60}; do
    timestamp=$(date +"%Y-%m-%d %H:%M:%S")
    echo "$timestamp"
    cpu_temp=$(vcgencmd measure_temp | cut -d= -f2 | cut -d\' -f1)
    echo "$cpu_temp"
    cpu_clock_speed=$(($(vcgencmd measure_clock arm | awk -F= '{print $2}') / 1000000))
    echo "$cpu_clock_speed"
    throttled_status=$(vcgencmd get_throttled)
    echo "$throttled_status"
    echo "################"
    echo "$timestamp,$cpu_temp,$cpu_clock_speed,$throttled_status" >> "$output_file"

    # Sleep for 1 second
    sleep 1
done

Les Pounder is an associate editor at Tom's Hardware. He is a creative technologist and for seven years has created projects to educate and inspire minds both young and old. He has worked with the Raspberry Pi Foundation to write and deliver their teacher training program "Picademy".
-
bit_user Thanks for publishing this. I had previously used some stuff in /sys/ to get info about the CPU clockspeed and temperature, which was fine for my purposes. It would've been very nice to see some explicit confirmation of when throttling happened, however.Reply
A few suggestions:
The bash script is simple enough for the data collection, but analysis would benefit from Python, at which point I'd recommend using numpy.array to hold the data. It gives you a nice way to represent tabular data in a single data structure, and then select just the columns you're interested in.
You can then use matplotlib to make nice plots.
As for benchmarking, stress-ng is my go-to and I think a vastly deeper tool than stress. Try it with options: –cpu 4 –cpu-method matrixprodTo exercise the GPU, I think one command I've used is: glmark2-es2 –off-screen –run-forever (of course, you should first ensure you're using the actual GPU driver and not software emulation).Overall, thanks! I hope this means we can look forward to more detailed power & temperature data in future Pi benchmarks!
; ) -
Spardorp I ran into issues that my Pi didnot know the vcgencmd.Reply
Then I found this https://www.nicm.dev/vcgencmd/So should anyone have the same issue, use that guide to install vcgencmd.