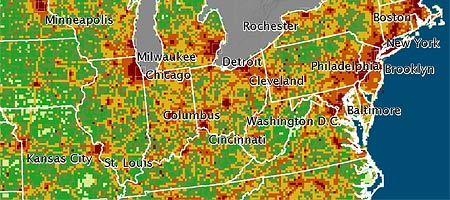
Map Exposes Carbon Dioxide Hotspots In The U.S.
West Lafayette (IN) - Now we can point fingers at certain regions within the U.S. when we are looking for the largest producers of carbon dioxide. Drumroll, please: According to a new "Vulcan" map published by Purdue University, the Southwest is outed as a key player and has been found to be pumping out much more carbon dioxide from fossil fuels than previously estimated.

If you had to guess, which U.S. states would you imagine to be at fault for huge carbon dioxide outputs? You may find surprises in Purdue's map that visualizes carbon dioxide (CO2) levels. Granted, the data provided is based on 2002 and there may have been changes in the past six years, but the university's Vulcan map provides some indication where to look for concentrations of CO2, the most important human-produced gas contributing to global climate change.
In a more general view, Purdue found that "previous maps of U.S. fossil fuel emissions were inadequate for current scientific and policy-making needs." While usually the Northeast and old industry is blamed to be the worst greenhouse gas producer in the U.S., the Southwest has extremely high concentrations as well, according to the map. In fact, atmospheric levels of CO2 may be up to 4.5 times higher in the Southwest than previously estimated, while levels between the Midwest and Northeast may be up to 1.5 times lower. The U.S. is believed to cause about 25% to the world's CO2 output.
On a state-by-state basis, Texas is the largest producer of CO2 in the U.S., due to the size of the sate and multiple heavy hitting areas including Houston, Dallas and San Antonio. California comes in second, followed by Ohio, Pennsylvania, Florida and Illinois. The top 10 is rounded out by Indiana, Louisiana, New York, Michigan and Georgia. The least amount of CO2 is produced by Washington D.C., Vermont, South Dakota, Rhode Island, Hawaii, and Delaware. You can find the detailed listing on the Vulcan page.
Purdue University claims that the new map shows CO2 emissions at more than 100 times more detail than was available before. Until now, data on carbon dioxide emissions were reported, in the best cases, monthly at the level of an entire state. The animated Vulcan model examines CO2 emissions at local levels on an hourly basis. The map accounts for the burning of fossil fuels such as coal as well as gasoline and tracks the hourly outputs at the level of factories, power plants, roadways, neighborhoods and commercial districts.
"Vulcan will be revolutionary in carbon cycle research," he says. "It is the next generation in our understanding of fossil fuel emissions. The implications for climate science, carbon trading and climate change mitigation work are tremendous," said Kevin Gurney, an assistant professor of earth and atmospheric science at Purdue University and leader of the project.
Vulcan is expected to complement NASA's planned December 2008 launch of the Orbital Carbon Observatory satellite, which will measure the concentration of CO2 in the Earth's atmosphere.
Get Tom's Hardware's best news and in-depth reviews, straight to your inbox.