Size Matters: Breaking Down Next Biometrics' 'Madrid Report'
Next Biometrics, an Oslo, Norway-based maker of biometric sensors for mobile, payment and authentication devices, commissioned a study from the Universidad Carlos III de Madrid that looked at the relationship between the size of a given fingerprint sensor and its performance in terms of false acceptance and rejection rates.
Like you, we're skeptical of any study whose results confirm the commissioning entity's hypothesis, but Next Biometrics CEO Tore Etholm-Idsøe was clear that although his company covered the costs of the study, the research team at the university developed the test criteria and performed the study with no input or involvement from Next.
We were further interested in learning more about how the study was conducted, so we asked Etholm-Idsøe for some clarifications and also examined the report itself.
The Why
To hear Etholm-Idsøe tell it, Next Biometrics needed a full-fledged research study in order to combat a trend they were seeing in a key segment of the biometrics market. His company contends that you need a larger sensor to ensure greater accuracy. He noted that this is not an issue in traditional fingerprint sensor markets such as door systems and corporation applications, because no one compromises on sensor size. (And why would they? Space is not much of an issue for those applications.)
In the mobile market, however, size is of course a major concern, and thus we see smaller sensors. "But these guys here -- Samsung, and Apple, and Huawei, and so on -- have now created products with much smaller sensors," said Etholm-Idsøe. "And when we come -- a small innovation company -- and say 'No, that's not right, you shouldn't do that,' then it's: 'Who are you? This is Apple, this is Samsung.' So, okay, we need to prove it then."
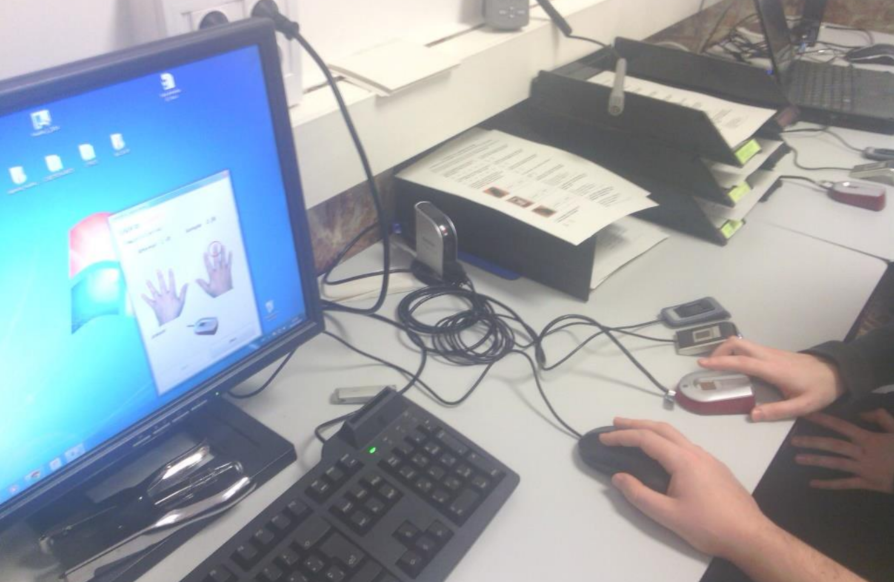
And thus, Next commissioned a study, which is known as the "Madrid Report," which involved having hundreds of participants come in and put their fingers on three different sensors.
Ground Rules
Professor Raul Sanchez-Reillo of the Universidad Carlos III de Madrid led the study, and he and his team laid out some criteria for ensuring accurate, fair and repeatable results.
Get Tom's Hardware's best news and in-depth reviews, straight to your inbox.
"[The researchers] said, 'Okay, the operators [meaning those who are actually conducting the research] cannot know which sensor comes from the sponsor.' The sequence of the sensors was randomized," said Etholm-Idsøe.
The randomization was important because even if no one knows which sensor is which, the participants might become a little better at performing the scan; thus, the third and final scan would probably always be a slightly more accurate read.
Further, participants came in multiple times, at spaced-out intervals. Each participant had six of their fingers scanned twice, and the length of time between each visit was at least two weeks. The time span was important because, as Etholm-Idsøe pointed out, "Fingers can change, the weather can change. And these things matter [in terms of testing the accuracy of a sensor]."
In total, some 589 individuals participated in the Madrid Report, and they combined to contribute 180,000 fingerprints -- 60,000 from each of the three sensors. The study materials indicate that the group analyzed 300 million comparison transactions.
The tests were performed in what amounts to ideal circumstances: Indoors, with dry fingers. The team measured the thumb, index and middle fingers on both of the participants' hands. The study notes read in part, "In an outdoor environment variables like wet, dry, dirty and skewed placement fingers will often render parts of sensors useless."
Etholm-Idsøe said that the study was conducted using ISO best practice methodology.
The Results
We discussed some of the results of the study in brief earlier, but a more detailed breakdown is worth examining.
The researchers used three sensors for the test:
| Company | Sensor | Implementation | Full size area | Resolution | Technology |
|---|---|---|---|---|---|
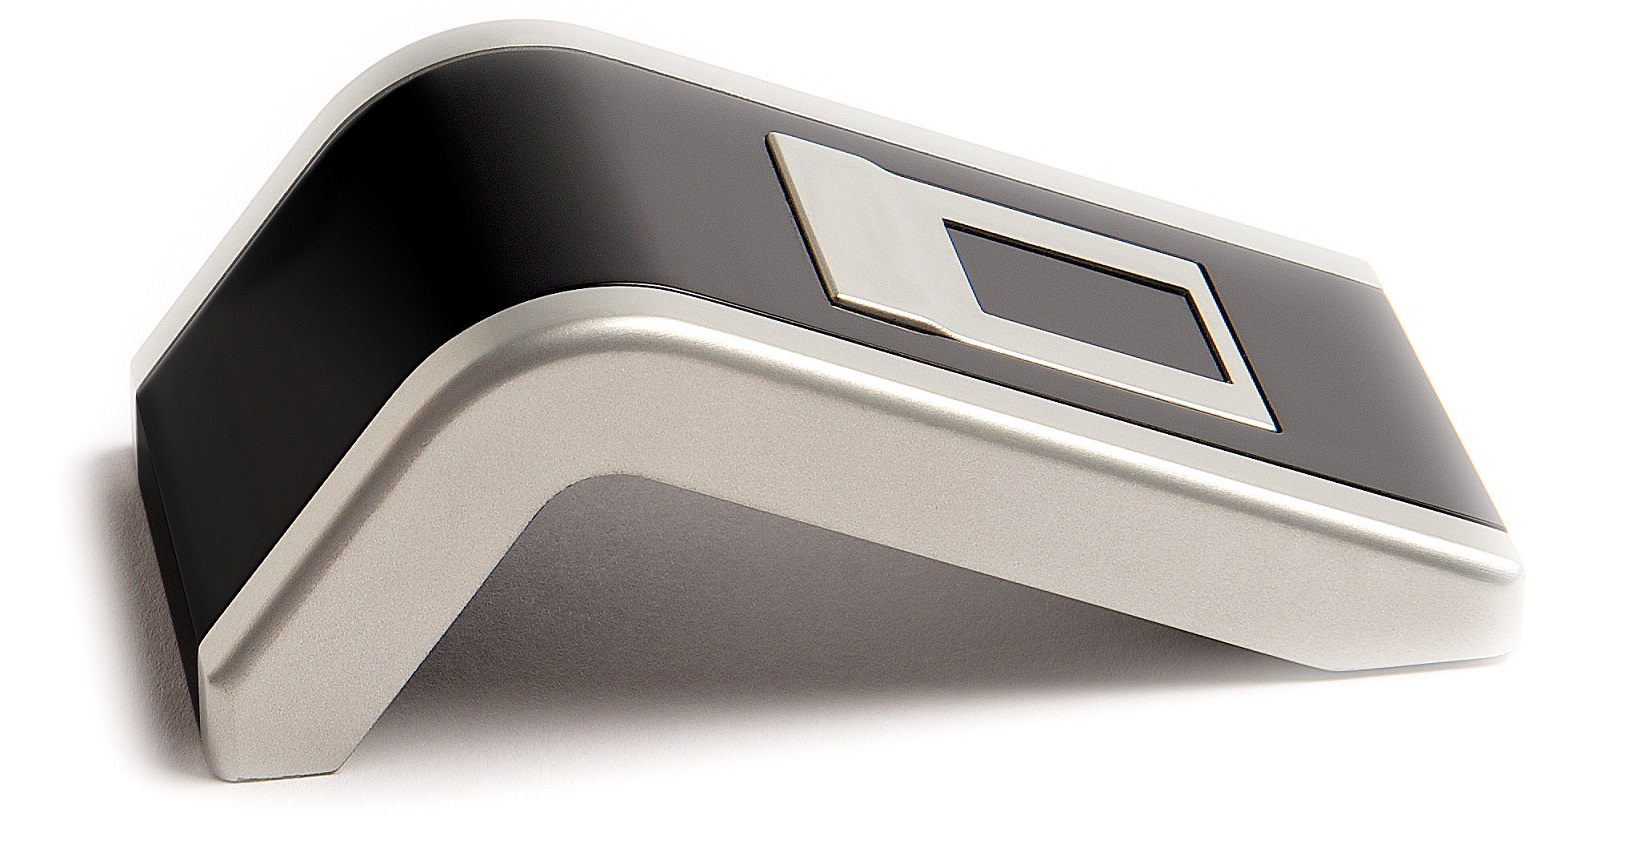
| Next Biometrics | NB-1010 | NB-3010 "Oyster" | 11.9x16.9 mm (180x256 pixels) | 385 dpi | Active Thermal Principle |
| CrossMatch | TCS1 | Eikon Touch 510 | 12.8x18 mm (192x270 pixels) | 500 dpi | Capacitive |
| Fingerprints | FPC-1011F3 | FPC-ASD | 10.6x14 mm (152x200 pixels) | 363 dpi | Capacitive |
Each was tested at their respective "full" sizes, and then at three reduced sizes (12x12 mm, 10x10 mm and 8x8 mm). The cropping was meant to simulate smaller sensor sizes.
One potential qualm some may have in regard to using the cropping method is that it necessarily, and artificially, reduces the sensor's size without regard to resolution. In other words, there is logic to thinking that a smaller sensor with a higher resolution could still prove superior to a smaller sensor with a lower resolution. By cropping the available area of these sensors, the researchers effectively created small, low-res sensors.
We imagine that some of Next's competitors would posit just that, but as we noted in our earlier coverage, Etholm-Idsøe stated that a higher resolution sensor doesn't help much in terms of accuracy, because those sensors are looking at tiny details, such as skin pores, that can change over time. What he's saying is that looking more closely at something that is not static (in this case, pores that open and close depending on temperature and humidity) does not enhance the accuracy of a scan.
You can take from that what you will.
The Madrid Report produced test results with two use cases in mind: a high security setting (such as payment applications, corporate access, and government environments) and a low security setting (convenience-focused applications, such as authenticating your phone or logging in to a PC).
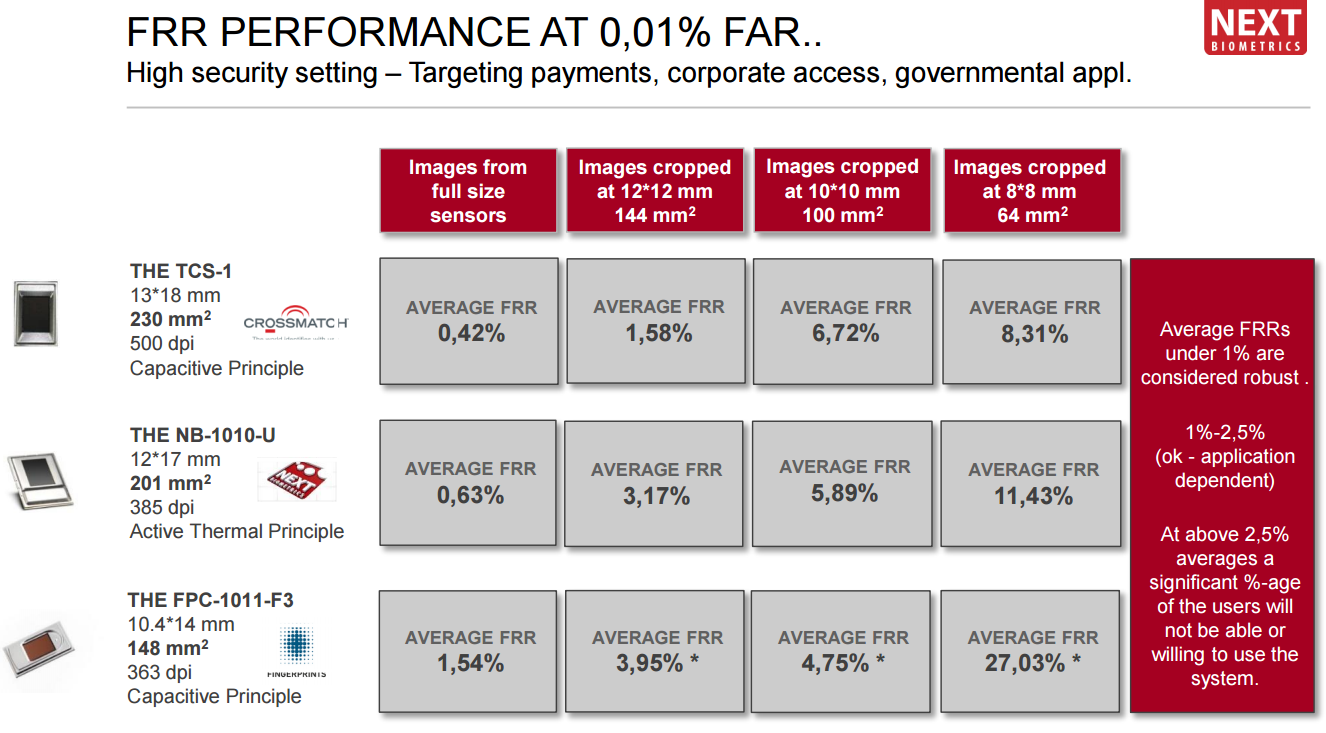
In a high security setting, the researchers stated that a false rejection rate (FRR) of under 1 percent is considered robust. At full size, both the Next Biometrics and CrossMatch sensors came in well under that mark, whereas the Fingerprints sensor was over, at 1.54 percent. When cropped, none of the sensors hit the "robust" benchmark.
Considering that an FRR of 1-2.5 percent is considered "Ok -- application dependent," all three sensors would be acceptable when cropped at 12x12 mm. None passes muster when cropped further.
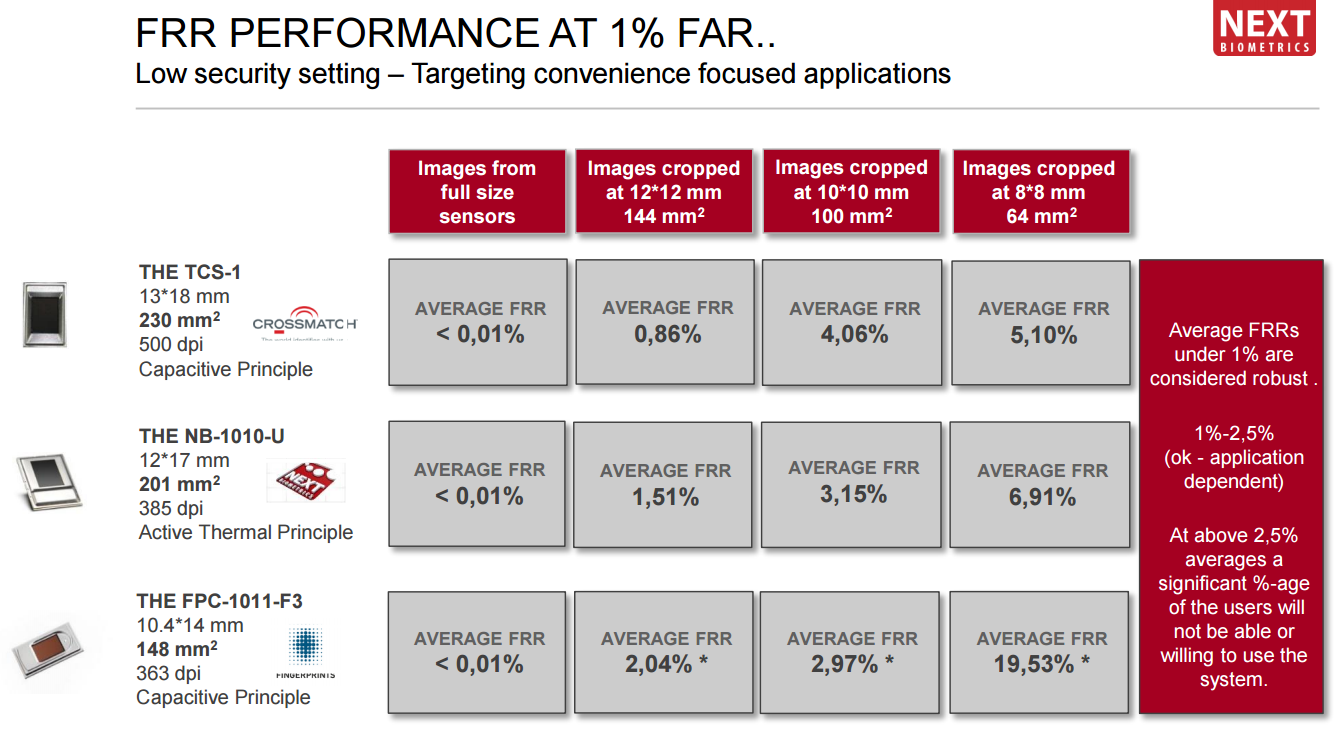
The low security setting performance across the board was far better, though. All three delivered stellar FRR of below 0.01 percent at full size -- remember, the mark they need to hit to be considered "robust" is anything below 1 percent.
When cropped to 12x12 mm, only the CrossMatch sensor could be considered robust. However, both the Next Biometrics and Fingerprint sensors landed in the "Ok -- application dependent" range at 1.51 percent and 2.04 percent, respectively. As in the high security settings tests, none of the sensors delivered acceptable FRR when cropped further.
One interesting bit to note is that the Fingerprint sensor's performance scaled well between 12x12 mm and 10x10 mm, but at 8x8 mm it was beyond useless. This is in contrast to the CrossMatch and Next Biometrics sensors, whose performance appears to scale fairly proportionately across the various cropped sizes.
You can read the full report here, and a summary here. For more on Next Biometrics and its fingerprint sensor technology, read our previous coverage here.
Seth Colaner is the News Director at Tom's Hardware. Follow him on Twitter @SethColaner. Follow us @tomshardware, on Facebook and on Google+.
Seth Colaner previously served as News Director at Tom's Hardware. He covered technology news, focusing on keyboards, virtual reality, and wearables.
-
honkuimushi "Considering that an FRR of 1-2.5 percent is considered "Ok -- application dependent," all three sensors would be acceptable when cropped at 12x12 mm."Reply
That doesn't appear to match the charts. At 12x12 mm, only the TCS appears to have a an FRR under 2.5% at 1.58%. The other 2 are over 3%.


