Cloud storage and data backup company Backblaze has published its annual report of hard drive failures for 2022. Nowadays, many consumers are already likely using one of the best SSDs on the market. However, hard drives continue to remain relevant when it comes to secondary storage. Given the nature of the company's business, the statistics indicate which hard drives are the most reliable.
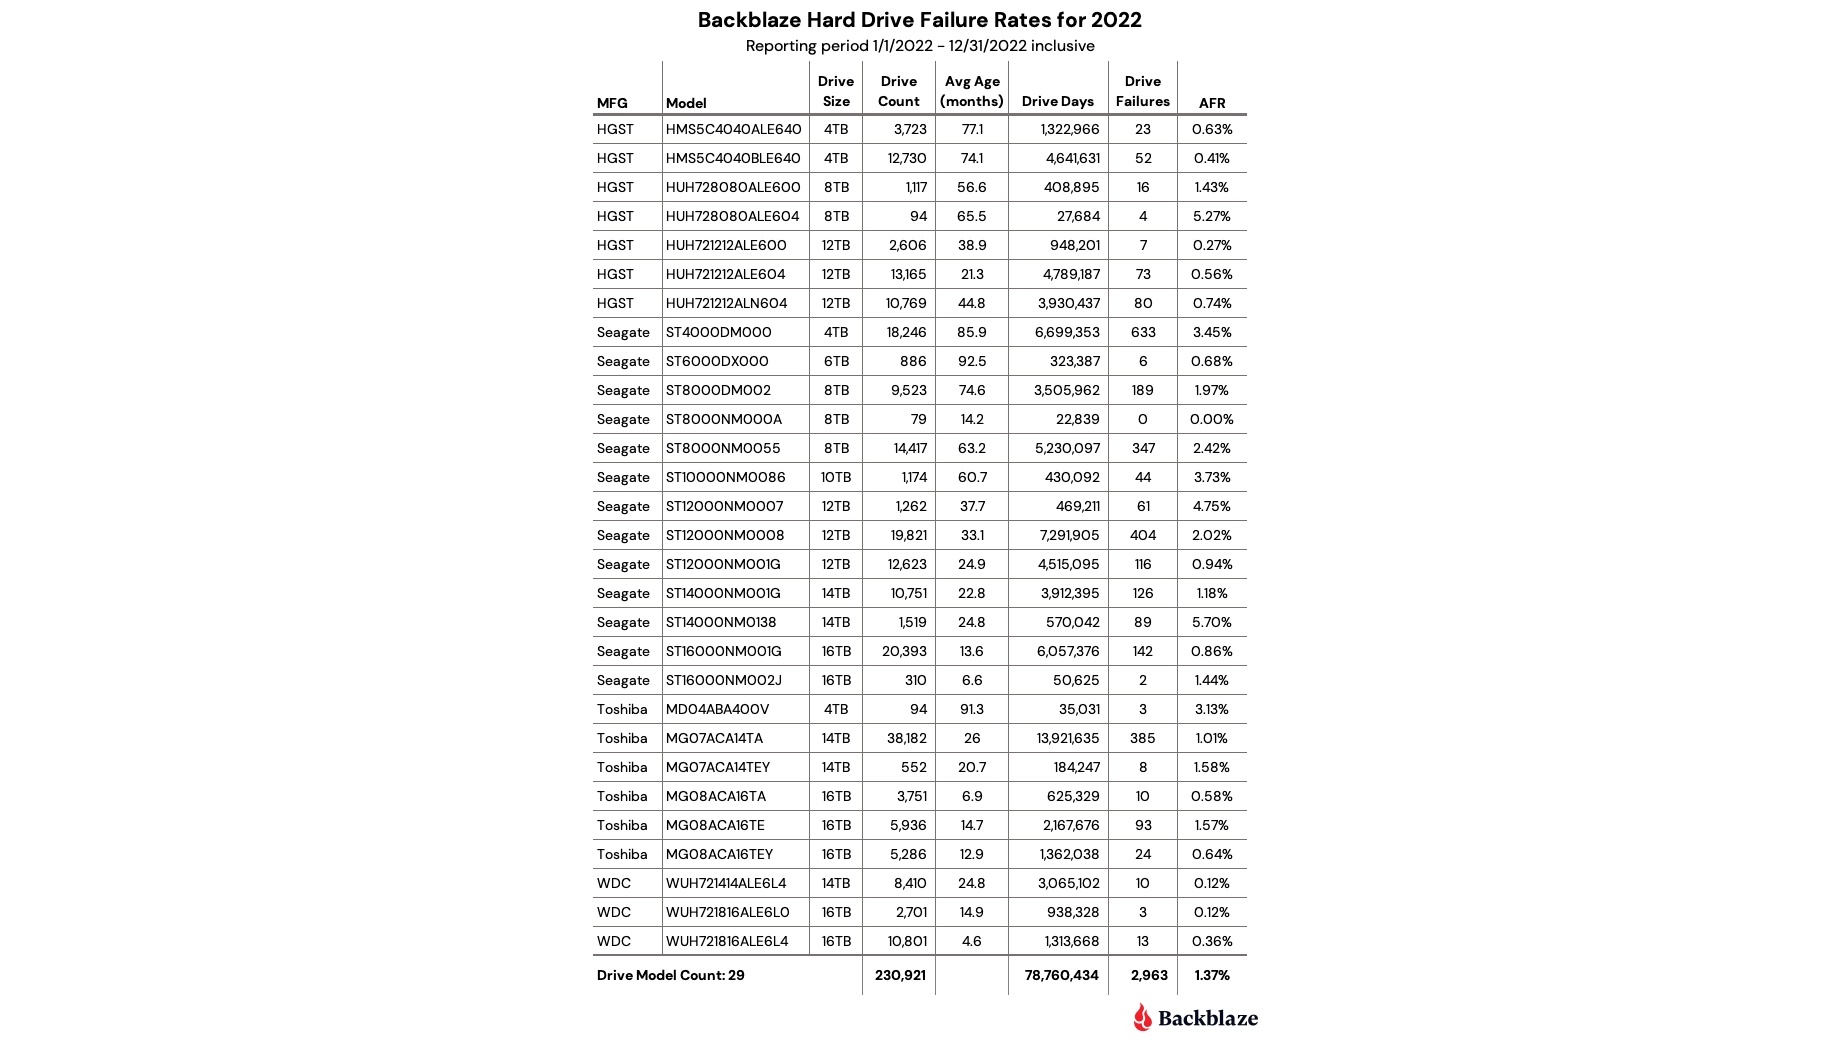
Backblaze has some insight into which hard drives make the most durable storage devices. According to the company, it has 235,608 hard drives as of December 2022. Of the entire lot, 4,299 are boot drives, and the remaining 231,309 are data drives. Backblaze's results focus on the latter. The company removed 388 drives from the report due to them being test drives or models where the sample size is less than 60 drives. That leaves Backblaze with 230,921 hard drives for analysis.
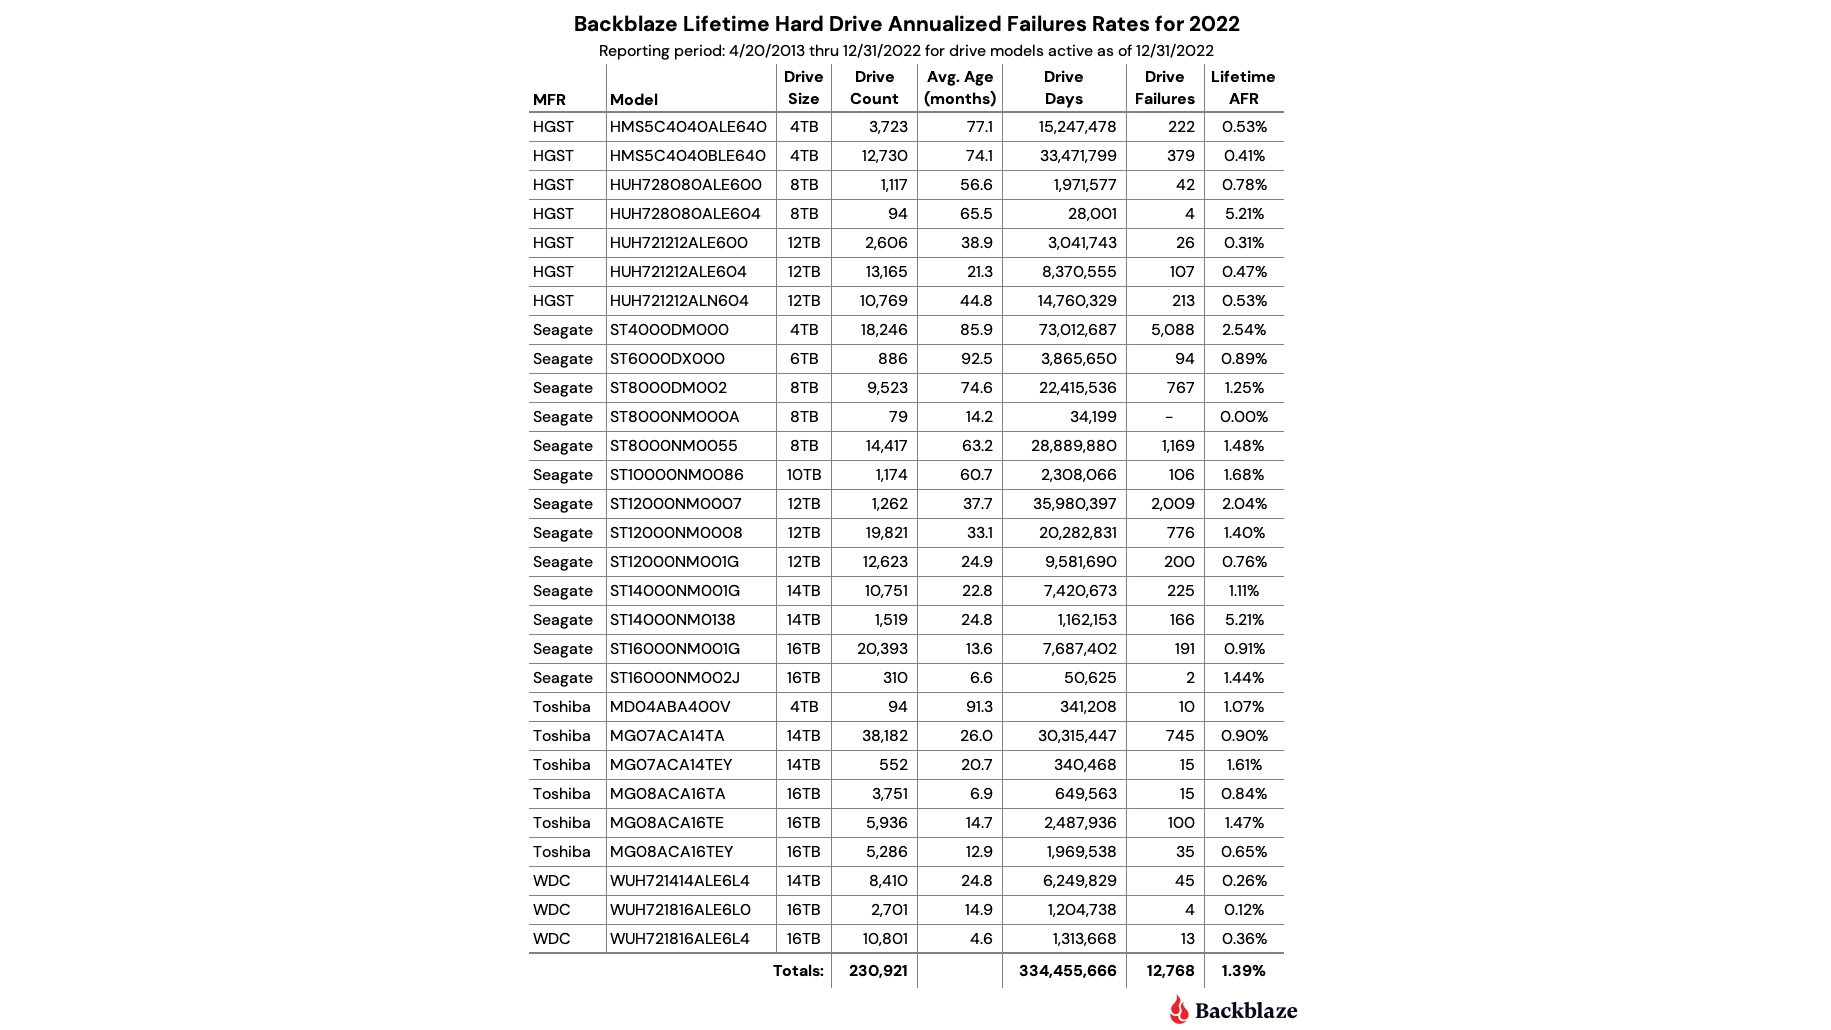
Seagate's Exos 8TB (ST8000NM000A) was the report's star. According to the numbers, the hard drive presented zero failures in 2022. The devil is in the details, though. Backblaze stated that it only had 79 drives on active duty, so the sample size is tiny compared to some of the other models that total up to tens of thousands. Furthermore, the Seagate 8TB drives had only been in service for 22,839 days and are primarily used as spare drives to replace 8TB drives that have died.
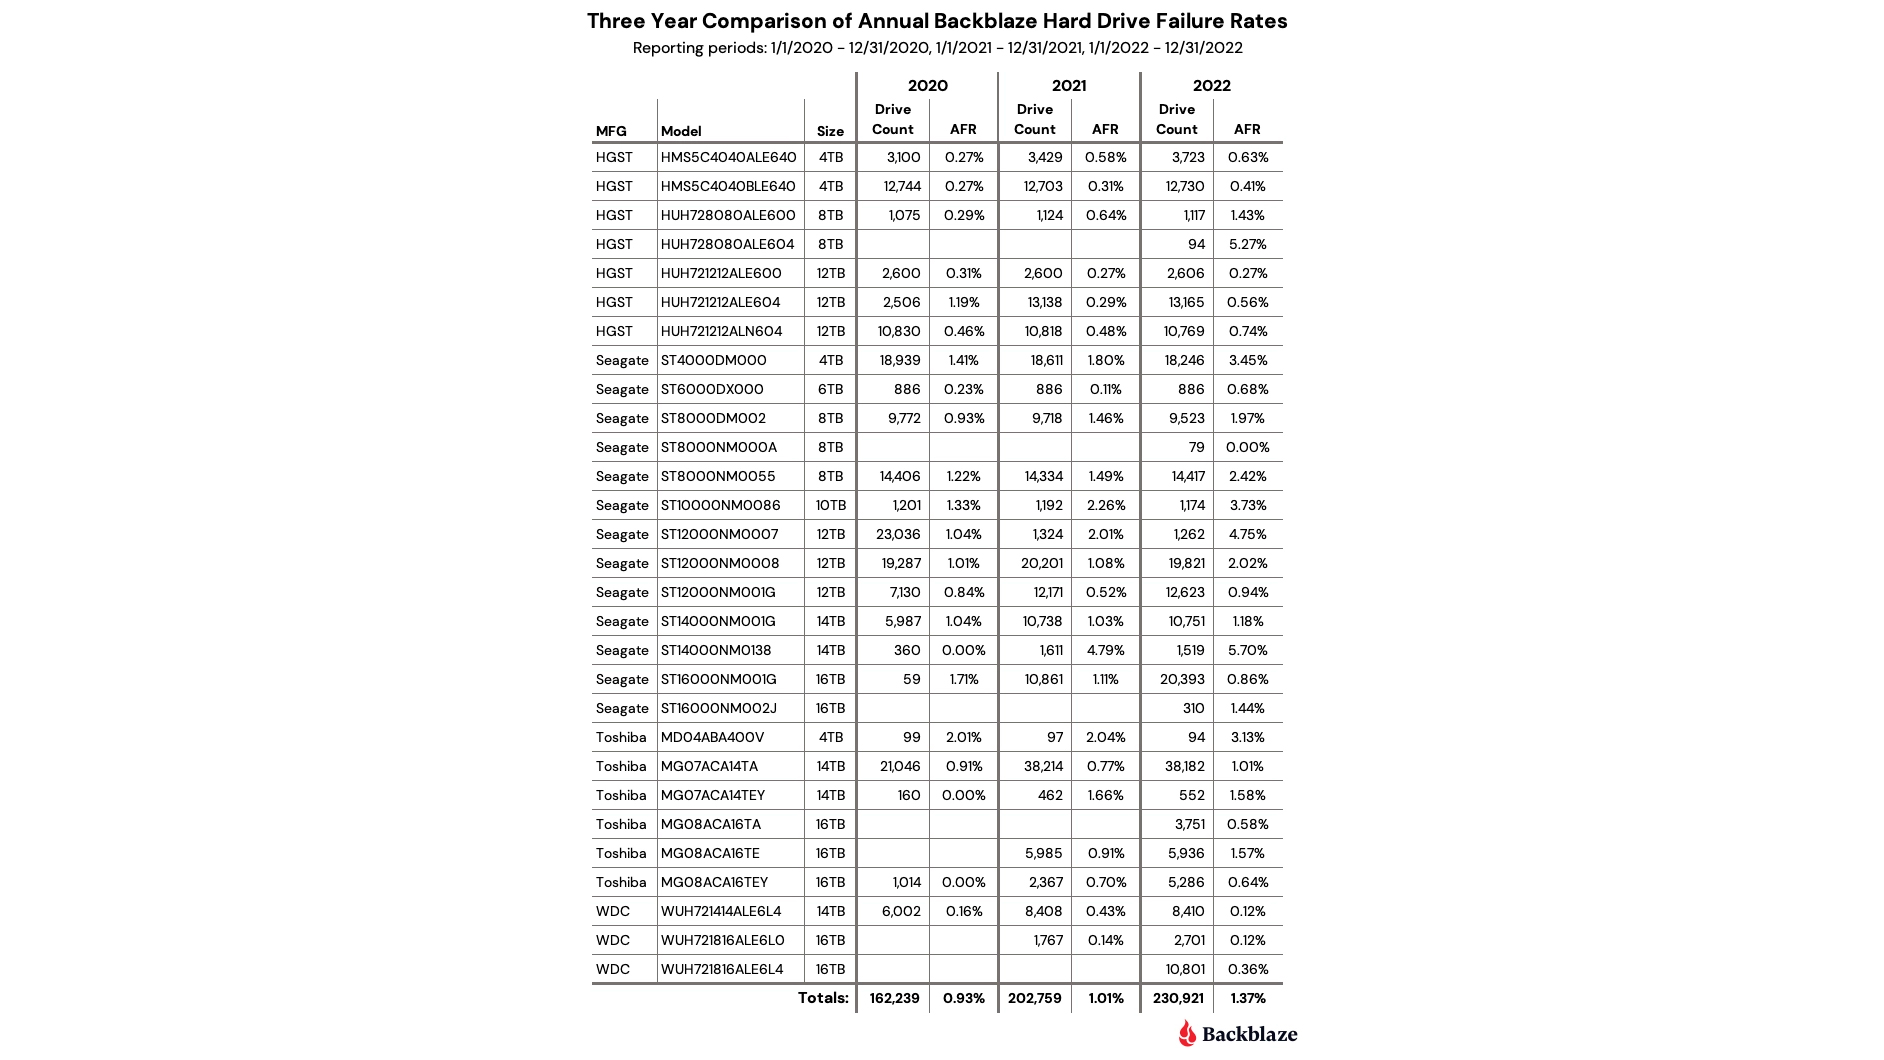
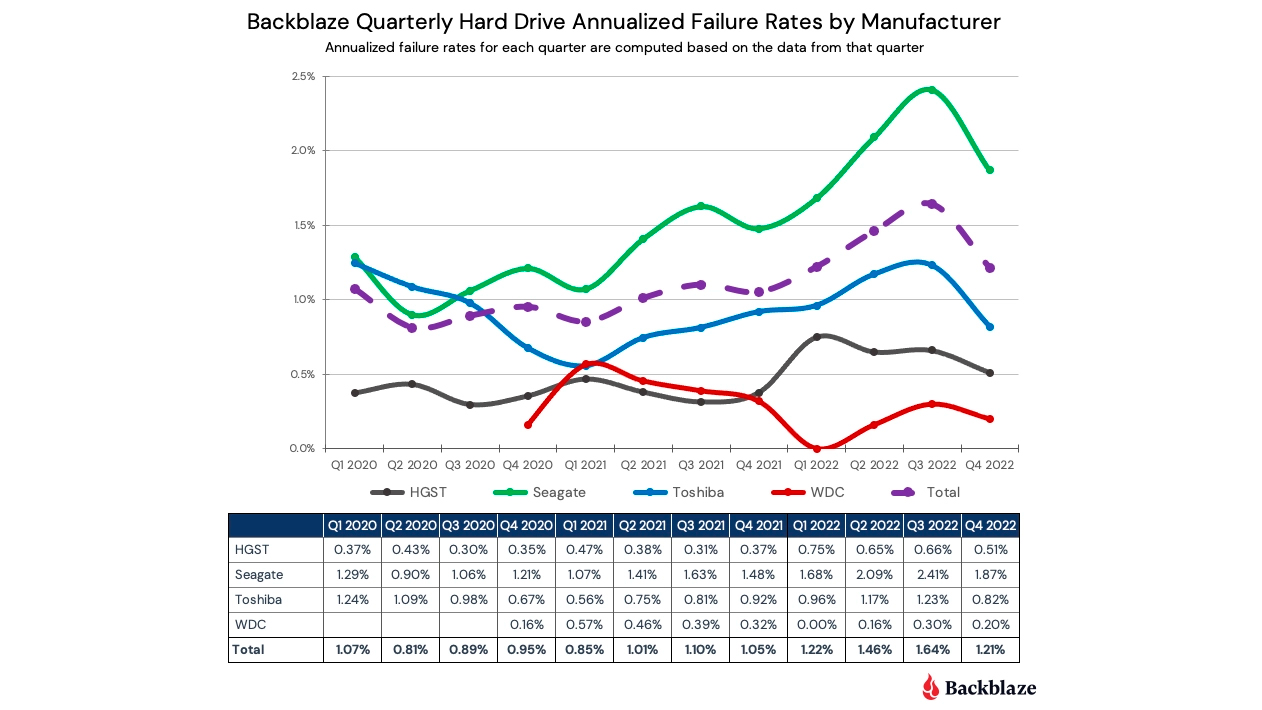
The annualized failure rate (AFR) for hard drives has increased over the last three years. For example, Backblaze recorded an AFR of 0.93% in 2020 and 1.10% in 2021. The AFR for 2022 was up to 1.37%. The main reason for the increase is due to the age of the drives. Like any other hardware, hard drives are more prone to failure as they age.
At first sight, the HGST Ultrastar He8 8TB (HUH728080ALE604) and Seagate Exos X14 14TB (ST14000NM0138) have the highest failure rates at 5.27% and 5.70%, respectively. Do note that the drive count and drive days for the two models are significantly lower than other models, so again the numbers can skew wildly from a few bad apples.
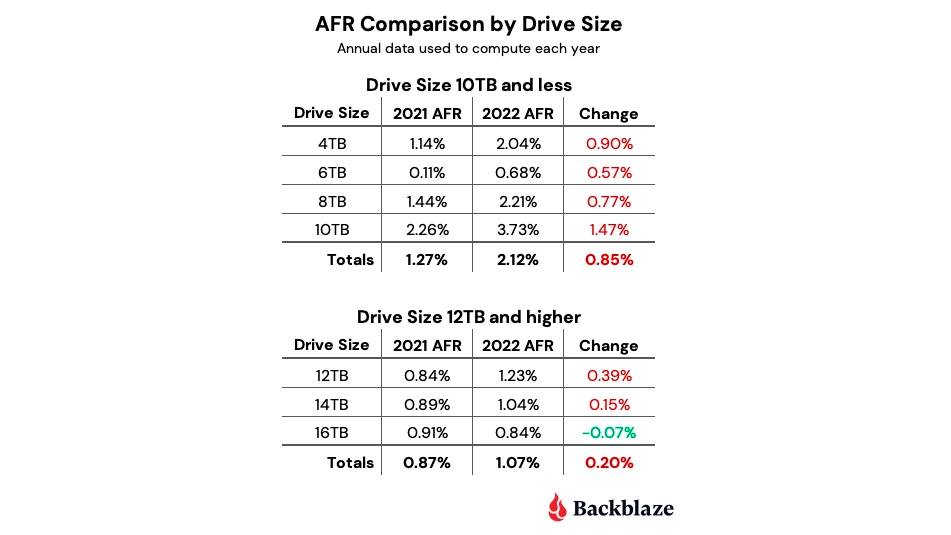
Hard drives with a capacity of 10TB or lower showed an overall 0.85% increase in failures from 2021 to 2022. Notably, the 10TB drives had the highest AFR (3.73%) for 2022. The higher-density drives at 12TB or larger exhibited a 0.20% increase. The 16TB drives are the only ones that boasted a decreased AFR. According to Backblaze, the small drives (4TB, 6TB, 8TB, and 10TB) account for 44.5% of the drive failures in 2022. However, they only represent 28.7% of drive days. The smaller drives are perishing more frequently because they've been in operation for longer.
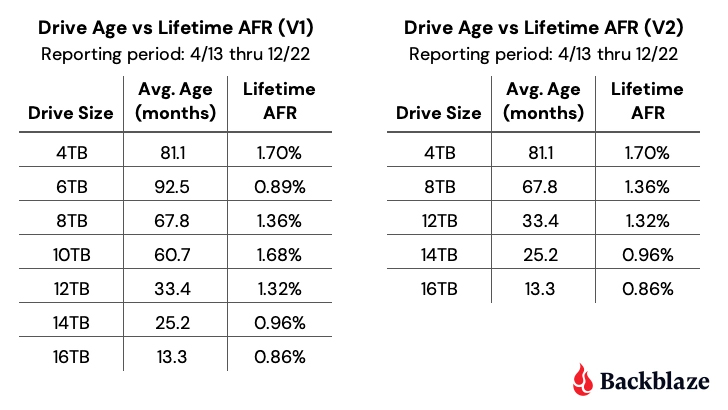
Backblaze's data confirmed the correlation between drive age and drive failure. When drives get older, they are more likely to die. For example, the 4TB drives, which account for an average age of 81.1 months, have an AFR of 1.70%, whereas the 8TB, with 67.8 months, show 1.36%. In comparison, the 16TB drives, 13.3 months, total up to 0.86%. Backblaze highlighted that sample sizes for the 6TB and 10TB drives are small. Additionally, their drive days are also lower. The 6TB group has a 0.89% AFR and the 10TB group flaunts 1.68%.
Looking at the drive failures by the manufacturer, Backblaze noted that Seagate leads the pack, with Toshiba in second place. That's not to say that Seagate hard drives are less reliable. On the contrary, the company's Seagate drives are substantially older than the other vendors. Furthermore, Backblaze explained that Seagate drives are typically cheaper, although their failure rates are higher in the environment where they operate. Nonetheless, the failure rate isn't significant enough to turn the drives into less cost-effective options over their lifetime.
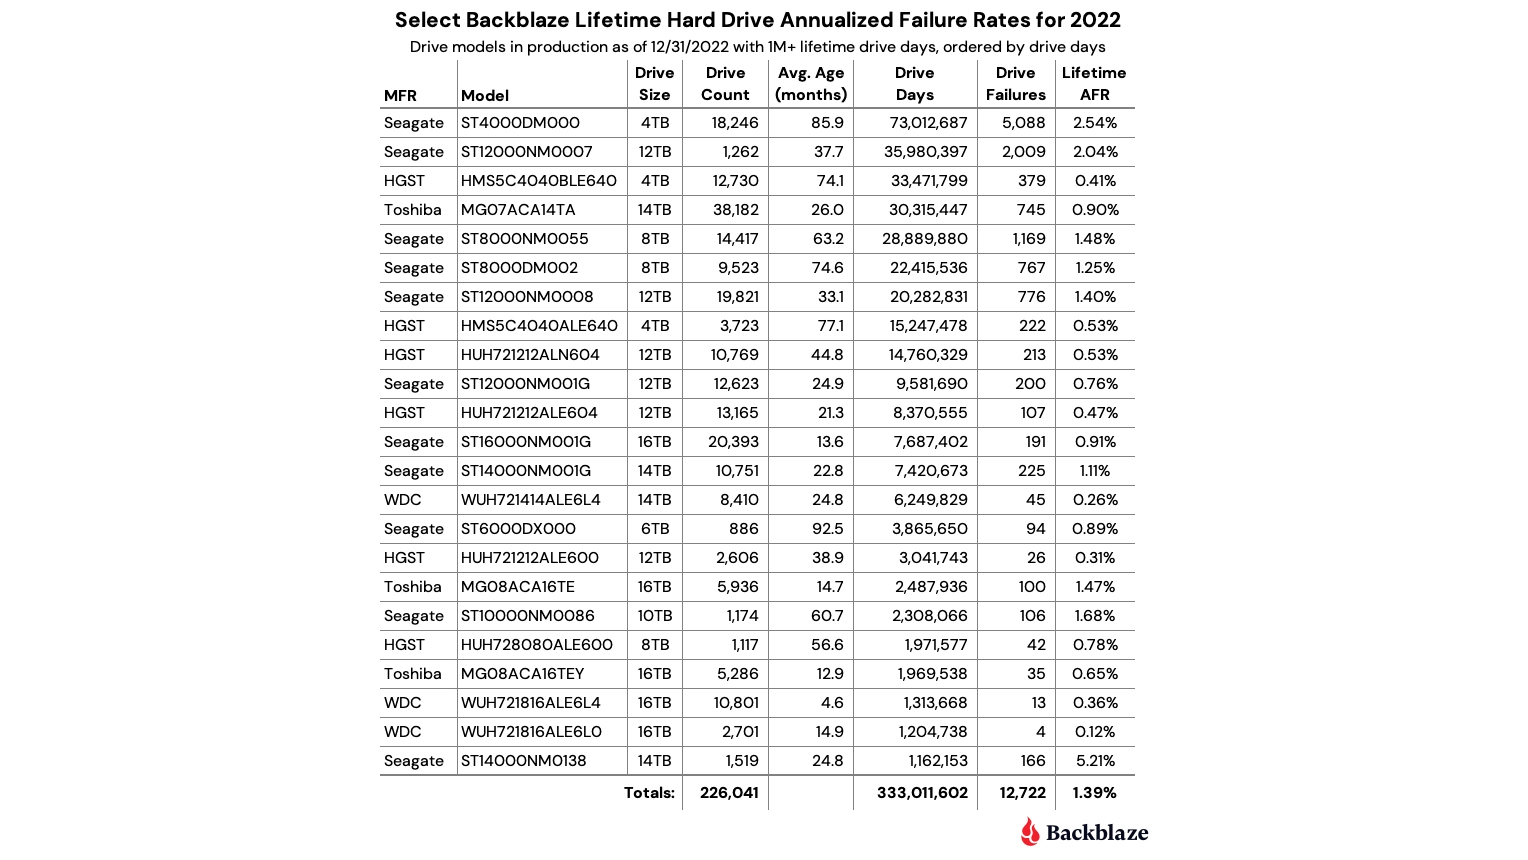
Lastly, Backblaze looked at the lifetime AFR for the company's drives. Presently, the lifetime AFR is 1.39%. It's an improvement over last year's 1.40% compared to the previous quarter, where the value was 1.41%. The most noteworthy model is Seagate's Barracuda 4TB (ST4000DM000) drive, which has amassed over 73 million drive days with a lifetime AFR of 2.54%.
Get Tom's Hardware's best news and in-depth reviews, straight to your inbox.

Zhiye Liu is a news editor and memory reviewer at Tom’s Hardware. Although he loves everything that’s hardware, he has a soft spot for CPUs, GPUs, and RAM.
-
PEnns "The devil is in the details, though. Backblaze stated that it only had 79 drives on active duty, so the sample size is tiny compared to some of the other models that total up to tens of thousands. "Reply
Those "reports and survey" are so pathetically flawed and worthless, it's a waste of bandwidth and time to even read their titles!! -
nitts999 Disagree. The alternative is what? Amazon reviews? With 79 drives in this case and many more in others, you would quickly find a drive that was a lemon/highly problematic. So at the very least, it lets you know that on the whole, the drive is good or bad.Reply -
USAFRet Reply
What or who do you rely on for drive stats like this?PEnns said:"The devil is in the details, though. Backblaze stated that it only had 79 drives on active duty, so the sample size is tiny compared to some of the other models that total up to tens of thousands. "
Those "reports and survey" are so pathetically flawed and worthless, it's a waste of bandwidth and time to even read their titles!! -
AtrociKitty Reply
Backblaze releases their drive stats report quarterly, so even the small datasets become valuable as trends emerge. I'd also prefer Backblaze continue to share all their drive data, versus only presenting a curated subset.PEnns said:"The devil is in the details, though. Backblaze stated that it only had 79 drives on active duty, so the sample size is tiny compared to some of the other models that total up to tens of thousands. "
Those "reports and survey" are so pathetically flawed and worthless, it's a waste of bandwidth and time to even read their titles!! -
PlaneInTheSky ReplyBackblaze's data confirmed the correlation between drive age and drive failure. When drives get older, they are more likely to die.
More likely? Or is it like dice in craps where you'll eventually throw a 12, but the likelyhood stays the same for each throw. -
PEnns ReplyUSAFRet said:What or who do you rely on for drive stats like this?
Well, the article clearly states: "... so the sample size is tiny compared to some of the other models that total up to tens of thousand "
Does that mean we throw in the towel and accept this as the bible for hard drive reliability? -
USAFRet Reply
No, that was just remarking on the number (79) of that one particular make/model of drive, compared to the hundreds/thousands of others.PEnns said:Well, the article clearly states: "... so the sample size is tiny compared to some of the other models that total up to tens of thousand "
Does that mean we throw in the towel and accept this as the bible for hard drive reliability?
Not "79" drives total.
Yes, 79 drives is a small sample size to derive any real stats for fleetwide reliability.
But next quarters numbers may be different.
As were the numbers from last quarter.
Again, you have something better?
I'm all ears. -
TJ Hooker Reply
It's an annualized failure rate, so it is indicative of the drives being more likely to fail as they get older.PlaneInTheSky said:More likely? Or is it like dice in craps where you'll eventually throw a 12, but the likelyhood stays the same for each throw. -
bit_user Reply
Whether or not there's a better alternative says nothing about how useful these reports are.nitts999 said:Disagree. The alternative is what? Amazon reviews?
And yes, when comparing products of the same type, you can get a first-order impression by looking at the aggregate Amazon ratings. I tend to condense them from a 5-star scale into a 3-tier scale. If you sum the top 2 ratings and the bottom 2 ratings, you end up with 3 groups of reviewers: those who like/love the product, the mixed/neutral group, and those who dislike/hate it. You can just compare the proportion of like/love or dislike/hate between 2 different products, to get an overall impression of how it's being received.
Then, depending on the product type, you can dive into some of the negative reviews, to see if the common issues tend to be relevant for you. If not, then you can reduce the weight of those negative reviews on your decision-making process.
Anyway, getting back to Backblaze's reports, what would be really nice is if they actually provided histograms of drive life, per model number. They almost definitely have data on when each individual drive went into service, so they can trivially compute its lifespan. Even if they don't track this, the SMART statistics include how many hours the drive was powered on, so you could query those if the drive wasn't totally bricked. This would be a lot more useful than the gross AFR stats they present, since that aggregates together cases of infant mortality with middle-age and old-age deaths.