QNAP TVS-863+ 8-Bay NAS Review
Why you can trust Tom's Hardware
Standard Workloads
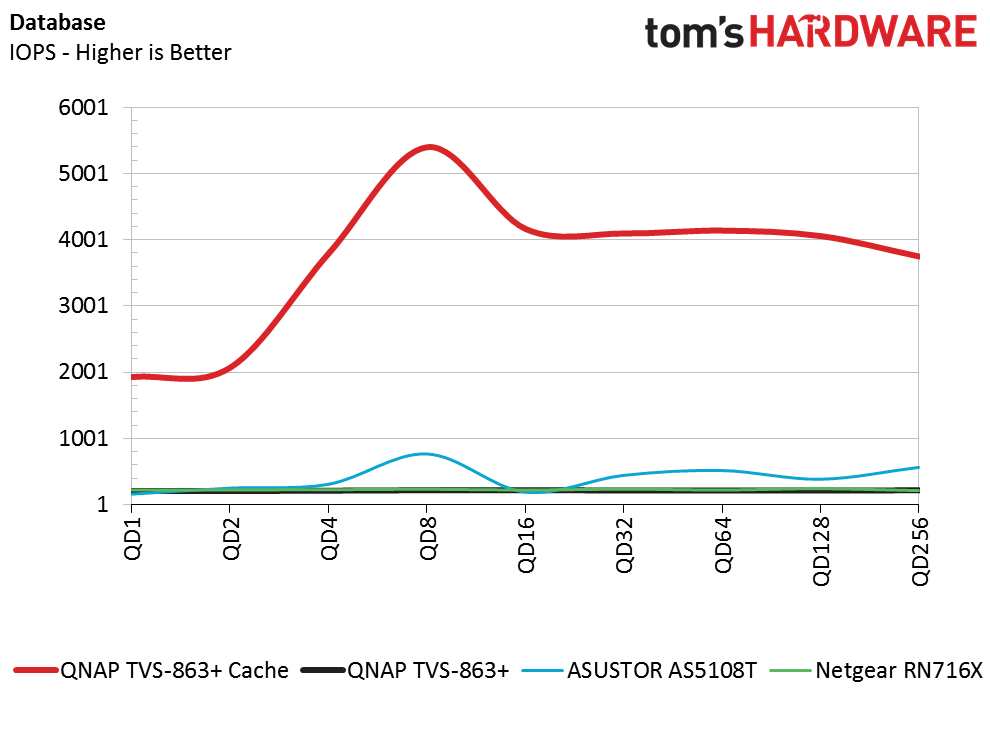
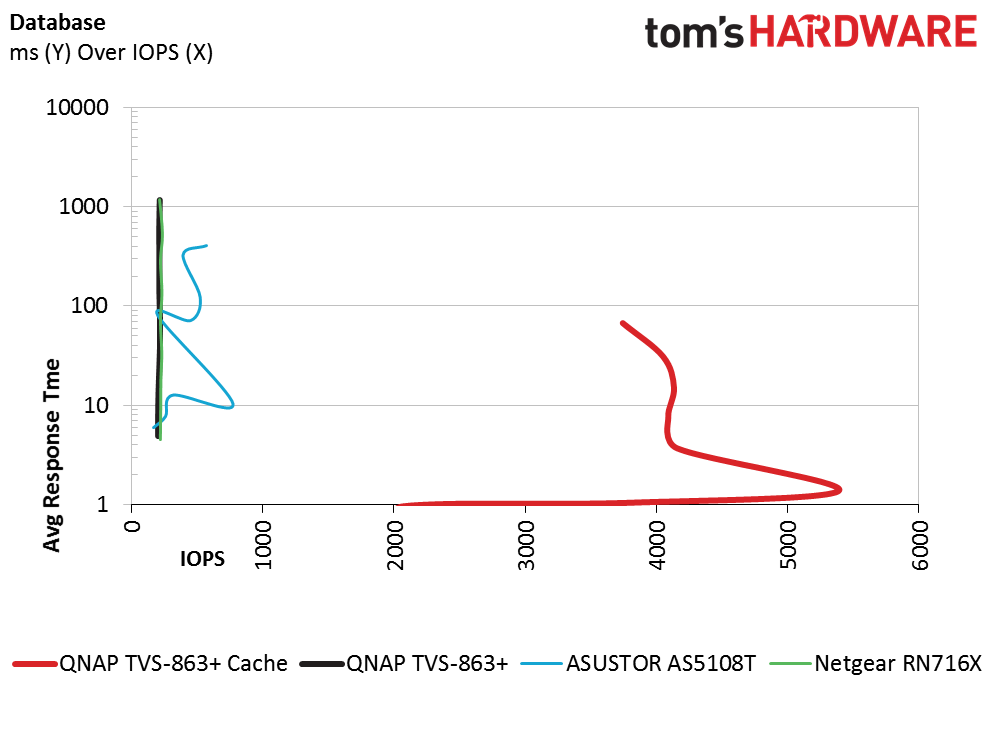
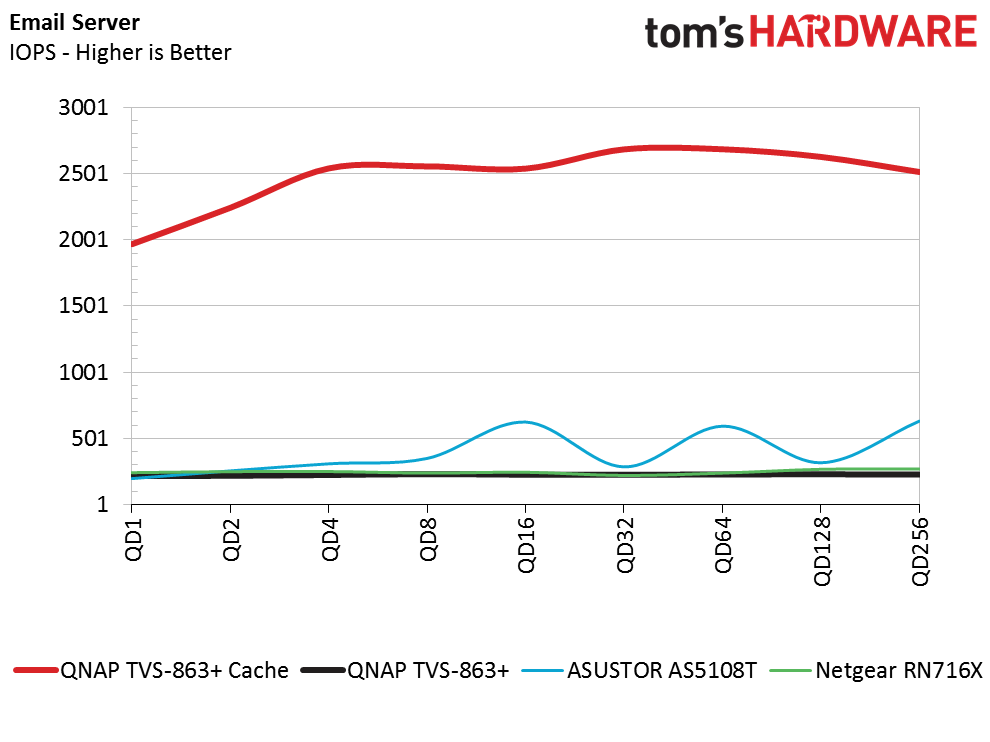
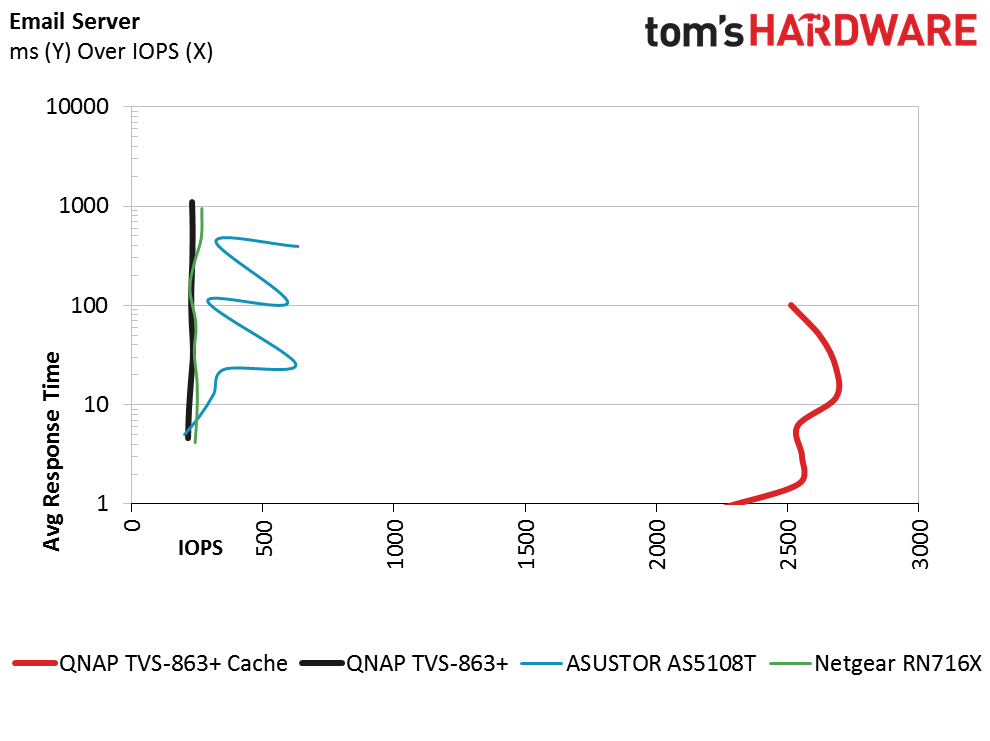
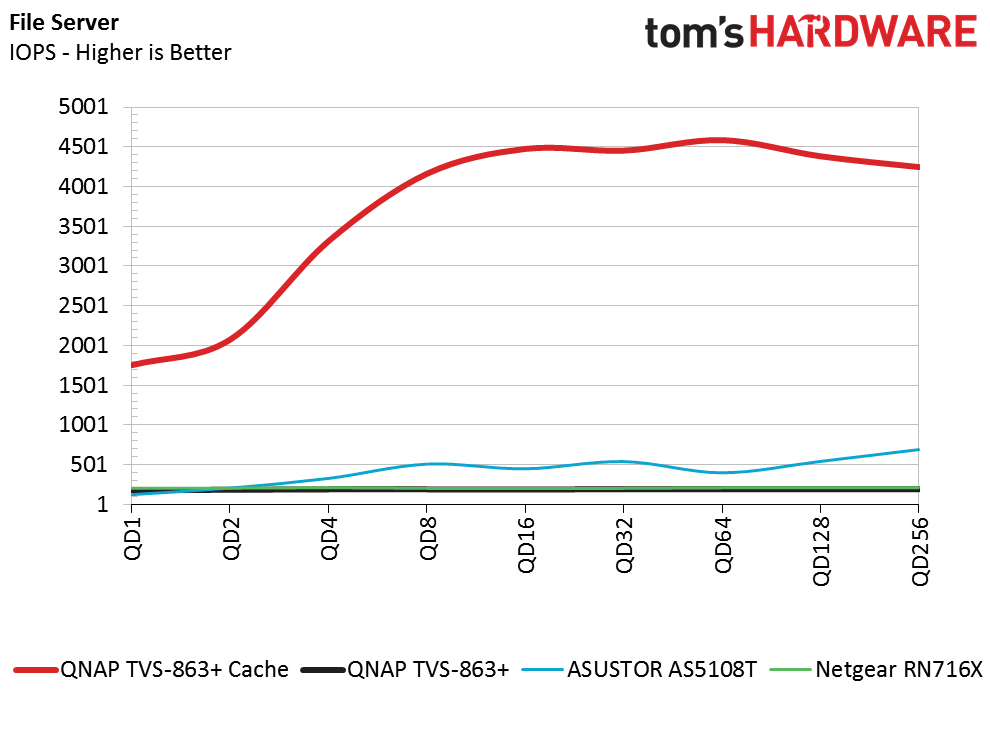
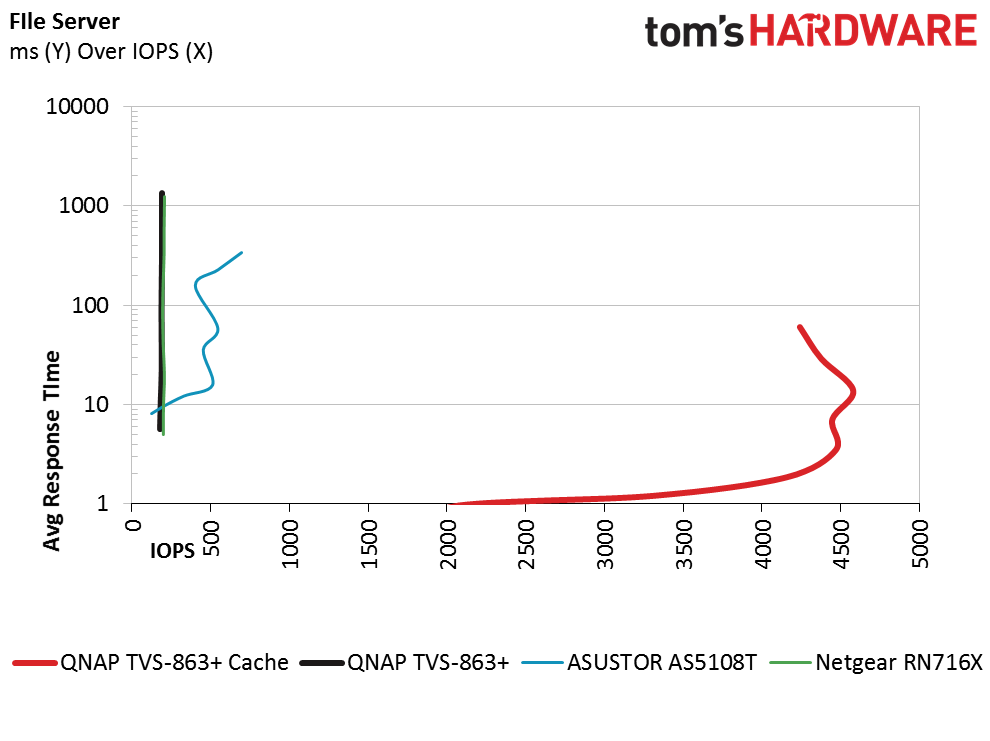
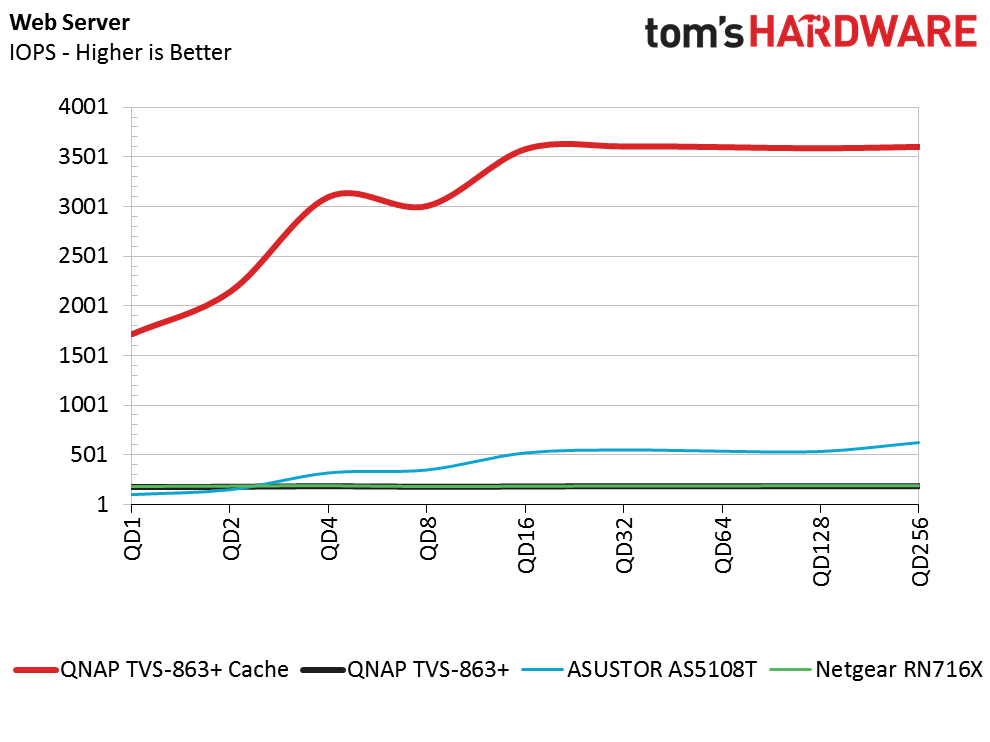
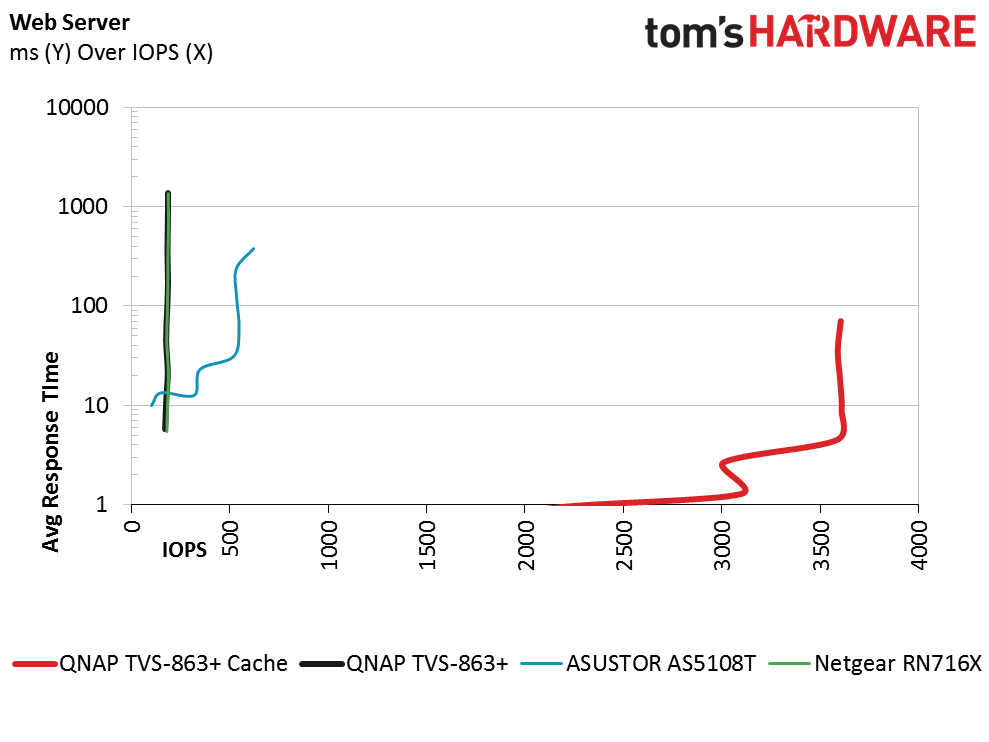
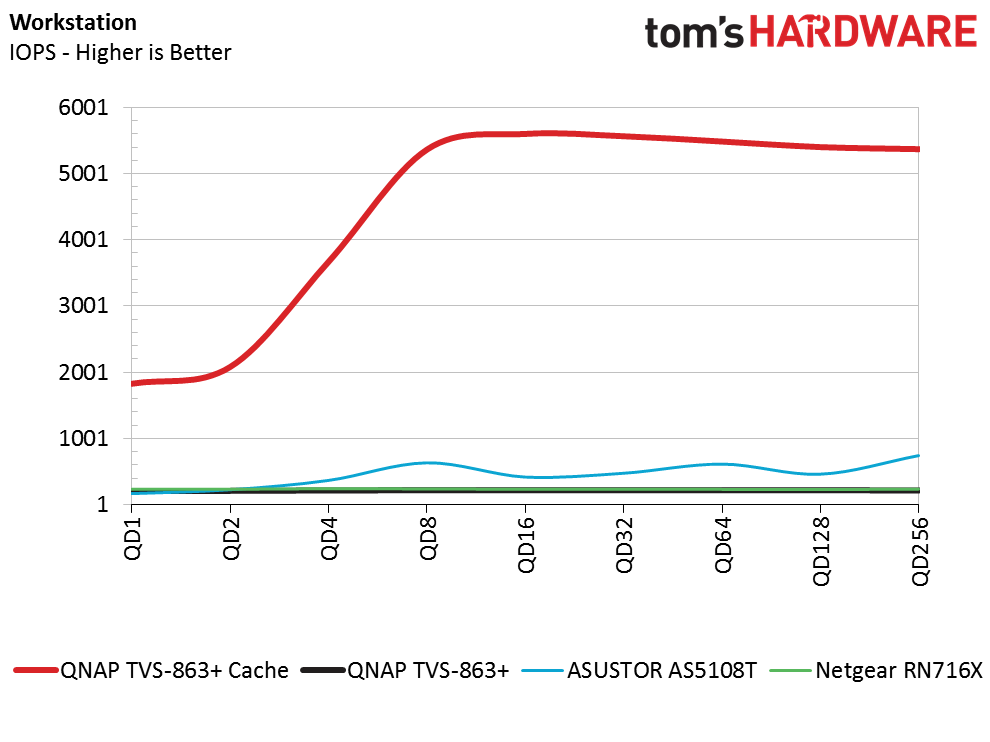
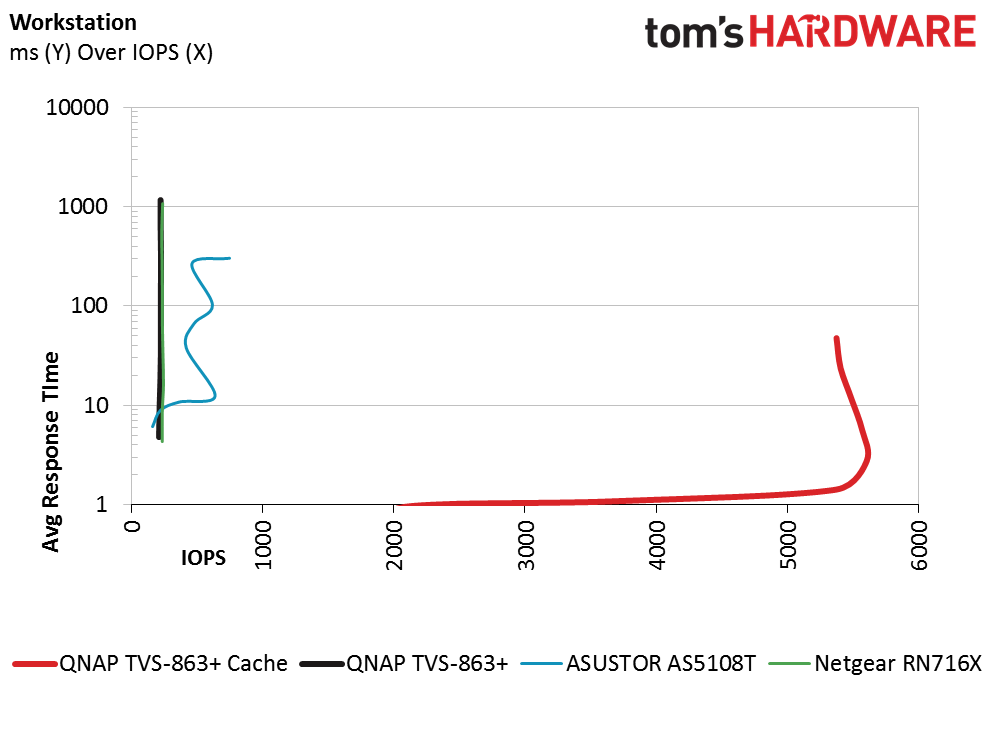
In this series of tests we ran traditional server and workstation storage workloads. There are two charts for each workload. The first chart simply measures IOPS performance with increasing queue depths. The second chart is one you don't see used very often. In the snake charts we show latency (vertical) with IOPS (horizontal). Ideally, the second chart will show the IOPS moving to the right and staying very close to the bottom of the results area (showing lower latency).
In many of the workloads we found very little performance scaling as the queue depth increased with the TVS-863+ without cache. The Netgear ReadyNAS 716X delivered the same flat-line results and the ASUSTOR AS5108T showed a little variation. With the SSD cache enabled, the TVS-863+ picked up the pace quite a bit and manage to increase performance until reaching peak. After the peak performance the IOPS drops due to the latency increasing for each additional IO.
The snake chart shows the latency and allows system administrators to tune the system for quality of service. Using the database test as an example, system administrators can use the cache system to get 5400 IOPS at roughly 3ms response time from the storage system. Any more IOPS past that point will have a negative impact on latency.
Get Tom's Hardware's best news and in-depth reviews, straight to your inbox.

Chris Ramseyer was a senior contributing editor for Tom's Hardware. He tested and reviewed consumer storage.
-
basroil If it wasn't for the price (expensive, though justifiable) I would snap one up, seems to be a great option for photo/video storage and playback, and if you have a 10gigE network, even photo editing from it is going to feel snappy!Reply -
CRamseyer I have a few disk drive reviews coming out soon and the iSCSI performance from this system is actually faster than a local disk.Reply -
"iSCSI is an amazing technology that allows users to mount a volume to a host computer and have it control the volume as a local drive. You can even set the computer up to boot from the iSCSI share, just like a SAN."Reply
A massive over-simplification which is almost up there with "I want to buy an internet for my PC". It's not a technology, it's a protocol which runs over dead-basic Ethernet connectivity. The technology is "Ethernet", not iSCSI.
You can't boot ALL computers from an iSCSI mounted volume unless you NIC supports it - and most integrated NICs don't.
The "Con" of only having a single 10GbE interface isn't really a con for this type of device - if you need dual 10GbE then it's more likely to be for path diversity than performance, in which case you'll be wanting multiple switches and you're then into the realms of enterprise requirements, and if that's the case you wouldn't buy one of these in any case. -
basroil "It's not a technology, it's a protocol which runs over dead-basic Ethernet connectivity. The technology is "Ethernet", not iSCSI."Reply
iSCSI is technology, bridging two different protocols, and it doesn't need to be done over ethernet (though most commonly done over ethernet). Sure it's not "network technology" in the sense of low level protocols and physical devices, but it's still just as much a separate technology as TCP/IP, TLS, etc. (i.e. not all technology even has to have the same purpose or independent from others)
"You can't boot ALL computers from an iSCSI mounted volume unless you NIC supports it - and most integrated NICs don't."
Pretty sure all newer vPro systems support it, and definitely anything with PRO series NIC from Intel (and of course server grade NICs). Considering this device is 10gigE, I don't think they meant consumer grade computers booting over it!
As for single 10gigE not being an issue, the only case in which I think people would see it as an issue is in the case of a legacy network still running gigE, in which case two teamed adapters running gigE would certainly still have a benefit. Other than legacy networks, you're right on the ball there. -
Marko Ravnjak "With HGST's new He8 drives with 8GB density, users can easily store up to 64GB of data."Reply
That's not really that much... ;) -
CRamseyer The comments really show just how far NAS system have come. You can do so much with them. I wouldn't go as far as to say one size fits all (not even close) but a small inexpensive system like this can easily serve 20 office systems over VDI.Reply
Dual 10gbE is nice for redundancy in a large network but I'm referring to performance increases against cost. A dual port 10GbE NIC has a very small price premium over a single port 10GbE NIC. QNAP sells both dual and single port 10GbE NICs but only offers the TVS-863+ with a single port. -
nekromobo Did you test the cache with 1 or 2 SSD's? Because with only 1 SSD you can only have read accelerated and need 2 SSD's to get read/write benefits.Reply -
willgart "With HGST's new He8 drives with 8GB density, users can easily store up to 64GB of data. After RAID 6 overhead, that comes out to about 48GB of usable space with dual disk failure redundancy. "Reply
pretty small ;-)
I prefer the other solutions where we talk about TB not GB... ;-) -
VfiftyV The 8GB DRAM model cost $1,399, while the 16GB model was $100 higher, at $1,400. Because math.Reply -
SirGCal "The TVS-863+ with eight drive bays is a little too large for most home theater installations"Reply
WHAT? I currently have two 8-drive setups running RAID 6. A 12TB and a 24TB setup (2G and 4G drives respectively). And I'm almost full (89%). I have a large movie collection (all legal and no, you can't get any... ;-) and I also use about 8TB of that for (fake) work data storage. So I'm up to 28TB of movie and music storage that is just about full. I'd happily retire them for a single 48TB solution.
Although building them myself is far cheaper, it's not as small. This is the first unit I'd actually consider buying that I've seen thus far. I'd for sure be excited to test it and see if it'll do everything else I need also (seems like it should).