The Fastest 3D Cards Go Head-To-Head
Taxing Modern CPUs With Powerful Graphics
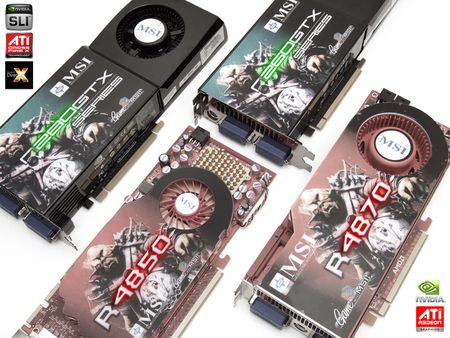
Nvidia and ATI have really shaken up the 3D market in the past couple of months. While the GeForce GTX 260 and GTX 280 hold a number of speed records (simultaneously making the GeForce 9-series look geriatric), AMD’s Radeon HD 4850 and HD 4870 provide good performance at aggressive prices. We have been seeing prices steadily sliding in the past few weeks. The GTX 280 started at $649, and it can now be purchased for just $419.
To find the best performing and least expensive combination, we put the fastest graphics cards through a series of tests consisting of 60 benchmarks, numerous side-by-side comparisons, and a price analysis.
This story seeks to answer a number of questions. First, is it worth changing from a Radeon HD 3850, HD 3870, or GeForce 8800 GTS 512 to one of these new GPUs? Second, how well do the old GeForce 8800 GTX and 8800 GTS 512 cards hold up? Third, which of the current cards is fastest? Fourth, are the drivers for CrossFire and SLI already well-optimized? Fifth, where can you expect increases in performance? And finally, how fast is the card you want at 1280x1024, 1680x1050, and 1920x1200?
If you’re not sure about the right power supply to drive your graphics setup, we have recommendations for power supply sizes. These should be considered guidelines, as PC configurations differ considerably.
The CPU in our test system reaches its limits here—the Core 2 Extreme X6800 at 2.93 GHz is barely capable of keeping up with current dual-card graphics setups. These twin-configs often show little or no improvement in overall 3D performance. Your resolution of choice often determines whether it is worth purchasing a pair of your favorite cards or if an individual board would be better.
The highlights of our comparison are the factory-overclocked models from MSI. As a result of the faster clock speeds, there is additional performance guaranteed by the manufacturer. Special drivers or tools are unnecessary, as the improved specifications are automatically set in each board’s BIOS. To ensure a fair comparison, each graphics card runs at its normal rate, with a detailed analysis of the overclocking given as an additional feature. All overclocked variations are tested at 1920x1200 pixels with anti-aliasing, and the performance differences over standard clock speeds can be compared directly using the frame rates with percent evaluation.
Get Tom's Hardware's best news and in-depth reviews, straight to your inbox.
Current page: Taxing Modern CPUs With Powerful Graphics
Next Page Comparing The GPUs And Test Setup-
San Pedro Looks like the results for SLI and Crossfire were switched with the single card results. . .Reply -
Duncan NZ Not a bad article, really comprehensive.Reply
My one complaint? Why use that CPU when you know that the test cards are going to max it out? Why not a quad core OC'ed to 4GHz? It'd give far more meaning to the SLI results. We don't want results that we can duplicate at home, we want results that show what these cards can do. Its a GPU card comparason, not a complain about not having a powerful enough CPU story.
Oh? And please get a native english speaker to give it the once over for spelling and grammar errors, although this one had far less then many articles posted lately. -
Lightnix It'd be a good article if you'd used a powerful enough CPU and up to date Radeon drivers (considering we're now up to 8.8 now), I mean are those even the 'hotfix' 8.6's or just the vanilla drivers?Reply -
elbert Version AMD Catalyst 8.6? Why not just say i'm using ATI drivers with little to no optimizations for the 4800's. This is why the CF benchmarks tanked.Reply -
at 1280, all of the highend cards were CPU limited. at that resolution, you need a 3.2-3.4 c2d to feed a 3870... this article had so much potential, and yet... so much work, so much testing, fast for nothing, because most of the results are very cpu limited (except 1920@AA).Reply
-
wahdangun WTF, hd4850 SHOULD be a lot faster than 9600 GT and 8800 GT even tough they have 1Gig of ramReply -
mjam No 4870X2 and 1920 X 1200 max resolution tested. How about finishing the good start of an article with the rest of it...Reply -
I agree, the 4870 X2 should have been in there and should have used the updated drivers. Good article but I think you fell short on finishing it.Reply
-
@pulasky - Rage much? It's called driver issues you dumbass. Some games are more optimised for multicard setups than others, and even then some favour SLi to Crossfire. And if you actually READ the article rather than let your shrinken libido get the better of you, you'll find that Crossfire does indeed work in CoD4.Reply
Remember, the more you know.
