How to manage your Linux resources with Mission Center
Ubuntu we don’t have a problem
Get Tom's Hardware's best news and in-depth reviews, straight to your inbox.
You are now subscribed
Your newsletter sign-up was successful
Ubuntu has a great System Monitor tool already built into the OS. And, there are also a plethora of terminal based alternatives such as htop, bashtop, or just plain ol’ top. These all work great but what if you want to try something different?
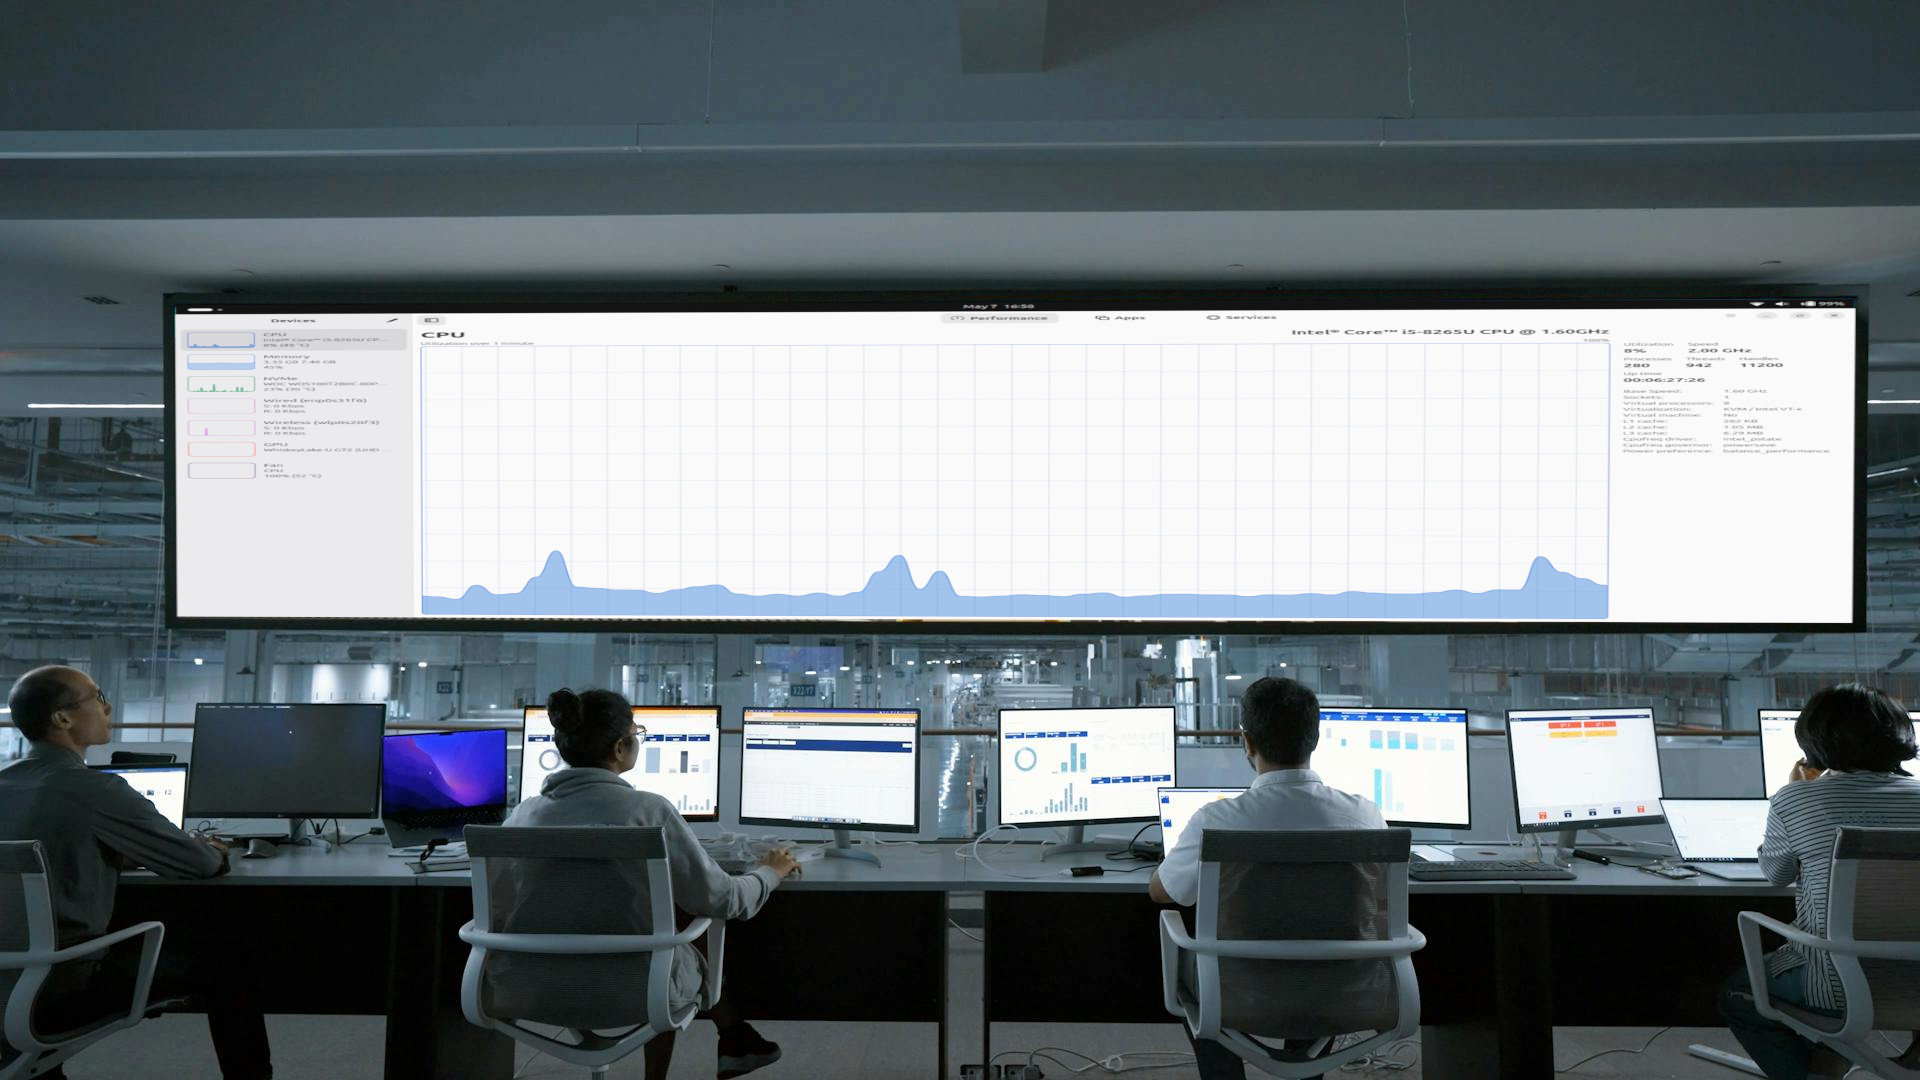
Mission Center, created by Romeo Calota, is a more user-friendly system monitoring tool that covers CPU, GPU, RAM, disks (including SMART functionality), network and fan speeds for Linux machines.
We’ve installed it onto our test machine, an 8th gen Intel Lenovo X390 laptop and we’ll walk you through installation and configuration. The user interface is very “Windows 11” but that is not a backhanded compliment. The UI is clear and easy to use, versus terminal applications which while useful, can be a little overwhelming for new users.
Article continues belowMission Center Key Features
- Monitor overall or per-thread CPU usage
- See system process, thread, and handle count, uptime, clock speed (base and current), cache sizes
- Monitor RAM and Swap usage
- See a breakdown how the memory is being used by the system
- Monitor Disk utilization and transfer rates
- Monitor network utilization and transfer speeds
- See network interface information such as network card name, connection type (Wi-Fi or Ethernet), wireless speeds and frequency, hardware address, IP address
- Monitor overall GPU usage, video encoder and decoder usage, memory usage and power consumption, powered by the popular NVTOP project
- Monitor system fans
- See a breakdown of resource usage by app and process
- Supports a minified summary view for simple monitoring
- Use hardware accelerated rendering for all the graphs in an effort to reduce CPU and overall resource usage
- Uses GTK4 and Libadwaita
- Written in Rust
Installation
There are many ways to install Mission Center on your Linux machine. The Flatpak can be installed via Flathub, there is a self-contained app image release that can be used on many Linux distros. For this how to, we’ll focus on installing a Snap package on Ubuntu 25.04. Snaps are Canonical’s sandboxed application installer which enables apps to talk to the underlying OS, but not make any major changes.
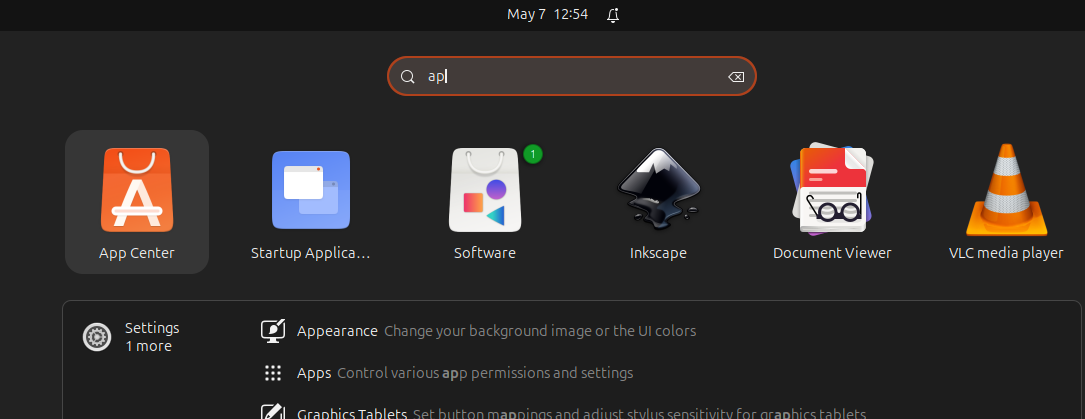
1. Press the Super (Windows) key and search for “app”. Click on the App Center icon.
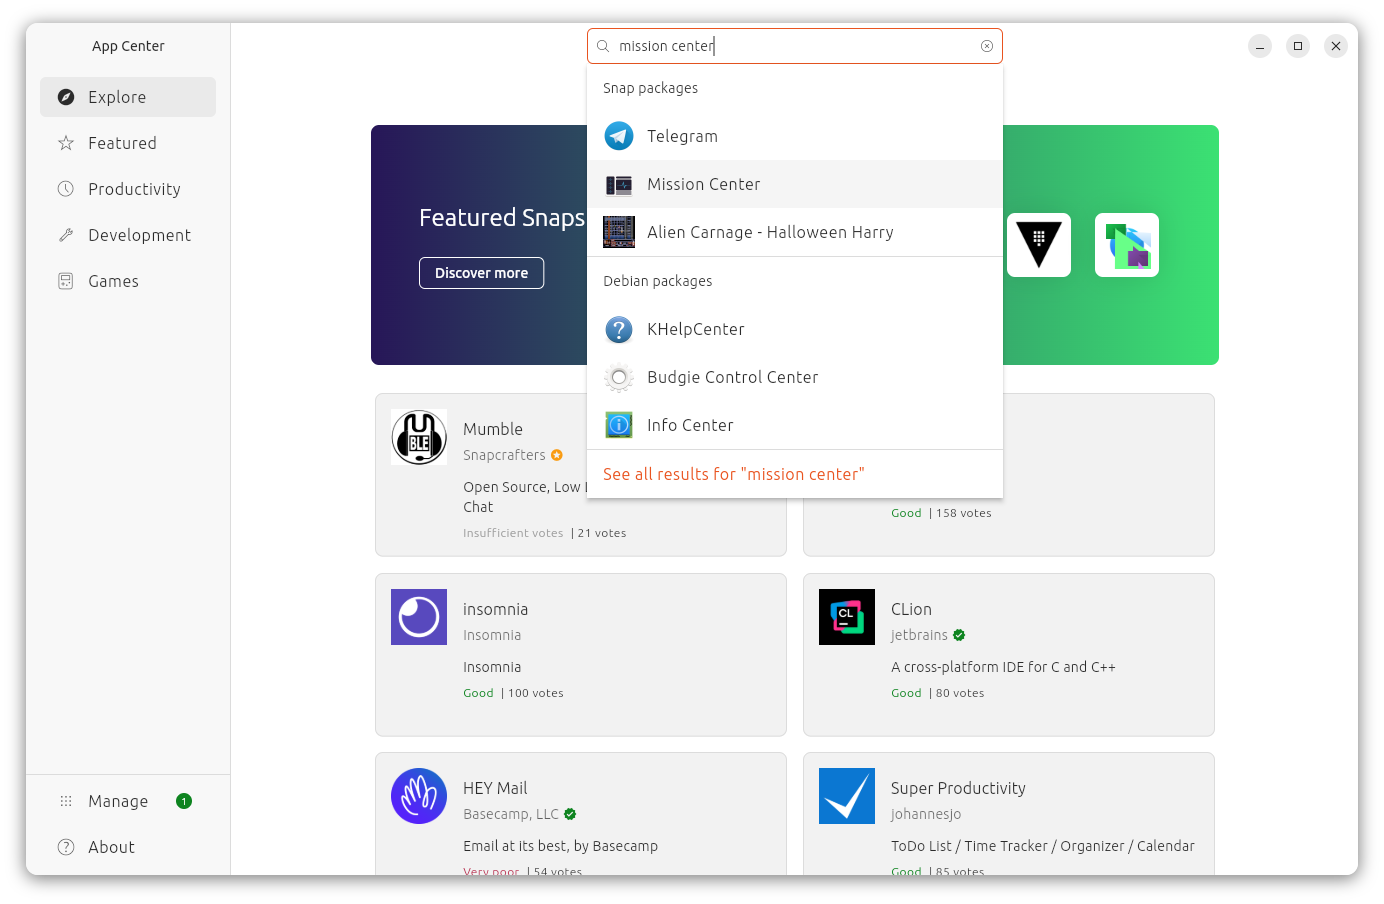
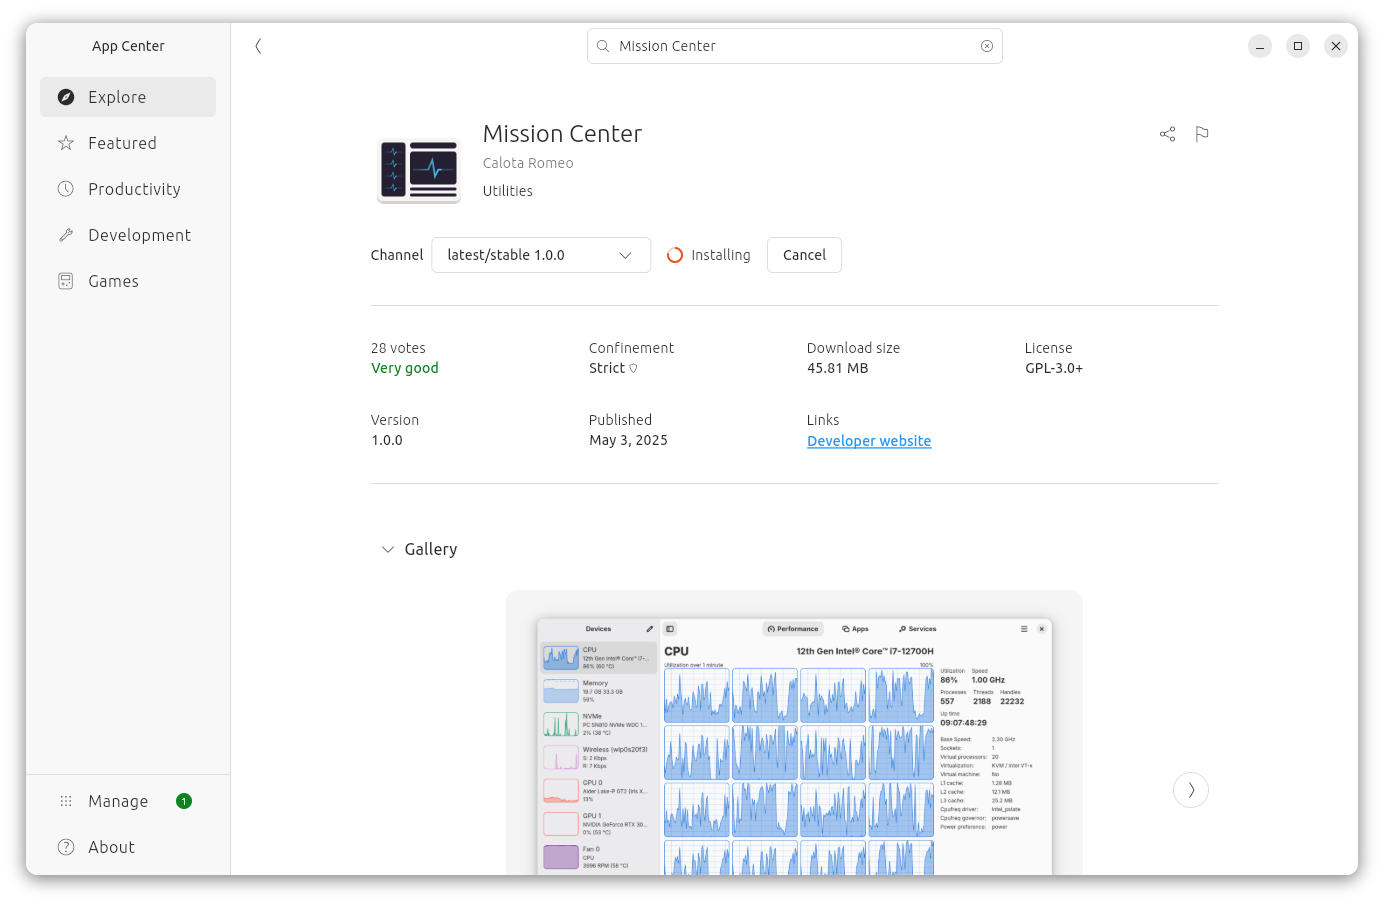
2. Search for Mission Center and select it from the drop down list.
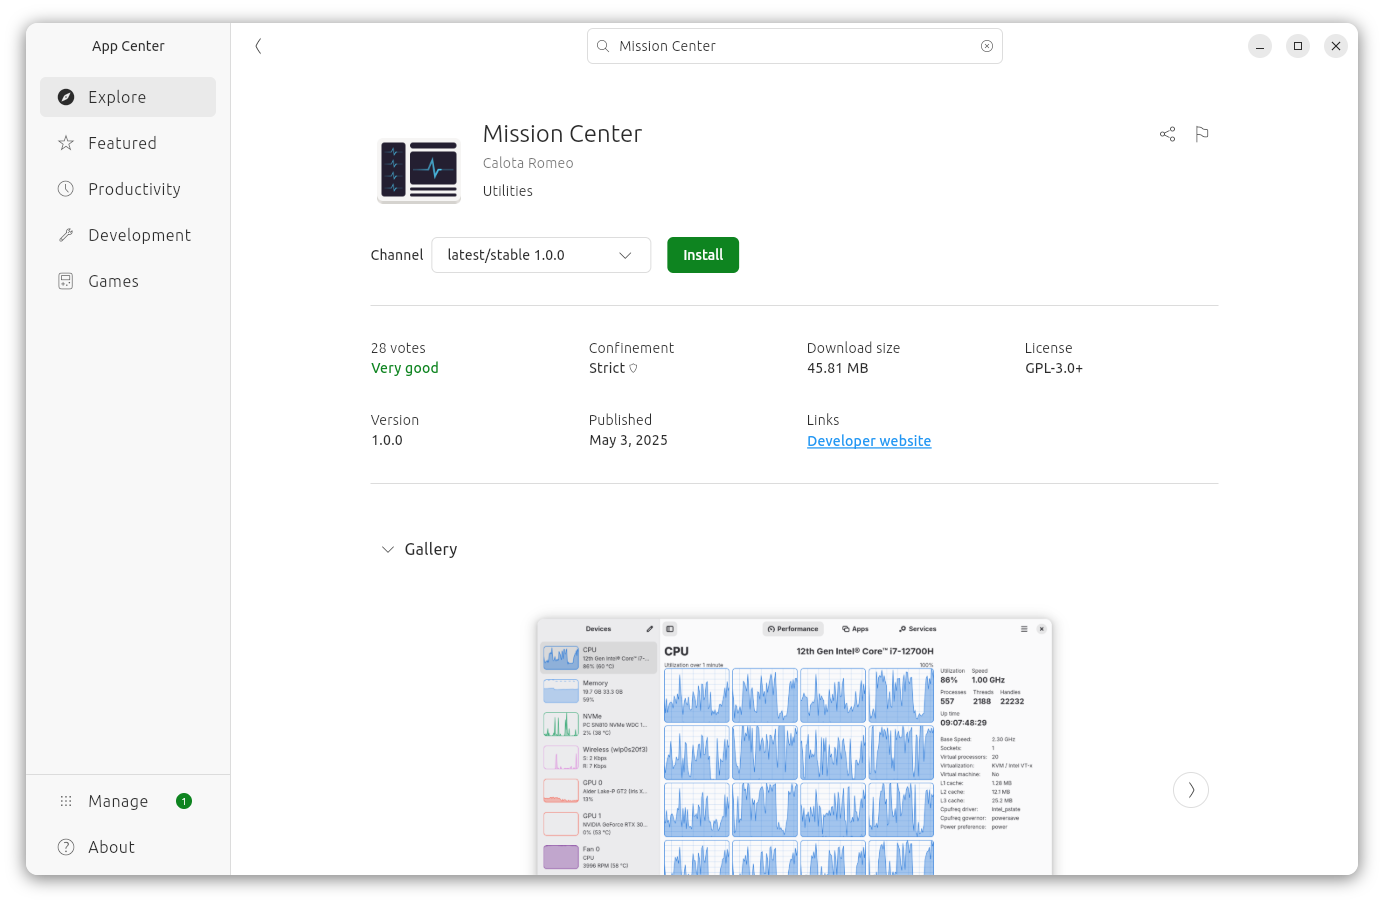
3. Ensuring that the latest stable release is selected, click on Install.
Get Tom's Hardware's best news and in-depth reviews, straight to your inbox.
4. Enter your password to authorize the installation. Installation should take just a few seconds.
5. Close the App Center.
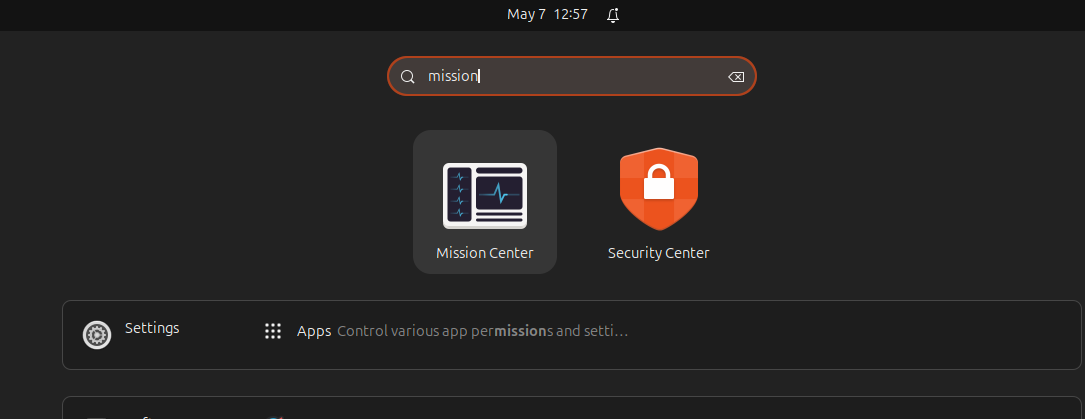
6. Press the Super (Windows) key and search for Mission. Click on the Mission Center icon to run the app.
Those who prefer the terminal can install the Mission Center snap package via the terminal using the following command. When installed, go to step 6 above and launch the app.
sudo apt update
sudo apt install snapd
sudo snap install mission-center
Using Mission Center
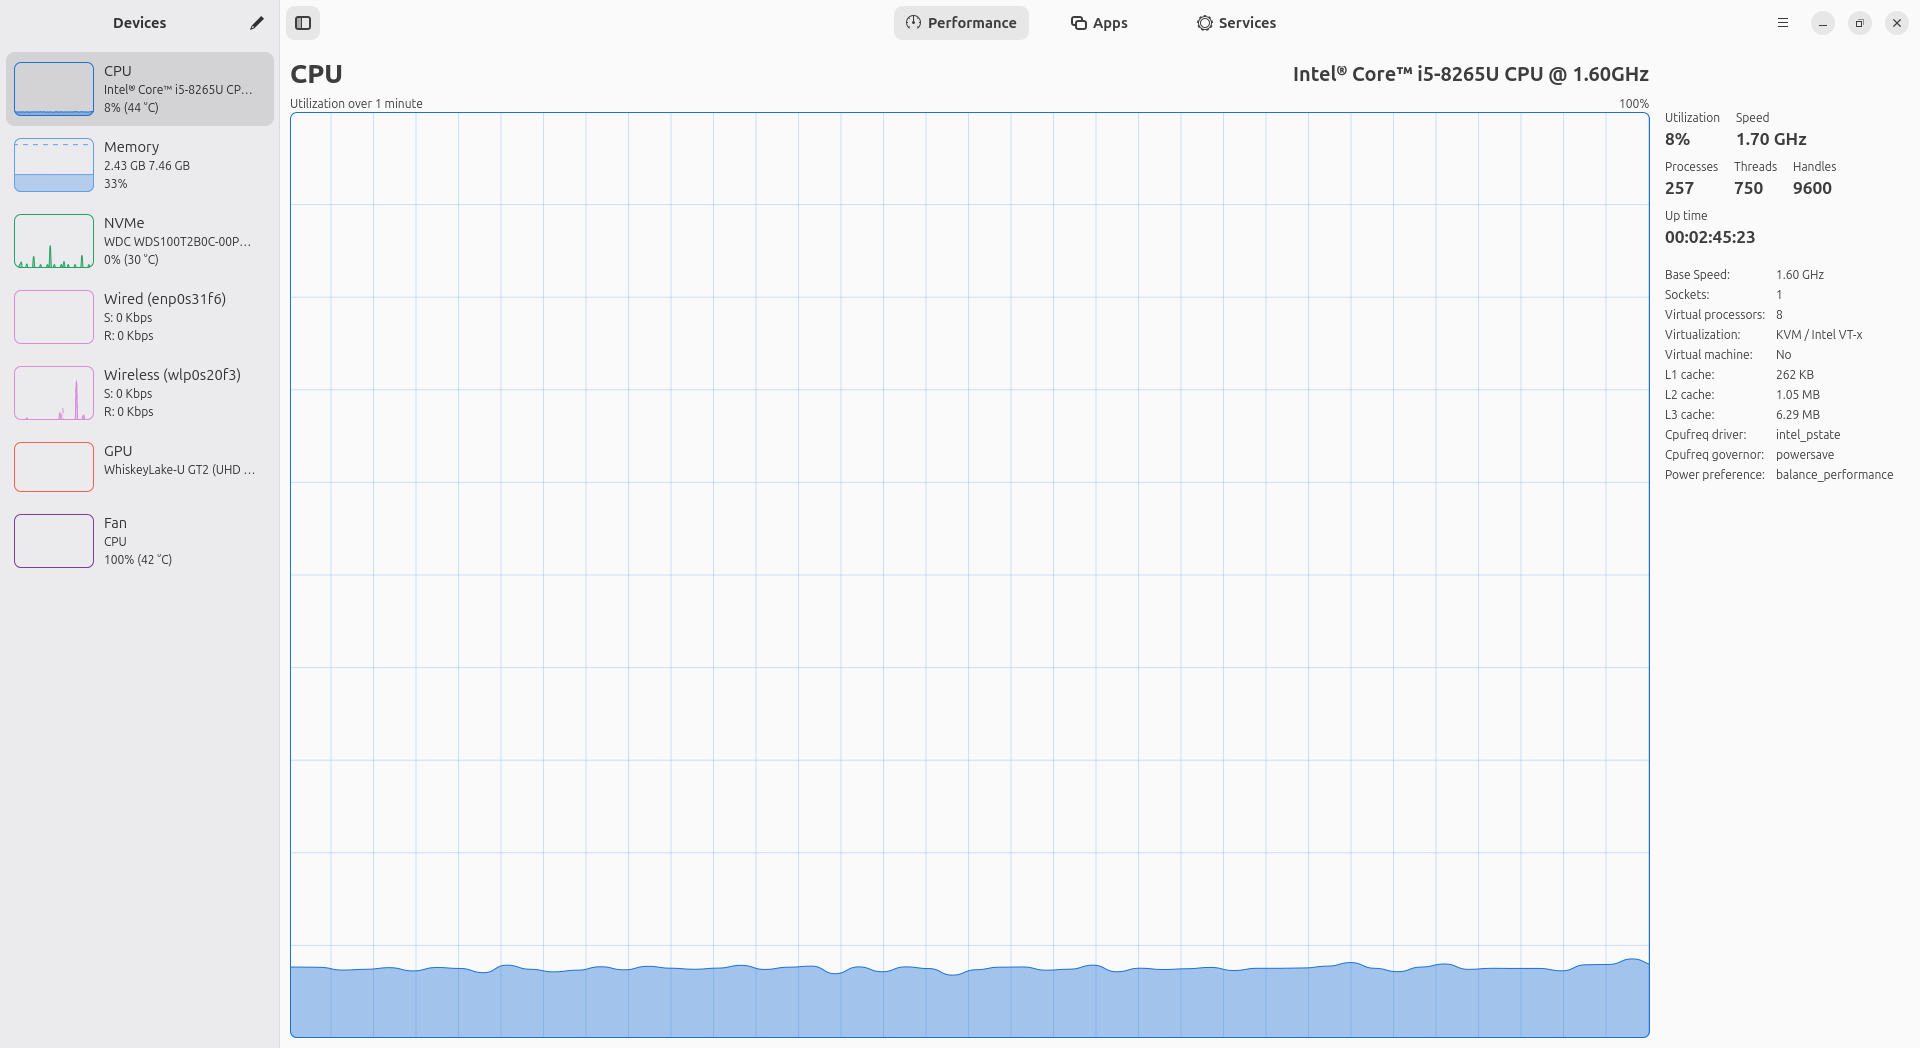
Mission Center, by default, will show all of the attached hardware that it can monitor. In the case of our Lenovo X390 laptop it could see:
- CPU
- RAM
- NVMe SSD
- Wired Networking
- Wi-Fi
- GPU
- CPU Fan Speed
But, if you have the hardware it can also see your Nvidia GPU.
Monitoring Performance
Clicking on each device, found on the left hand side of the app, will show the performance of said device. By default, the graph will update every second but this can be changed.
1. Click on the hamburger icon in the top right corner and select “Preferences”.
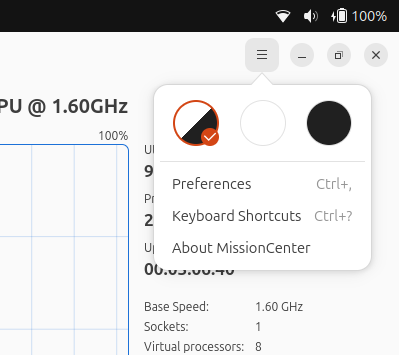
2. Under General (top entry) change the interval as you see fit.
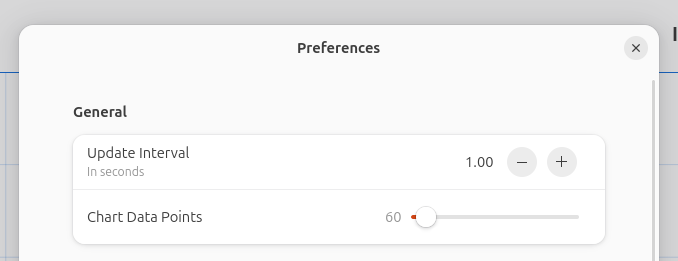
3. Click on the X to close the popup dialog.
The graph should now update according to your interval, but it may appear “jumpy”, if you would prefer a smoother, sliding graph.
1. Click on the hamburger icon in the top right corner and select “Preferences”.

2. Under Performance Page change set Smooth Graphs and Sliding Graphs to On. This will smooth out the lines drawn for the graph, and animate the graph’s progress using a slide.You will see a performance hit though, so enable this at your own risk.
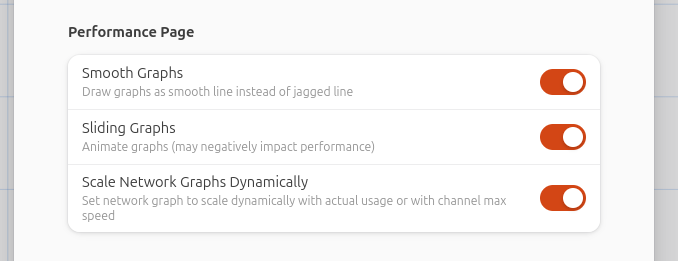
3. Click on the X to close the popup dialog.
App Monitoring
Mission Center can also monitor the running apps and processes. We can see the RAM, CPU and Drive usage of each app and process. And in the same manner as htop or top etc, we can stop or force stop running apps / processes
1. Click on the Apps tab at the top of the Mission Center window.

2. Open another application, we opened Google Chrome.
3. Click on the app in Mission Center. You can click on the dropdown next to the app, this will show all of the running instances for the app.
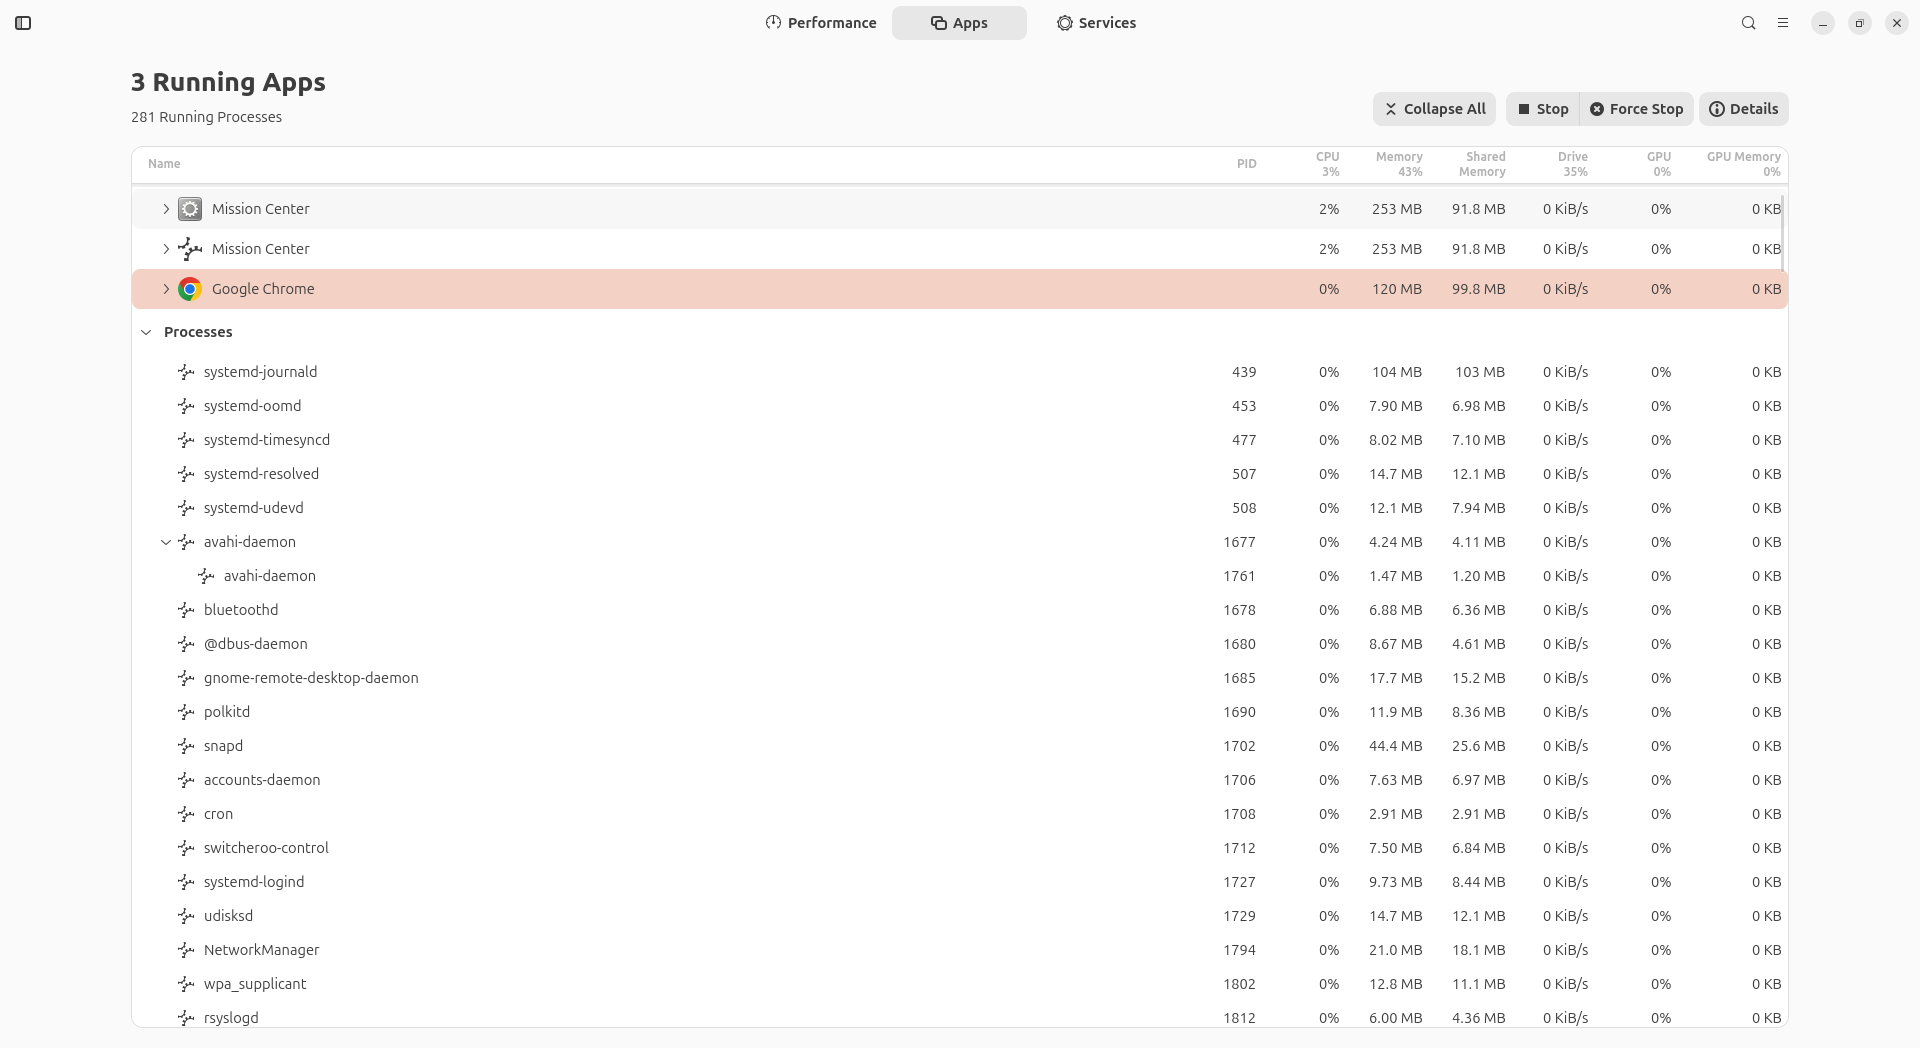
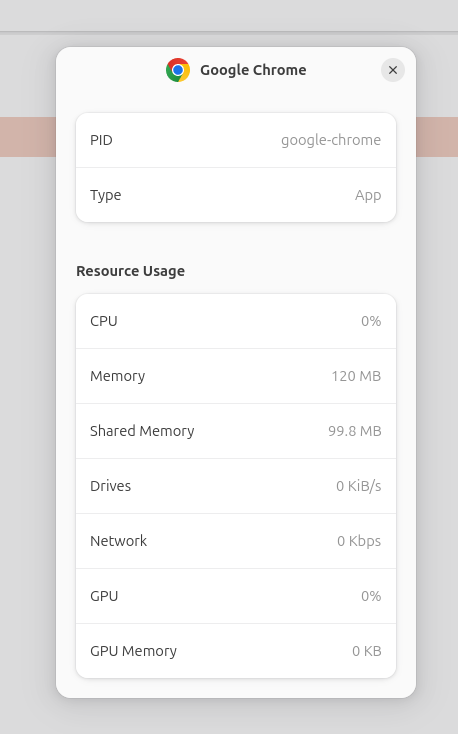
4. Click on Details.
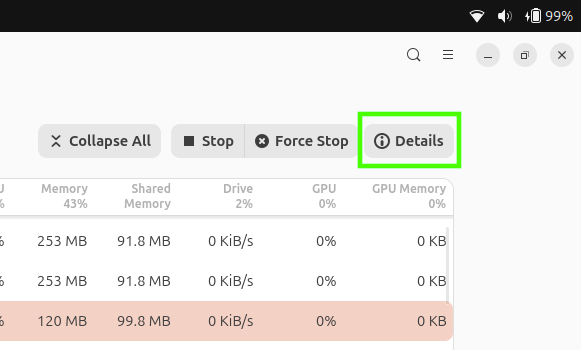
5. The new dialog box will tell you all of the resources used by the app / process. Click on the X to close the dialog.
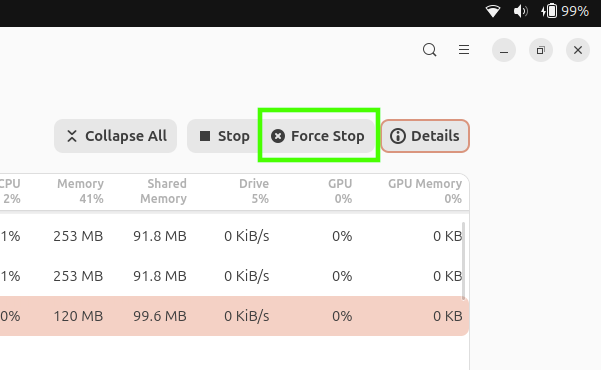
6. In the top right corner, click on Force Stop to close the application (Google Chrome). This will, abruptly, force close the application. It is sudden and quite hostile, so only do this to a real application if it has truly crashed.
Monitoring Services
Mission Center’s third tab shows all of the running services that work behind the scenes. These can be services for Bluetooth, system security and mounting drives. By examining the details of the selected service, we can see who is the owner of the service, its status and enable / disable a service (if we have the correct permissions, or run the application with sudo).
1. Click on the Services tab at the top of the Mission Center window.

2. Select a running service.
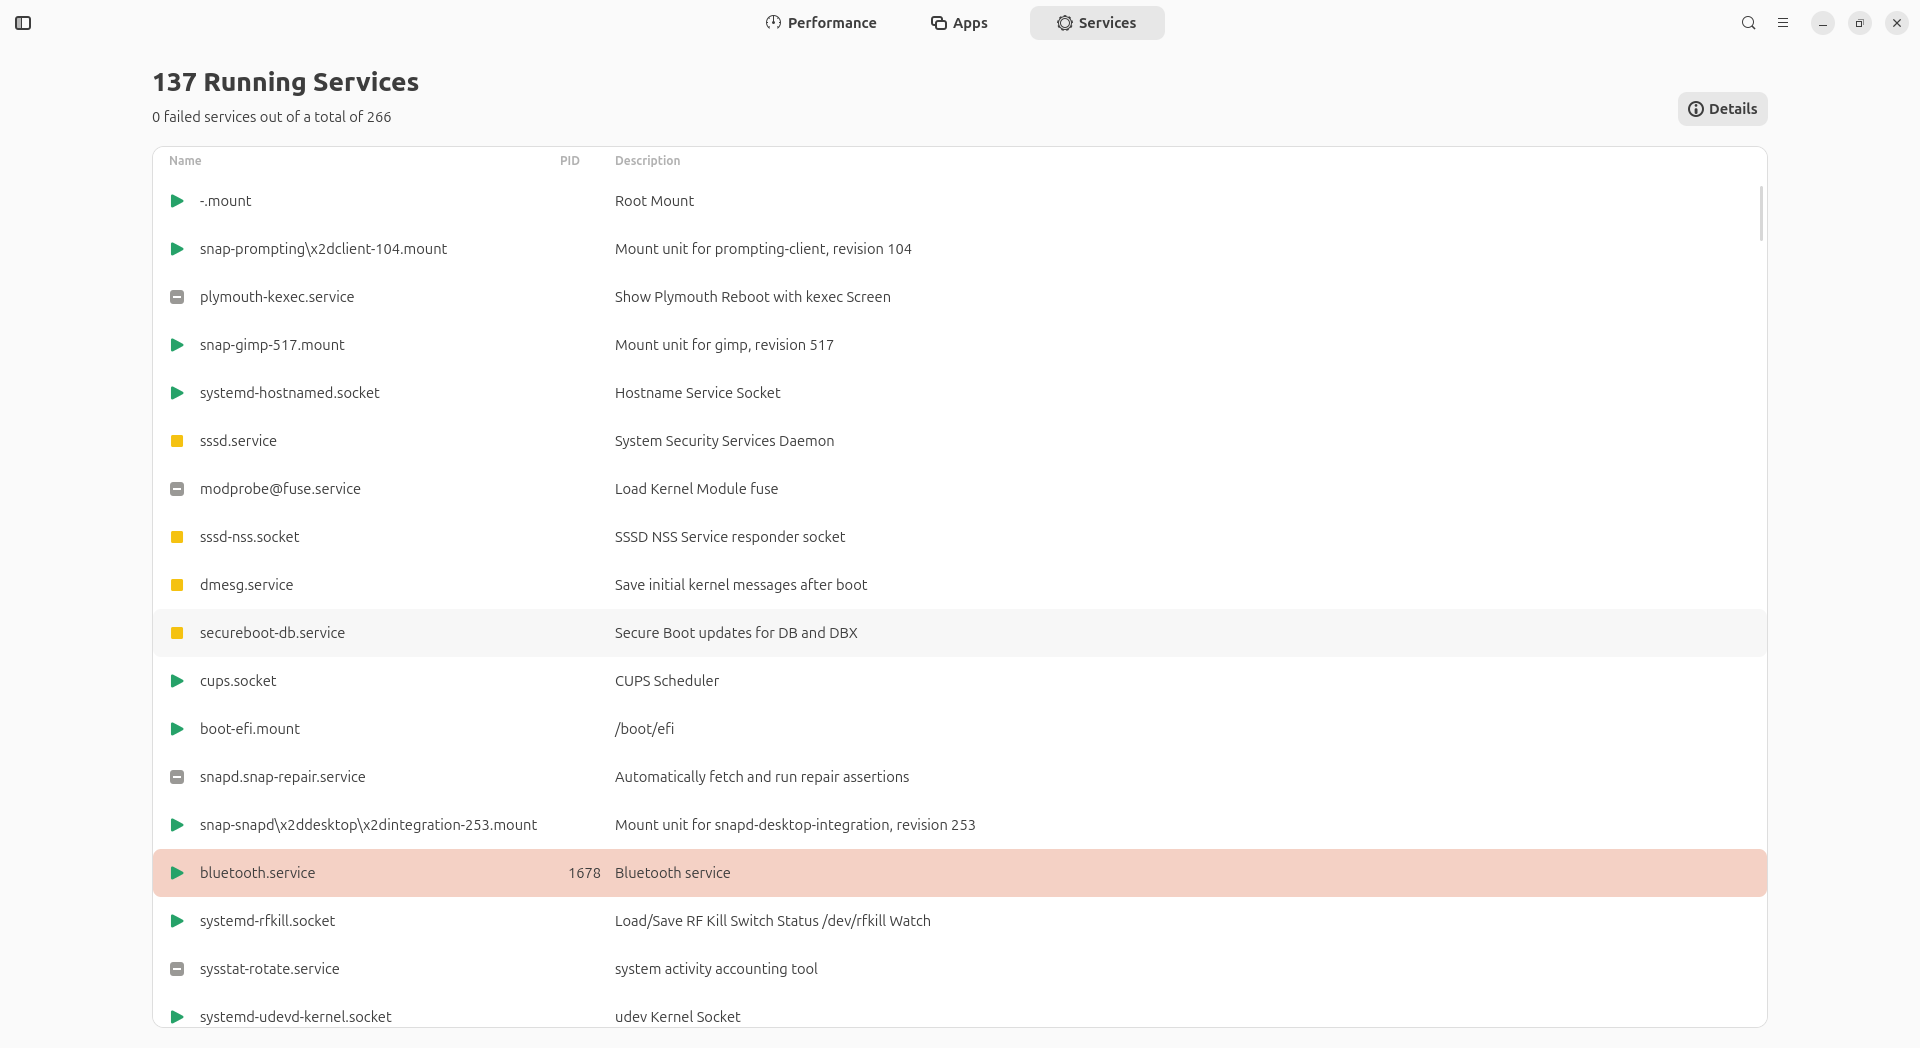
3. Click on Details.
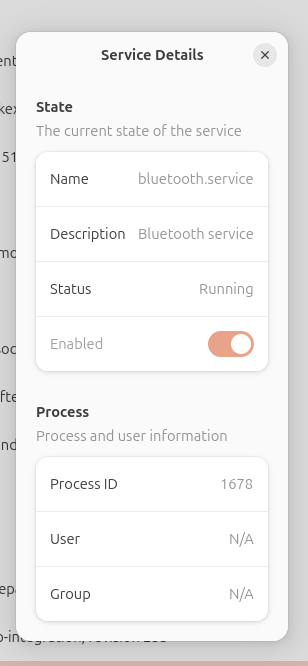
4. Service details are now displayed, including a means to enable / disable a service should you have the permissions to do so. Click on the X to close the dialog.

Les Pounder is an associate editor at Tom's Hardware. He is a creative technologist and for seven years has created projects to educate and inspire minds both young and old. He has worked with the Raspberry Pi Foundation to write and deliver their teacher training program "Picademy".