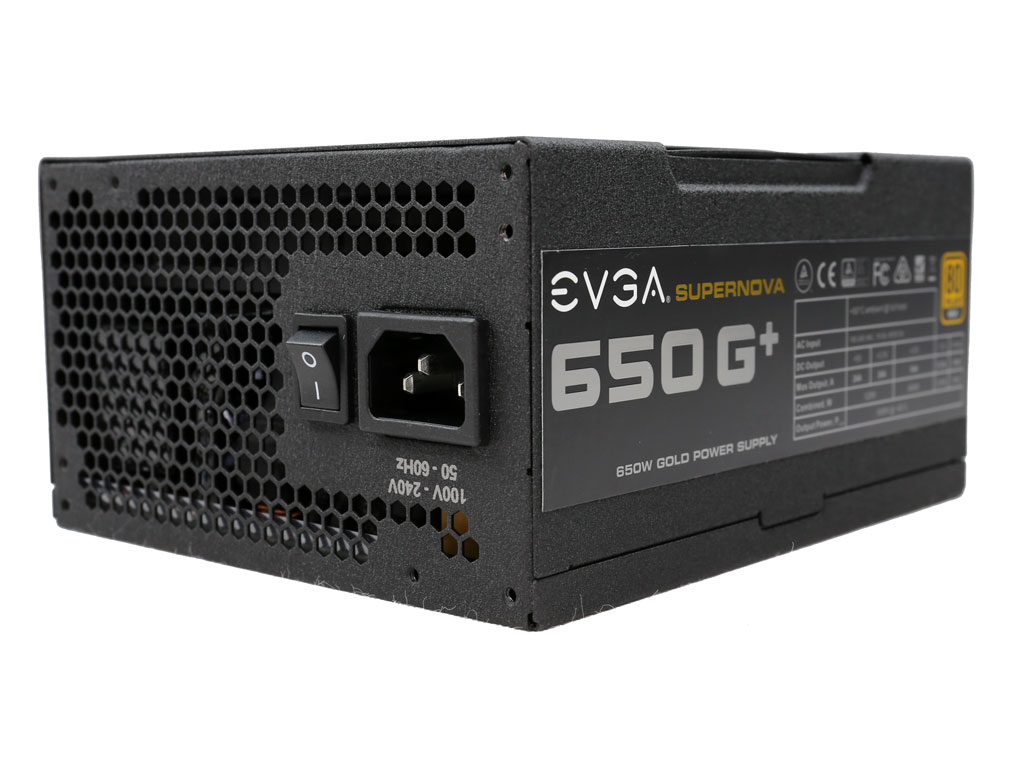
EVGA SuperNOVA 650 G1+ PSU Review: Efficient & Silent
Why you can trust Tom's Hardware
Load Regulation, Hold-Up Time & Inrush Current
To learn more about our PSU tests and methodology, please check out How We Test Power Supply Units.
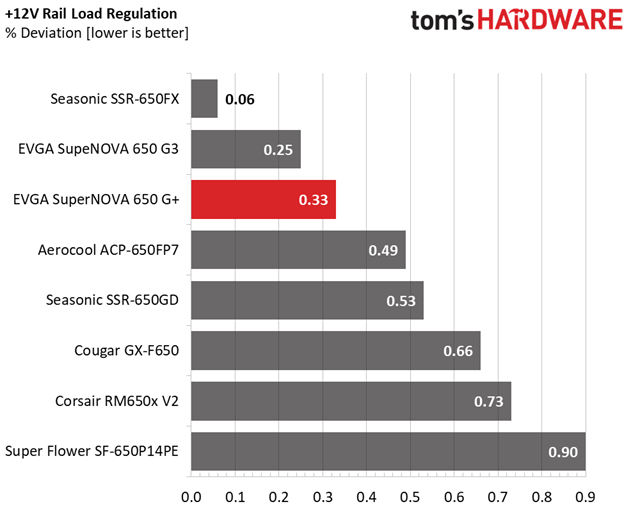
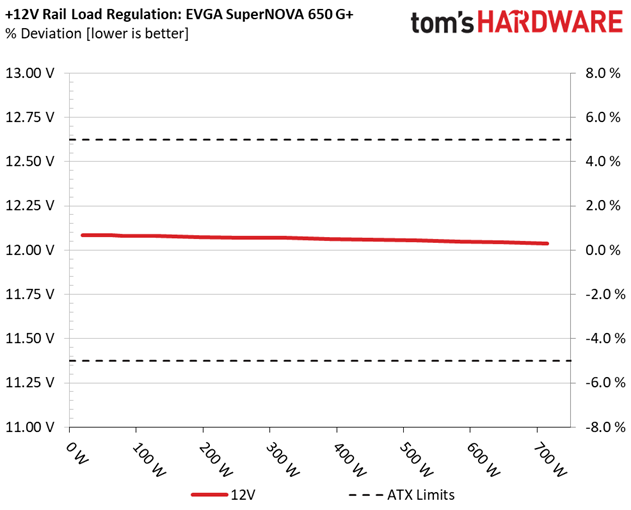
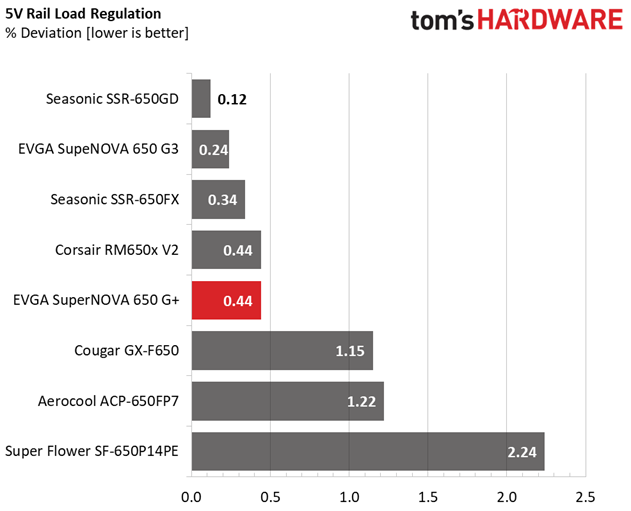
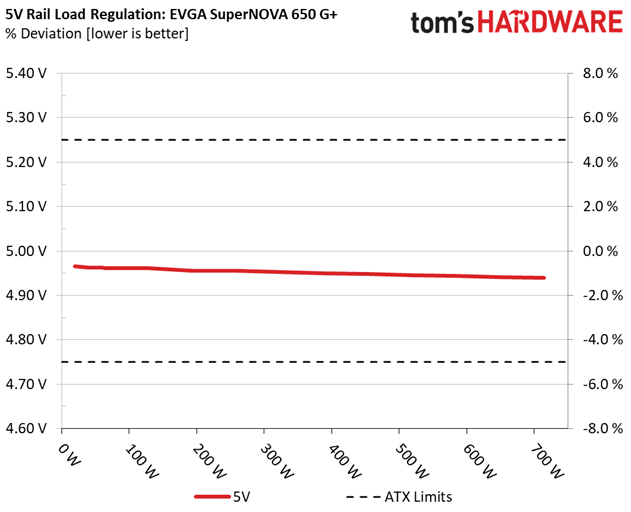
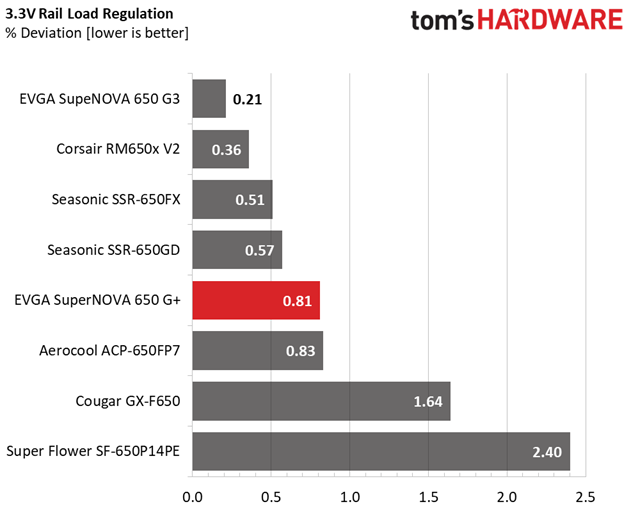
Primary Rails And 5VSB Load Regulation
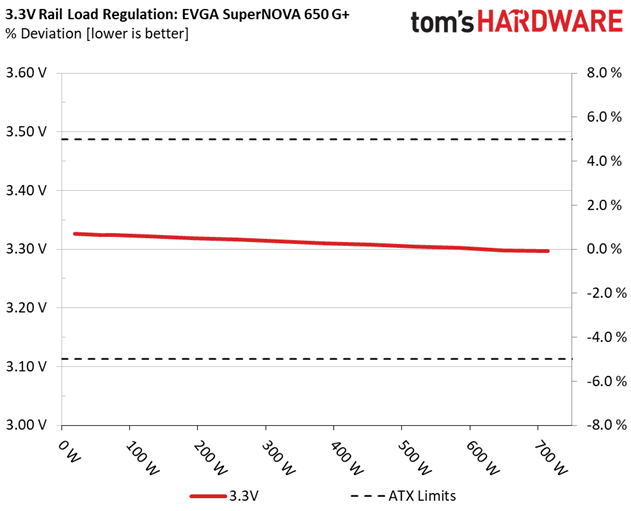
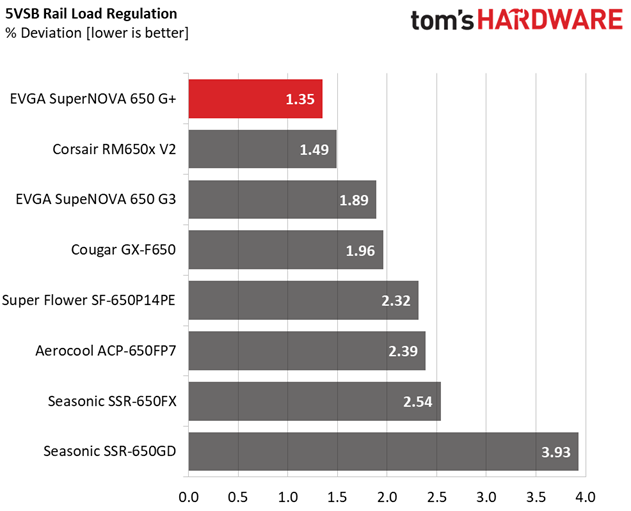
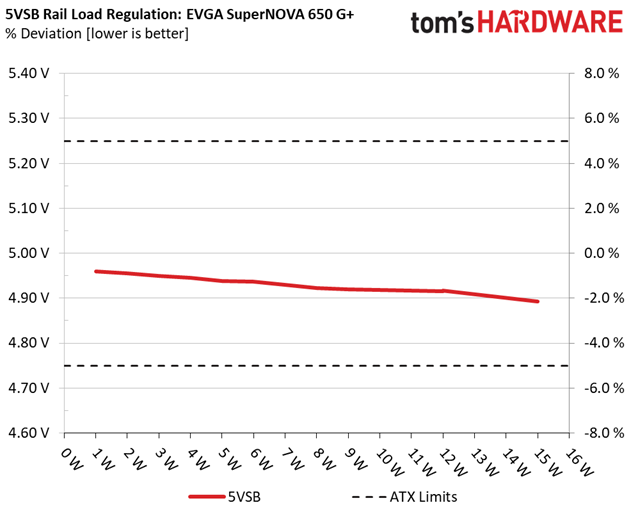
Load Regulation testing is detailed here.
Hold-Up Time
Our hold-up time tests are described in detail here.
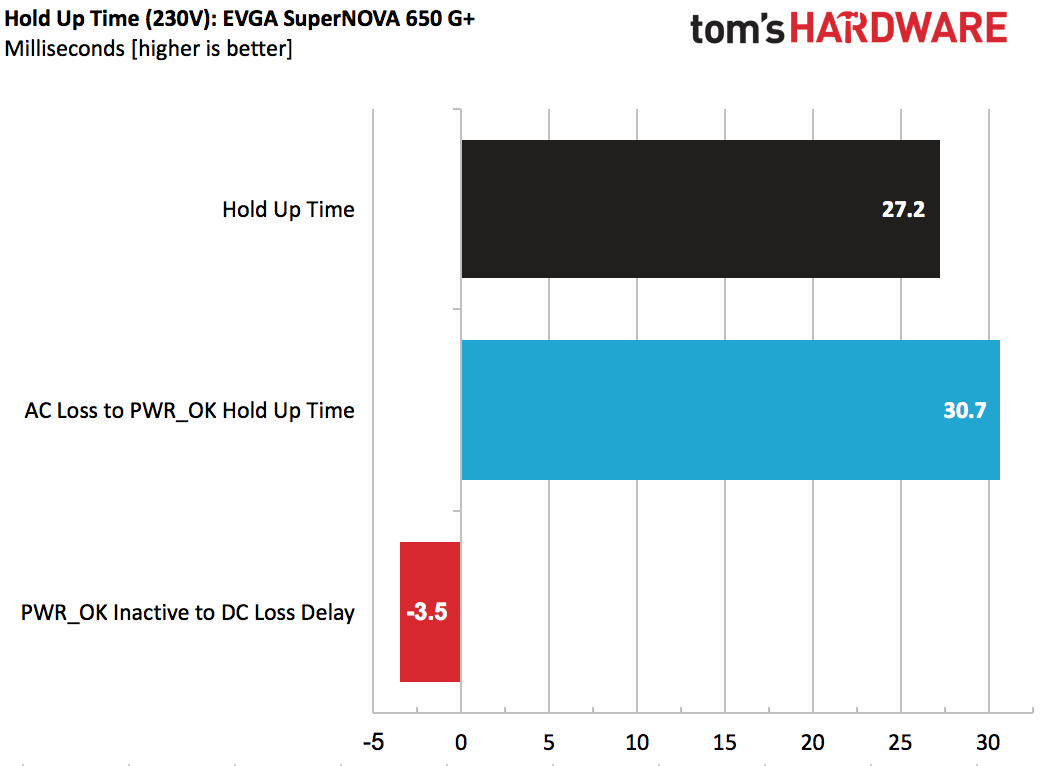
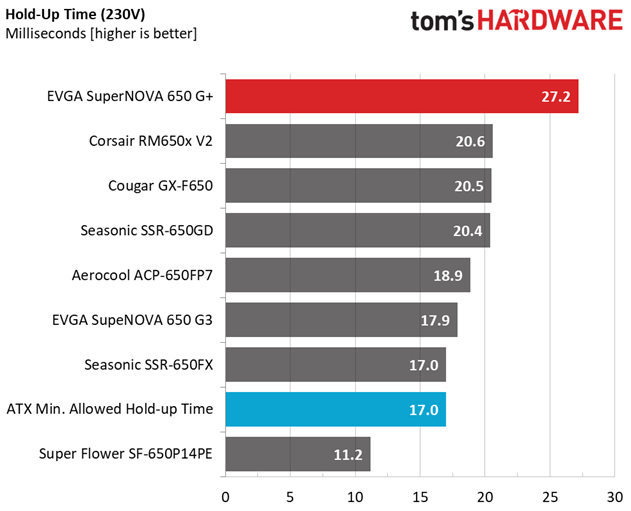
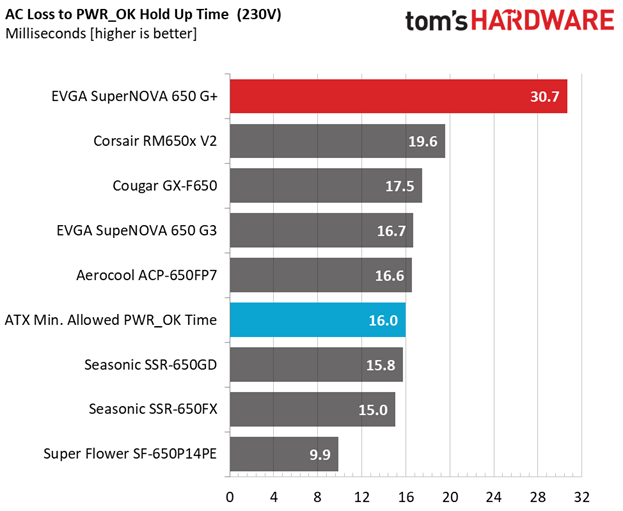
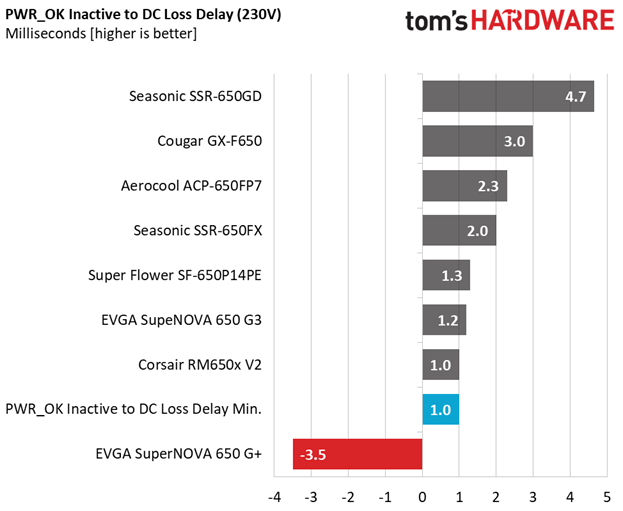
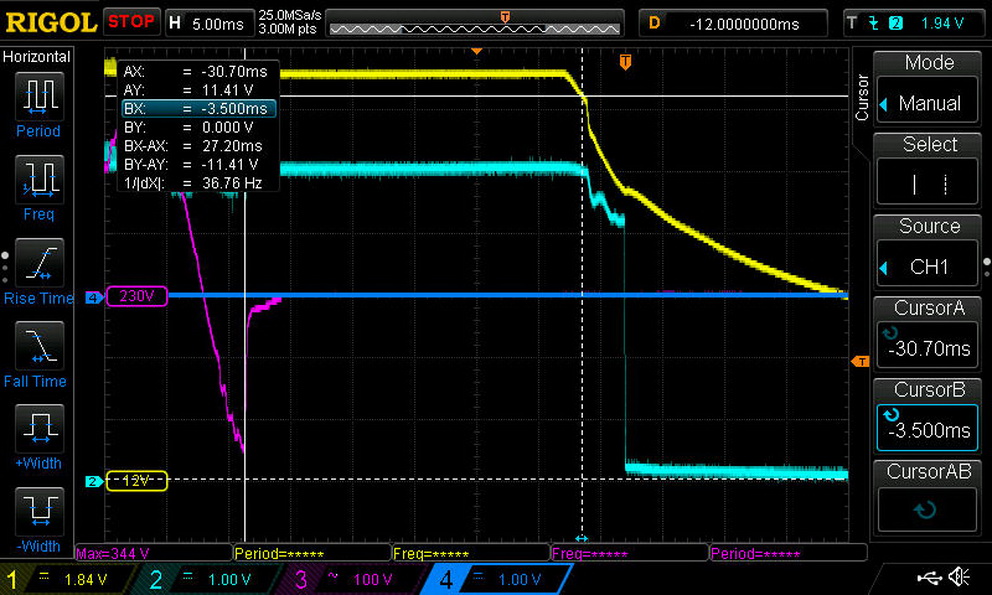
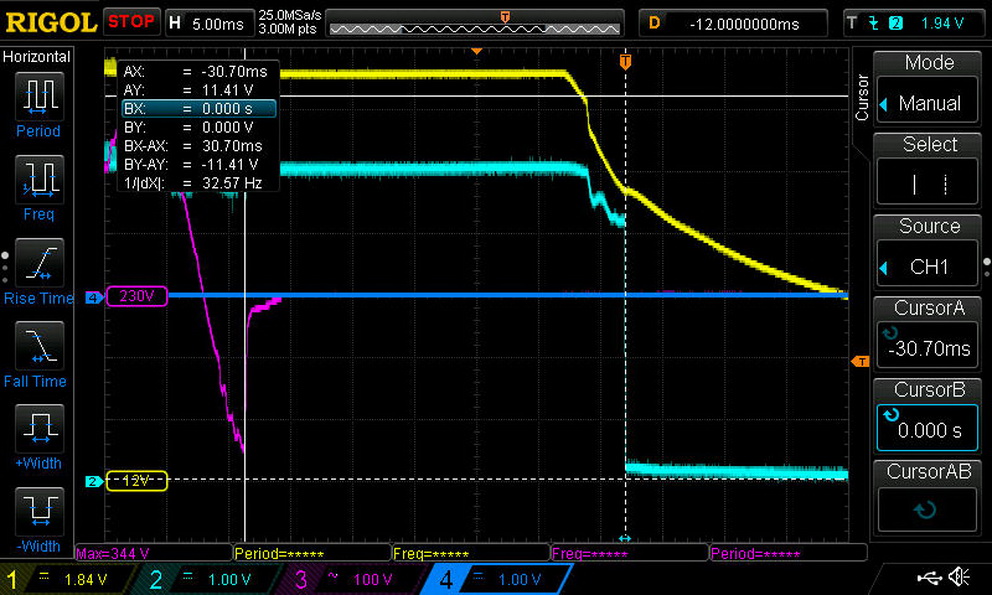
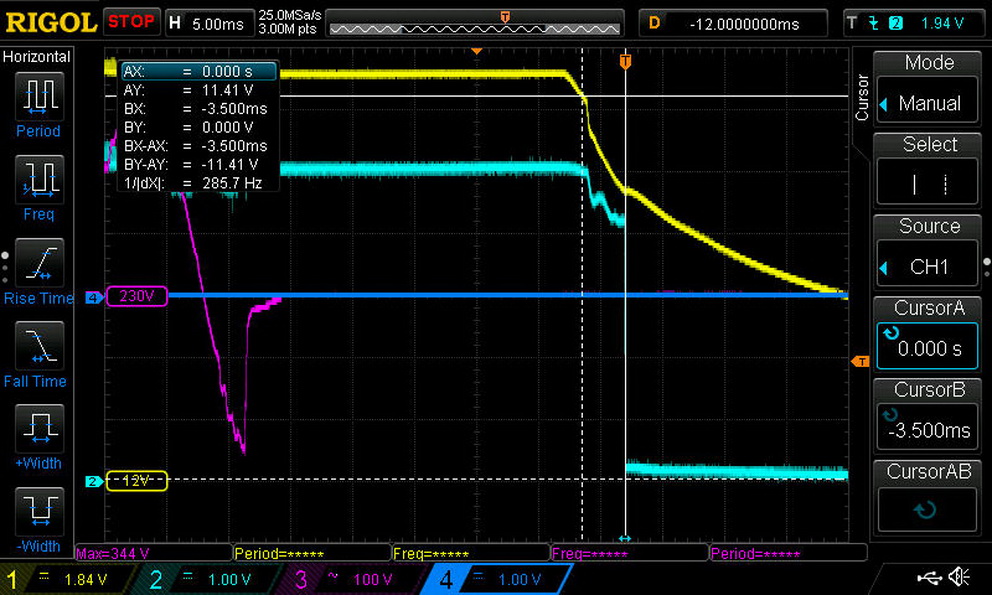
The hold-up time we measured was very long. However, the power-good signal was inaccurate and looked strange in our oscilloscope pictures. There's normally a clean drop in the signal, but that wasn't the case for EVGA's SuperNOVA 650 G1+.
Inrush Current
For details on our inrush current testing, please click here.
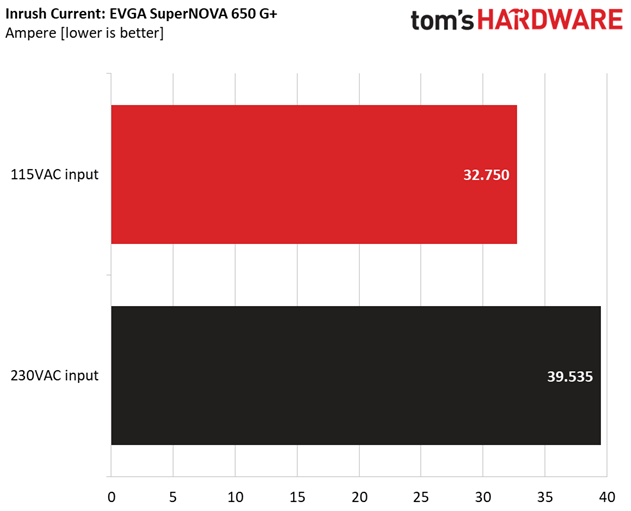
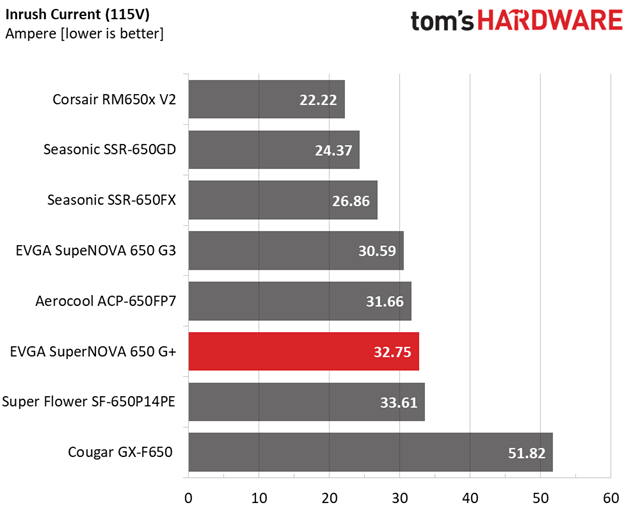
Inrush current is low with both voltage inputs.
Load Regulation And Efficiency Measurements
The first set of tests reveals the stability of the voltage rails and the 650 G1+’s efficiency. The applied load equals (approximately) 10 to 110 percent of the PSU's maximum load in increments of 10 percentage points.
Get Tom's Hardware's best news and in-depth reviews, straight to your inbox.
We conducted two additional tests. During the first, we stressed the two minor rails (5V and 3.3V) with a high load, while the load at +12V was only 0.1A. This test reveals whether a PSU is compatible with Intel's C6/C7 sleep states or not. In the second test, we determined the maximum load the +12V rail could handle with minimal load on the minor rails.
| Test # | 12V | 5V | 3.3V | 5VSB | DC/AC (Watts) | Efficiency | Fan Speed | PSU Noise | Temps (In/Out) | PF/AC Volts |
|---|---|---|---|---|---|---|---|---|---|---|
| 1 | 3.576A | 2.015A | 1.984A | 1.013A | 64.802 | 86.442% | 795 RPM | 18.3 dB(A) | 38.76°C | 0.886 |
| 12.083V | 4.961V | 3.324V | 4.938V | 74.966 | 42.43°C | 115.30V | ||||
| 2 | 8.145A | 3.023A | 2.977A | 1.216A | 129.273 | 90.043% | 790 RPM | 18.3 dB(A) | 39.13°C | 0.938 |
| 12.079V | 4.961V | 3.322V | 4.937V | 143.568 | 43.10°C | 115.22V | ||||
| 3 | 13.115A | 3.531A | 3.462A | 1.421A | 194.357 | 91.281% | 790 RPM | 18.3 dB(A) | 39.64°C | 0.955 |
| 12.075V | 4.956V | 3.319V | 4.929V | 212.921 | 43.95°C | 115.13V | ||||
| 4 | 18.091A | 4.037A | 3.979A | 1.625A | 259.574 | 91.559% | 795 RPM | 18.3 dB(A) | 40.26°C | 0.961 |
| 12.071V | 4.955V | 3.316V | 4.923V | 283.505 | 44.86°C | 115.14V | ||||
| 5 | 22.735A | 5.048A | 4.980A | 1.830A | 324.866 | 91.346% | 790 RPM | 18.3 dB(A) | 40.89°C | 0.965 |
| 12.068V | 4.952V | 3.313V | 4.920V | 355.645 | 46.00°C | 115.05V | ||||
| 6 | 27.323A | 6.061A | 5.980A | 2.034A | 389.395 | 90.902% | 795 RPM | 18.3 dB(A) | 41.85°C | 0.968 |
| 12.063V | 4.950V | 3.310V | 4.918V | 428.366 | 47.46°C | 114.96V | ||||
| 7 | 31.976A | 7.074A | 6.983A | 2.238A | 454.704 | 90.282% | 925 RPM | 22.3 dB(A) | 42.84°C | 0.969 |
| 12.059V | 4.948V | 3.308V | 4.917V | 503.650 | 48.64°C | 114.87V | ||||
| 8 | 36.636A | 8.085A | 7.988A | 2.442A | 520.001 | 89.492% | 1260 RPM | 32.1 dB(A) | 44.15°C | 0.971 |
| 12.054V | 4.946V | 3.305V | 4.915V | 581.057 | 50.34°C | 114.88V | ||||
| 9 | 41.698A | 8.596A | 8.479A | 2.441A | 584.918 | 88.629% | 1500 RPM | 36.9 dB(A) | 45.21°C | 0.971 |
| 12.049V | 4.944V | 3.302V | 4.917V | 659.966 | 51.80°C | 114.78V | ||||
| 10 | 46.500A | 9.108A | 9.003A | 3.066A | 649.742 | 87.574% | 1735 RPM | 42.1 dB(A) | 45.92°C | 0.972 |
| 12.044V | 4.941V | 3.298V | 4.893V | 741.933 | 53.13°C | 114.68V | ||||
| 11 | 51.902A | 9.111A | 9.010A | 3.067A | 714.566 | 86.542% | 1915 RPM | 42.2 dB(A) | 46.76°C | 0.972 |
| 12.039V | 4.940V | 3.297V | 4.892V | 825.686 | 54.34°C | 114.70V | ||||
| CL1 | 0.132A | 14.002A | 13.999A | 0.000A | 117.255 | 81.801% | 1125 RPM | 29.0 dB(A) | 43.43°C | 0.937 |
| 12.075V | 4.945V | 3.316V | 5.060V | 143.342 | 49.29°C | 115.20V | ||||
| CL2 | 54.003A | 1.002A | 0.998A | 1.000A | 663.533 | 87.681% | 1780 RPM | 40.5 dB(A) | 44.53°C | 0.972 |
| 12.043V | 4.951V | 3.301V | 4.919V | 756.760 | 51.75°C | 114.67V |
Load regulation was fairly tight on every rail, and the 650 G1+ easily met the 80 PLUS Gold standard's requirements, even under increased operating temperatures.
Its fan profile was relaxed up through 90% of the PSU's maximum rated load. Only during the full load and overload tests did noise exceed 40 dB(A).
These tests also exposed a significant platform weakness: low PF readings that, even under full load, do not exceed 0.98. Most PSUs achieve >0.99 under the same conditions. Obviously, this PSU's APFC circuit needs tuning in order to perform optimally.
MORE: Best Power Supplies
MORE: How We Test Power Supplies
MORE: All Power Supply Content
Current page: Load Regulation, Hold-Up Time & Inrush Current
Prev Page Teardown & Component Analysis Next Page Efficiency, Temperature & Noise
Aris Mpitziopoulos is a contributing editor at Tom's Hardware, covering PSUs.
-
WINTERLORD i read all your guys articles weather im in the market for new or not and i read that article and almost right off the top the article was killed with oh you can get the g3 for same price hah anyways guess if you hadnt someone woulda been quick to mentionReply -
dunn.md Your review is based on the $110 MSRP. This PSU is currently selling for $69.99 on Amazon. Would you highly recommend this PSU at this significantly lower price point?Reply -
DSzymborski The EVGA G3 650W can be bought for $69.99 also and it's much preferable.Reply
Like about 2/3 of the 850 or so individual PSUs EVGA is selling, I can't figure out exactly who the target market is for this. -
HERETIC-1 Calling this G1 "SUPERNOVA" is a bit on the nose.Reply
These are manufactured by FSP.
EVGA's excellent G2 and G3 SUPERNOVA's are manufactured by SUPERFLOWER.... -
Melon_seed Thank you for the review. I shall drop this off my list. Now its either Superflower leadex II or if I am lucky, Seasonic focus plus.Reply
