Snapdragon 810 Performance Preview
Qualcomm’s first 64-bit SoC is finally here, but swirling rumors about overheating and poor memory performance continue to smolder. Will the Snapdragon 810 burn up our benchmark charts or just go up in smoke?
Results: CPU, Memory, And Web
AnTuTu X
AnTuTu is an Android system benchmark designed to test the performance capabilities of four major aspects of mobile devices: Graphics (encompassing 2D, UI and basic 3D), CPU (fixed, floating-point and threading), RAM (read and write) and I/O (read and write).
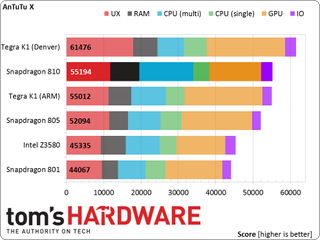
The results for AnTuTu X are sorted based on the overall scores, which are the values shown within the left end of each bar. The overall score is not simply a cumulative value based on the individual test scores. Instead, it’s a separate calculation with its own distinct value. This is why the length of the bars don’t correlate with the overall score.
The AnTuTu GPU test renders onscreen, so the Snapdragon 810's score is weighed down by the MDP tablet's 4K display. Despite this, it still achieves a high overall score thanks to an impressive result in the multi-core CPU tests, outscoring all of the other SoCs. It's a full 66% higher than Snapdragon 805 and 56% higher than the Tegra K1 with Cortex-A15 cores, which have a very similar architecture.
However, in the single-core tests we see a complete reversal. These tests show a strong correlation to CPU clock frequency, which puts the 810 at a disadvantage. The 810 scores 31% lower than the 805 with a 33% slower peak core frequency and 14% lower than the Tegra K1 (ARM) with a 9% slower core frequency. Only Nvidia's Denver CPUs break this trend by posting the highest single-core integer performance (floating-point performance equals the 810).
It's odd to see such a disparity between the single- and multi-core results. The 810 and 805 both have the same peak memory bandwidth, so that isn't a factor. Qualcomm is now using ARM's CCI-400 interconnect in the 810, which is unique amongst the other SoCs in the chart and may give the 810 an advantage in multi-core performance.
AndEBench Pro
AndEBench Pro is produced by The Embedded Microprocessor Benchmark Consortium (EEMBC) and uses carefully designed, low-level algorithms for testing CPU, GPU, memory and storage subsystem performance. The benchmark workload includes XML parsing, data compression, GUI rendering, photo manipulation and cryptography tasks.


Even though AndEBench runs its graphics test onscreen, the 810 still manages to outperform the 805 despite having to render significantly more pixels. The strength of Nvidia's GPUs push the two Tegra platforms ahead of the other SoCs.
Stay on the Cutting Edge
Join the experts who read Tom's Hardware for the inside track on enthusiast PC tech news — and have for over 25 years. We'll send breaking news and in-depth reviews of CPUs, GPUs, AI, maker hardware and more straight to your inbox.
One of the big concerns about the 810 is memory performance. Looking at the Memory Bandwidth test shows that the 810 performs about the same as the 805, which is expected. Memory Latency however, is very low, achieving only about half as many memory operations over the same time interval. This could just be an aberration, since, due to our limited hands-on time, we were only able to run this test once. Let's see if this influences any of our remaining benchmark results.
Basemark OS II Full (Anti-Detection)
Basemark OS II is an all-in-one tool designed for measuring overall performance of mobile devices. It scores each device in four main categories: System, Memory, Graphics and Web. The System score reflects CPU and memory performance, specifically testing integer and floating-point math, along with single- and multi-core CPU image processing using a 2048x2048, 32-bit image. Measuring the transfer rate of the internal NAND storage (Memory) is done by reading and writing files with a fixed size, files varying from 65KB to 16MB, and files in a fragmented memory scenario. Calculating the Graphics score involves mixing 2D/3D graphics inside the same scene, applying several pixel shader effects and displaying 100 particles with a single draw call to test GPU vertex operations. The benchmark is rendered at 1920x1080 off-screen 100 times before being displayed on-screen. Finally, the Web score stresses the CPU by performing 3D transformations and object resizing with CSS, and also includes an HTML5 Canvas particle physics test.
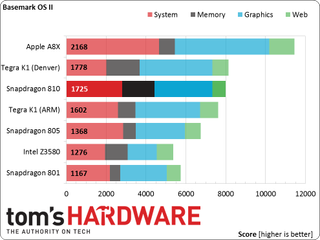
In the CPU- and memory-centric System test, the 810 and 805 essentially tie for the second highest score. The 810 also manages to outscore the 805 by 17% in the Graphics test, but falters in the Web test, posting the lowest overall score (18% lower than the 805 and about 2x slower than the A8X).
Geekbench 3 Pro
Primate Labs' Geekbench offers a wide selection of cross-platform compatibility, with apps available for Windows, OS X, Linux, iOS and Android. This simple system benchmark produces two sets of scores: single- and multi-threaded. For each, it runs a series of tests in three categories: Integer, Floating Point and Memory. The individual results are used to calculate category scores, which, in turn, generate overall Geekbench scores.
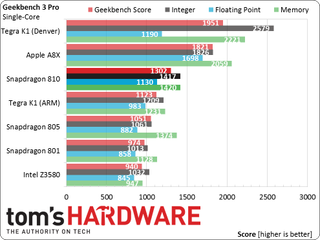
Unlike the AnTuTu single-core CPU test, where the 810 fell behind the 805 primarily due to clock speed, the 810 scores 24% higher than the 805 overall. However, it still trails the higher IPC architectures (A8X and Denver) considerably.
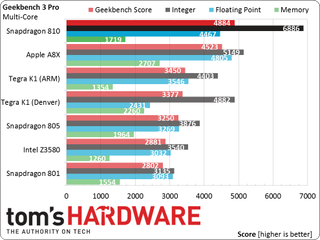
With fewer cores, both A8X (3-core) and Tegra K1 (Denver 2-core) see their IPC advantage diminish in the multi-core tests. The top performer, just like in the AnTuTu multi-core tests, is the Snapdragon 810, posting the best Integer score and second highest Floating Point score. Compared to it's predecessor, the 810 scores 78% better on the Integer tests and 37% better on the Floating Point tests. To better see where the 810 is gaining its advantage, let's look at the individual Integer test scores in the table below.
Geekbench 3 Pro Integer Results
| Test | Snapdragon 810 | Tegra K1 (ARM) | Snapdragon 805 | % Diff (810 / 805) |
|---|---|---|---|---|
| AES (single-core) | 638 | 90 | 93 | 586% |
| AES (multi-core) | 3567 | 299 | 372 | 859% |
| Twofish (single-core) | 1602 | 1358 | 1717 | -7% |
| Twofish (multi-core) | 7588 | 4925 | 6749 | 12% |
| SHA1 (single-core) | 4155 | 2081 | 1841 | 126% |
| SHA1 (multi-core) | 29235 | 8283 | 7238 | 304% |
| SHA2 (single-core) | 1923 | 2321 | 2206 | -13% |
| SHA2 (multi-core) | 9437 | 9127 | 7860 | 20% |
| BZip2 Compress (single-core) | 1261 | 1117 | 1070 | 18% |
| BZip2 Compress (multi-core) | 5088 | 4042 | 3821 | 33% |
| JPEG Compress (single-core) | 1269 | 1290 | 1381 | -8% |
| JPEG Compress (multi-core) | 6255 | 5337 | 5684 | 10% |
| JPEG Decompress (single-core) | 1451 | 1607 | 1162 | 25% |
| JPEG Decompress (multi-core) | 7148 | 5970 | 3841 | 86% |
| Sobel (single-core) | 1404 | 1623 | 974 | 44% |
| Sobel (multi-core) | 6487 | 5961 | 3739 | 74% |
| Lua (single-core) | 1475 | 1436 | 970 | 52% |
| Lua (multi-core) | 6521 | 5682 | 3671 | 78% |
| Dijkstra (single-core) | 941 | 1401 | 1191 | -21% |
| Dijkstra (multi-core) | 3984 | 3886 | 4211 | -5% |
The 805 does outperform the 810 by a small margin in a few of the single-core tests primarily due to its clock speed advantage. However, the 810 shows impressive gains in nearly every test, especially when using multiple cores. The big standouts are AES and SHA1 encryption, which see very large performance gains thanks to the additional SIMD cryptography instructions included in AArch64.
Also included in the table above are the results for the ARM version of Tegra K1 using the Cortex-A15 cores. The new 64-bit A57 clearly outperforms its 32-bit cousin. Tegra K1 even has a slightly higher clock speed, although Snapdragon 810 benefits from higher memory bandwidth and a different processor interconnect.
| Geekbench 3 Pro Memory Bandwidth | ||||
|---|---|---|---|---|
| Row 0 - Cell 0 | STREAM Copy (single-core | multi-core) | STREAM Scale (single-core | multi-core) | STREAM Add (single-core | multi-core) | STREAM Triad (single-core | multi-core) |
| Snapdragon 801 | 1830 | 2143 | 1099 | 1570 | 887 | 1320 | 1093 | 1514 |
| Snapdragon 805 | 1617 | 2344 | 1360 | 2066 | 1180 | 1685 | 1376 | 1824 |
| Snapdragon 810 | 1626 | 1947 | 1570 | 1916 | 1253 | 1509 | 1272 | 1554 |
The table above shows the results for the STREAM memory bandwidth test. When we benchmarked a pre-production device running Snapdragon 810 there was a significant performance deficit in this test, since the memory bus was running at half speed. Comparing the values for the 805 and 810 now, which should be similar as they both have the same peak theoretical bandwidth, it's clear that the 810's memory bus is running at full speed. It's also clear that there aren't any memory performance issues based on this test, with the 810 a little faster than the 805 in some cases. The 810's multi-core values due trail the 805 by 8% to 20%; however, this doesn't seem to have an adverse impact on overall performance based on the 810's excellent multi-core performance.
Browsermark 2.1
Rightware's Browsermark 2.1 is a synthetic browsing benchmark that tests several performance metrics, including load time, CSS, DOM, HTML5 Canvas, JavaScript and WebGL.
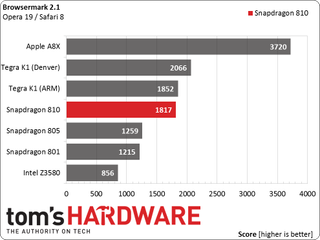
Snapdragon 810 performs well in Browsermark, leading the 805 by 44%. It performs on par with the A15 cores in Tegra K1, which makes sense considering web benchmarks aren't usually memory bandwidth limited and the older version of Opera we are using isn't 64-bit, nullifying any advantage the 810 might get from AArch64.
Google Octane 2.0
Google Octane is a JavaScript benchmark that runs a variety of demanding tests, including cryptography, ray tracing, parsing, compiler and garbage collection latency, string and array processing, and various math routines.
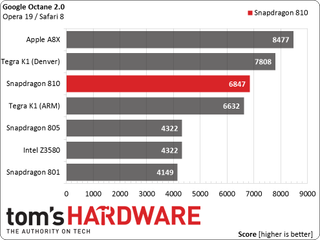
The results for Octane are similar to Browsermark, with the 810 outperforming the 805 by 58% and finishing just ahead of Tegra K1 (ARM).
Now that we've had a good look at CPU and memory performance, let's turn our attention to the 810's Adreno 430 GPU.
-
realjjj In Geekbench your result is by far the highest in the database , something is off there, it's overclocked or you are testing in a fridge or you got some new revision.What's certain is that something is way off.Reply -
MobileEditor ReplyIn Geekbench your result is by far the highest in the database , something is off there, it's overclocked or you are testing in a fridge or you got some new revision.What's certain is that something is way off.
The 810 scores lower than both the Tegra K1 (Denver) and A8X in Geekbench single-core and 8% better than the A8X in multi-core. Looking at the table for the individual Integer test results shows that most of the 810's advantage is in the AES and SHA1 encryption tests, which AArch64 targets with new instructions, as I noted in the article.
I used Geekbench 3 Pro v3.3.1 (as noted on the "Testing" page) and I definitely didn't test it in a fridge :) It was standing on a conference room table like shown in the picture on the "Testing" page.
- Matt -
MrCommunistGen "With only half as many cores, both A8X and Tegra K1 (Denver) see their IPC advantage diminish in the multi-core tests"Reply
A8X is a tri-core CPU. -
airborn824 This does not seem very promising at all. At this rate i am stuck with my S4 this year. I wont upgrade with such a small performance increase.Reply -
MobileEditor Reply"With only half as many cores, both A8X and Tegra K1 (Denver) see their IPC advantage diminish in the multi-core tests"
A8X is a tri-core CPU.
Doh! I was still thinking A8. That's what happens when writing at 4am with no sleep. I'll fix that.
- Matt
-
MobileEditor Replyhow efficient is it?
If you're referring to Tegra X1, Nvidia claims between 5W-10W depending on application (tablet or car). We can't verify these claims since there aren't any shipping products yet and nobody outside of Nvidia has even been able to touch it.
For the 810, we weren't given enough time to test battery life. We need to wait until products ship. With the 810 moving to 20nm and the fact that the Krait CPUs were pushed to their max frequency, I wouldn't be surprised to see the 810 use less power than the 805 for average tablet workloads. The Adreno 430 might use a little more power than 420 though.
- Matt -
JeanLuc Are you checking to see if any of the devices are deliberately 'turboing/boosting' clockrates when certain benchmarks are run?Reply
Most Popular

