How To Monitor CPU and RAM Resources in Any Linux Distro
Keep your Linux systems CPU and RAM in check with these handy commands
Whether we’re using a Raspberry Pi or a data center server, we need to know how our CPU and RAM are performing and, in Linux, there are a plethora of commands and applications that we can use. At the basic low level “How much RAM have I used?” to inspecting the CPU for vulnerabilities such as Spectre, there are commands at our disposal.
We are going to look at a number of different ways to get RAM and CPU data in the terminal, before we finally look at two applications which can provide a basic level of assurance, at a glance.
These commands will work on most Linux machines. Our test PC is running Kubuntu, the KDE flavor of Ubuntu, but we also certain that you can also run through this how-to on a Raspberry Pi or any other Linux device. All of the how-to is performed via the Terminal.
Article continues belowHow to Check Your CPU in Linux
1. Open a terminal.
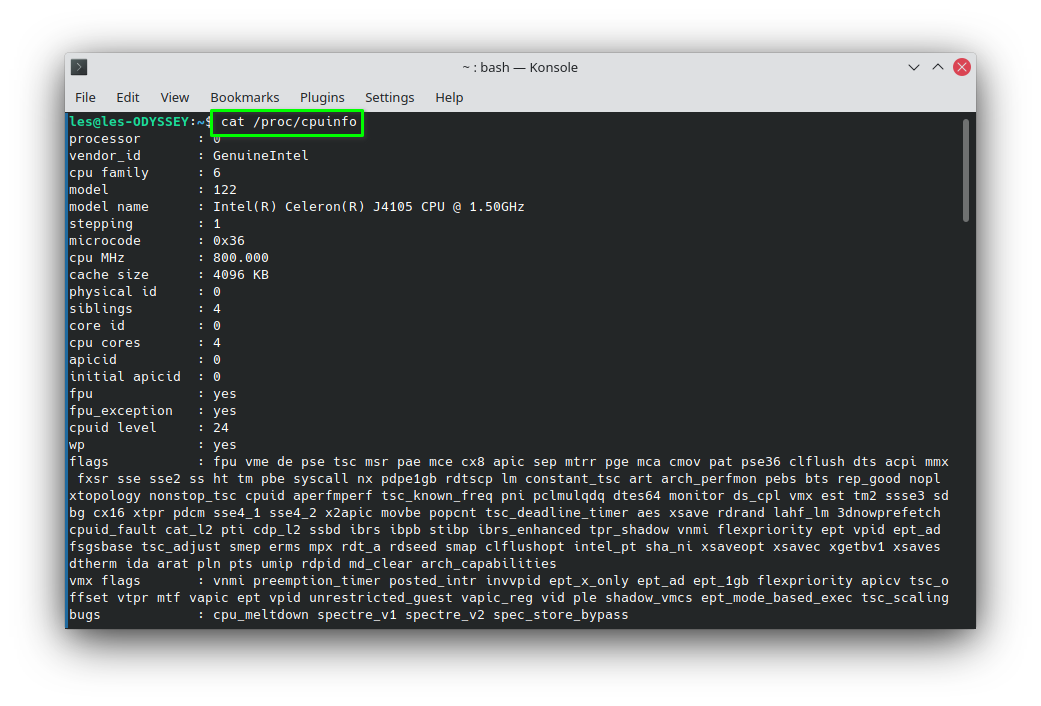
2. Use the cat command to display the data held in /proc/cpuinfo.
cat /proc/cpuinfo
This command will produce a lot of text, typically it will repeat the same information for the number of cores present in your CPU.
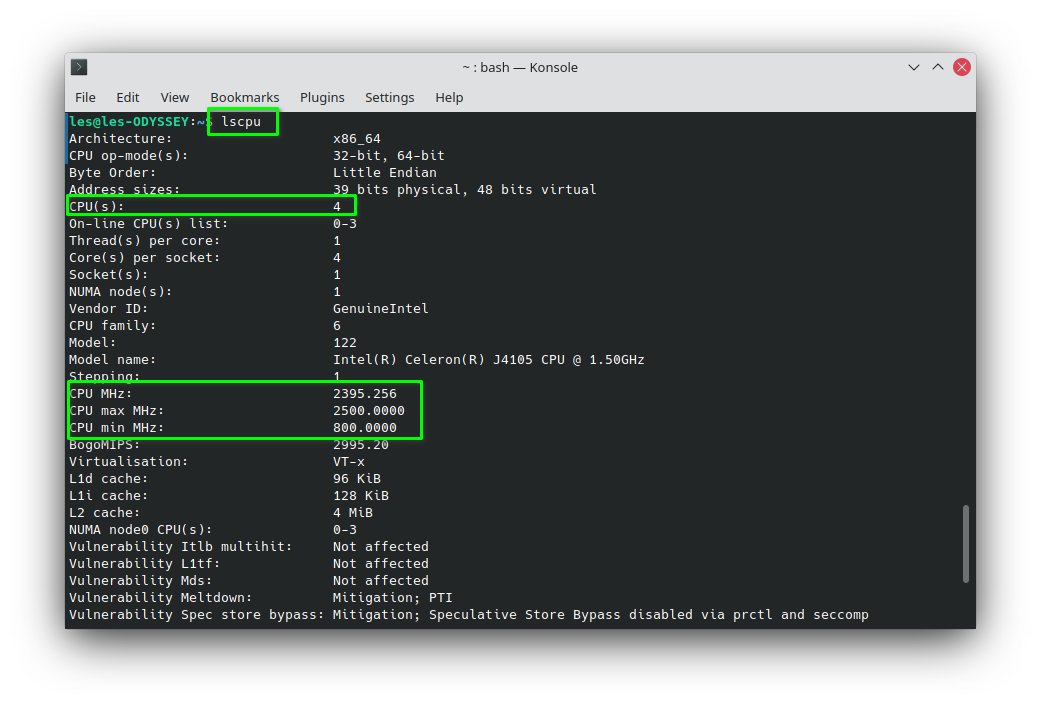
A more concise means to get most of this information is via lscpu, a command that lists the CPU details.
Get Tom's Hardware's best news and in-depth reviews, straight to your inbox.
1. Open a terminal.
2. Use lscpu to display the CPU details. The command is quite verbose and we can easily see the number of CPU cores, minimum and maximum CPU speed and the CPU architecture.
lscpu
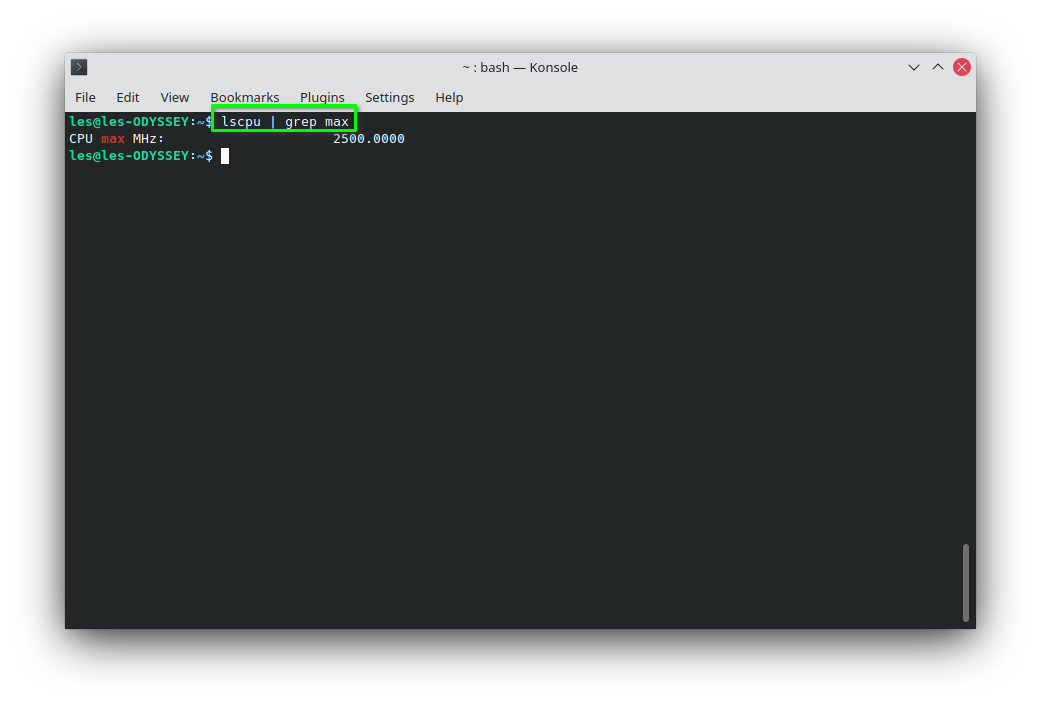
Using a little grep magic we can pull out just the information that we need.
1. Open a terminal.
2. Using a vertical pipe, send the output of the lscpu command to grep and search for “max”. This will give us the maximum possible CPU speed. Pipes are a way to send the output of one command as the input for another. Classic examples are piping the output of a command to a text file for later review.
lscpu | grep max
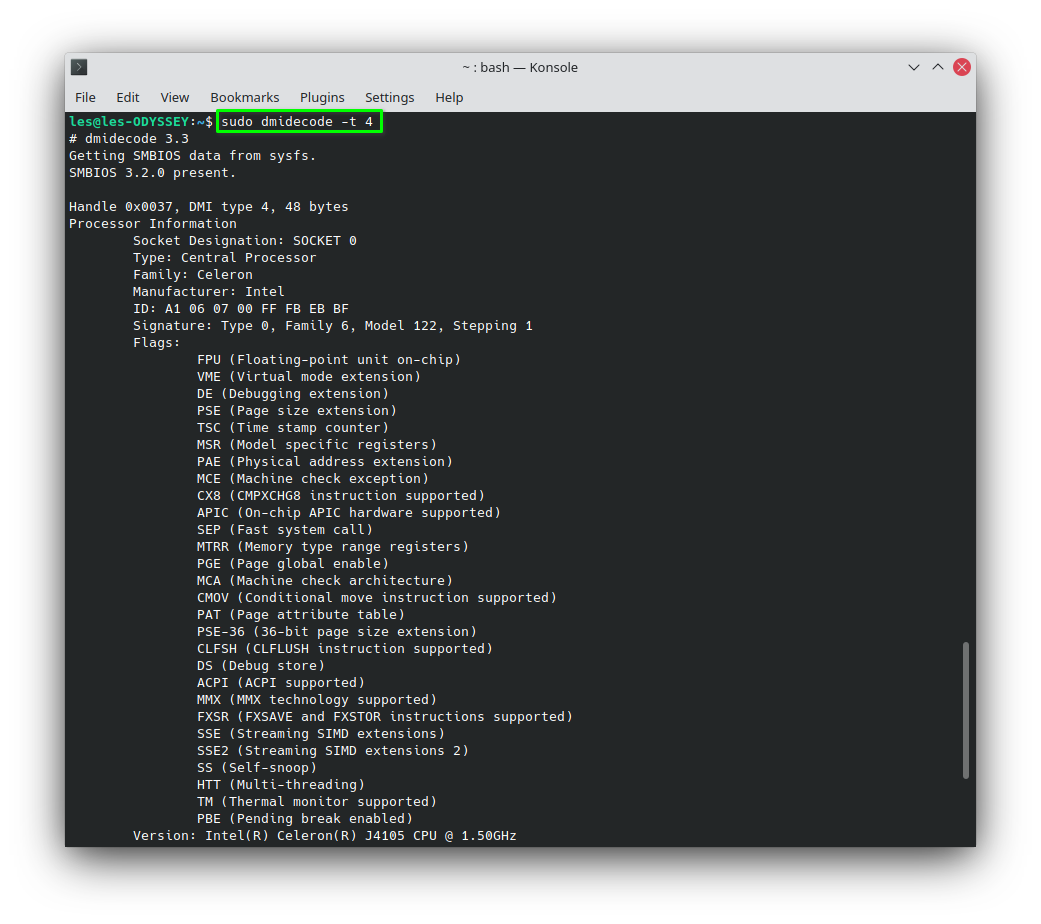
Another means to get CPU information is using dmidecode, a command that dumps the DMI (SMBIOS) contents into something we can understand.
1. Open a terminal.
2. Type in the dmidecode command using sudo, and the argument -t 4. There are many DMI types, with a numerical reference used to pull information for that component. In this case -t 4 is for the CPU. We can replace the 4 with processor for the same effect.
sudo dmidecode -t 4
How to Check Your RAM in Linux
1. Open a terminal window.
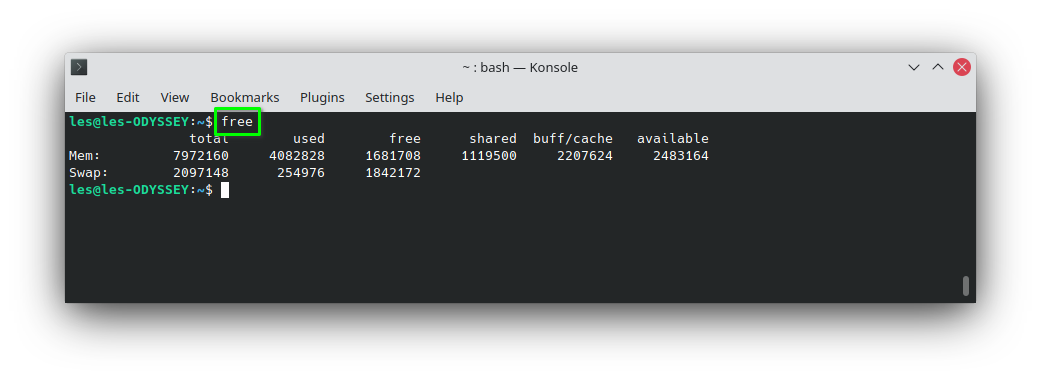
2. Use the free command. This will show the available memory, and how the memory has been allocated, in Kilobytes.
free
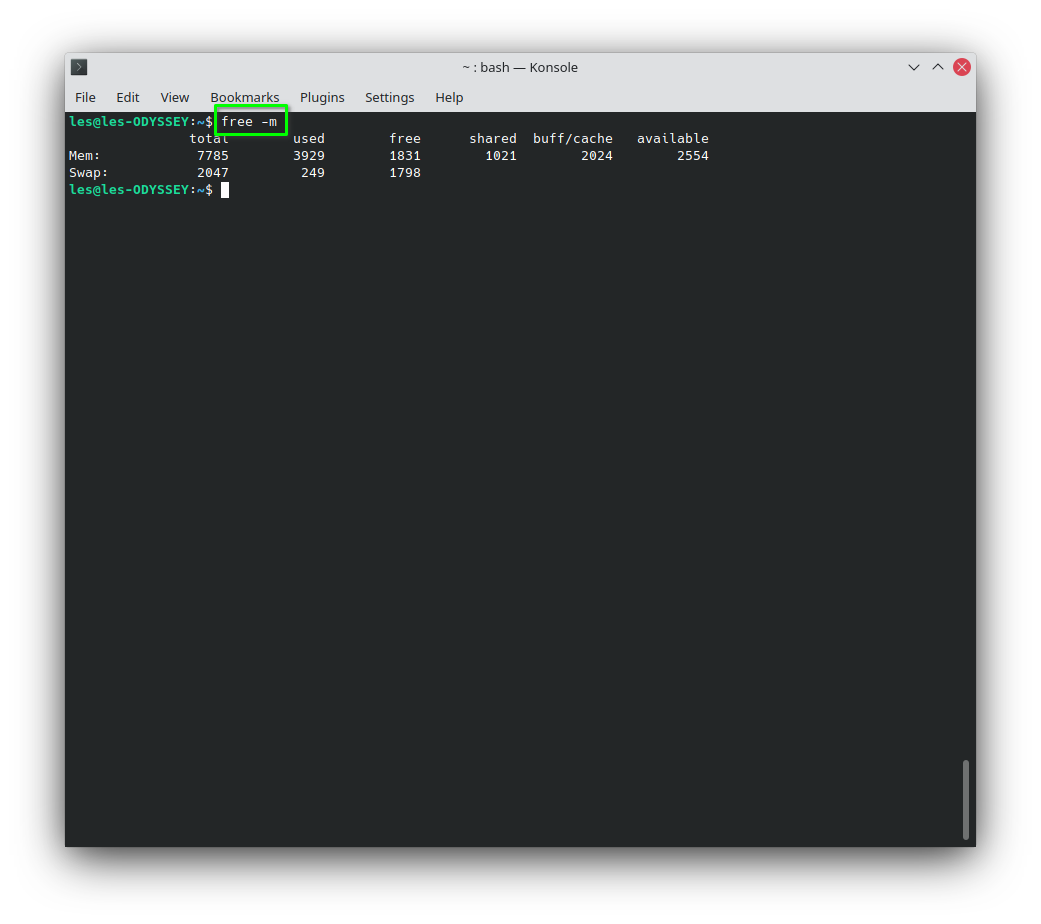
3. Use the -m switch to show the available memory in Megabytes, or -g for Gigabytes.
free -m
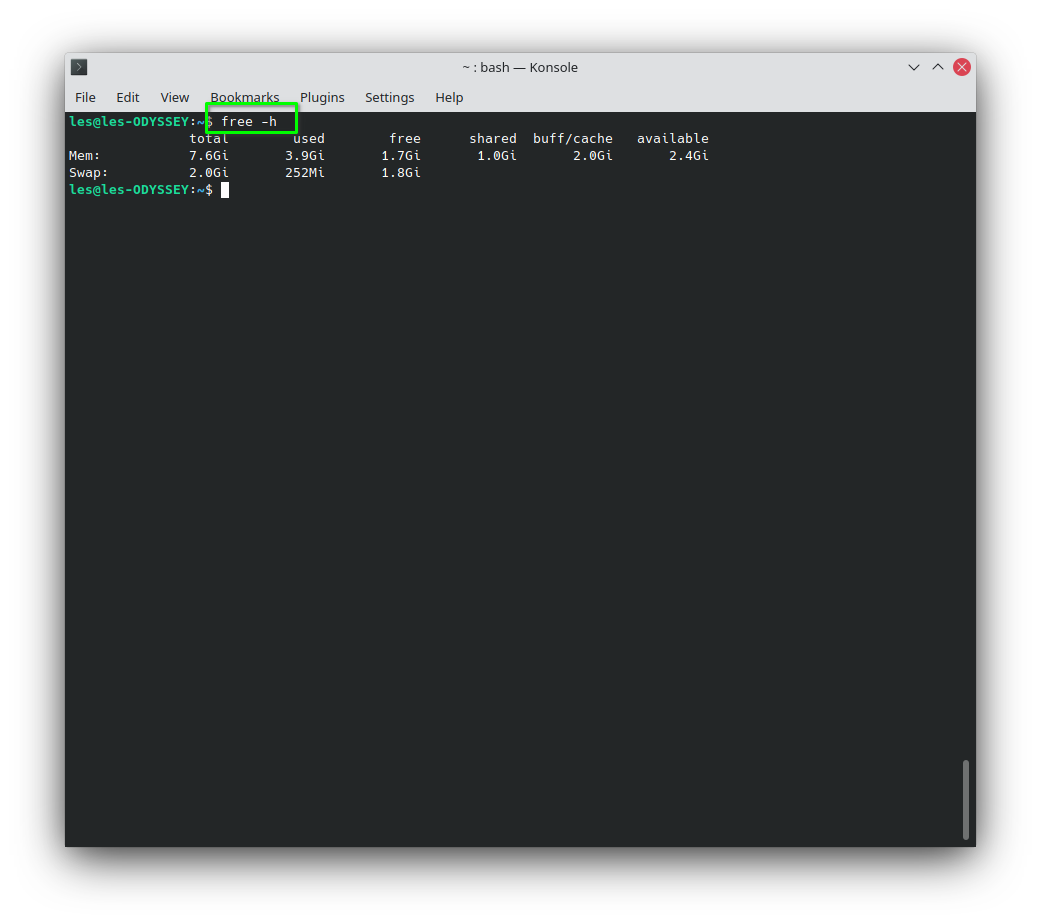
Alternatively use the -h switch to show the memory information scaled to the three shortest digits. Giving us at a glance information.
free -h
There is a similar way to /proc/cpuinfo for memory information.
1. Open a terminal window.
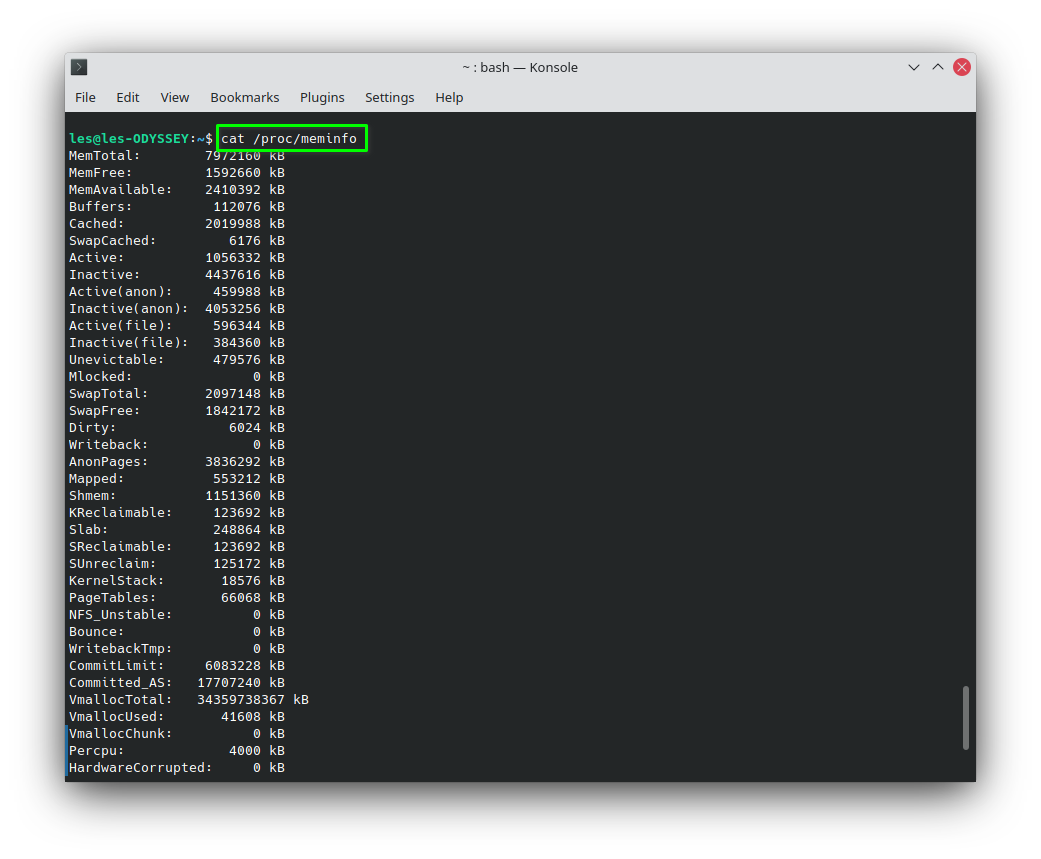
2. Use the cat command to print the contents of /proc/meminfo. The output is incredibly verbose and can prove useful for debug. In general use we would stick with free -m.
cat /proc/meminfo
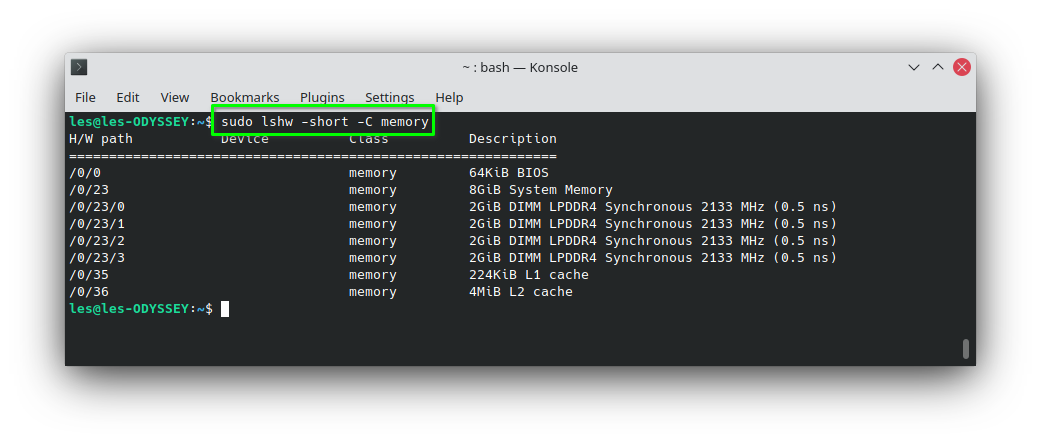
If we need to know the timings and breakdown of memory modules in a machine then we can use lshw.
1. Open a terminal window.
2. Using sudo, issue the lshw command with the -short switch (the device tree) and -C with the class memory.
sudo lshw -short -C memory
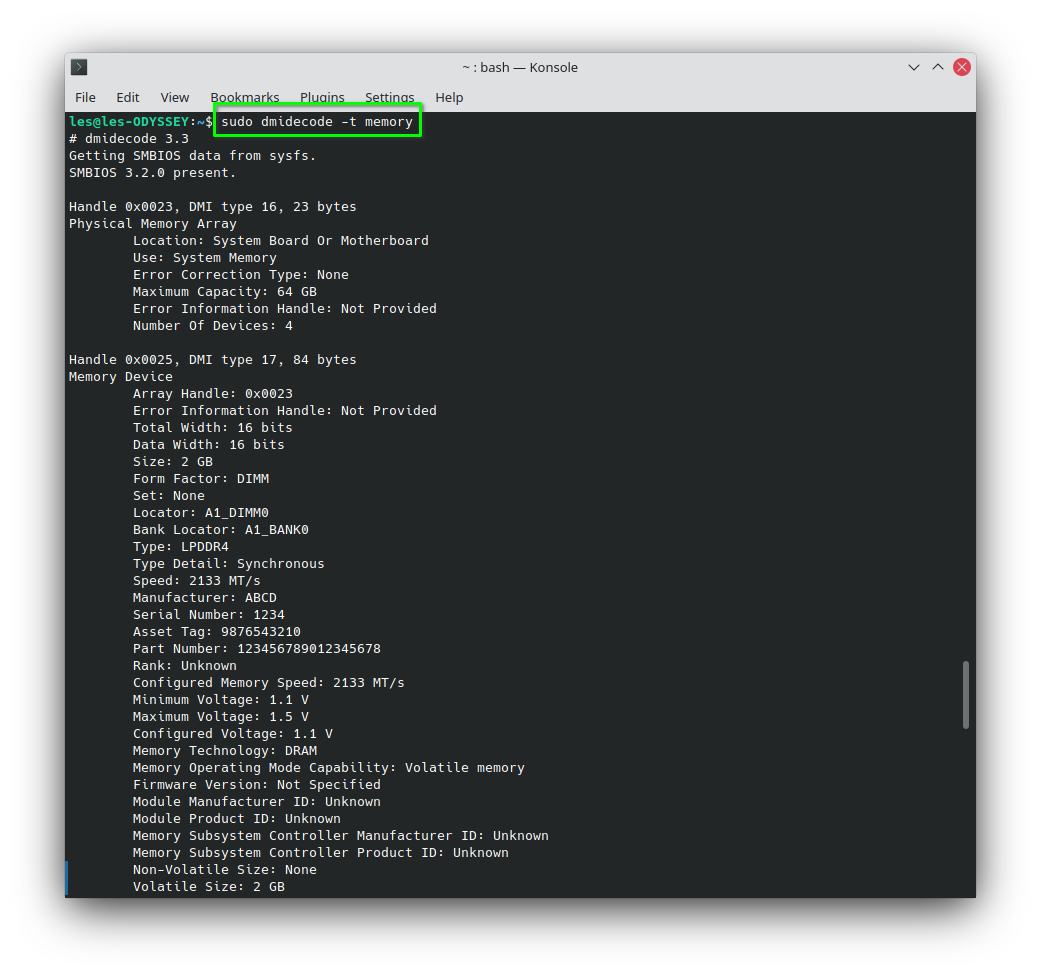
We can also use dmidecode for a more detailed query.
sudo dmidecode -t memory
Information at a Glance
Should we need a more general level of information, our current CPU speed, RAM usage, network bandwidth then we have two commands which can be installed.
How to Install and Use Htop
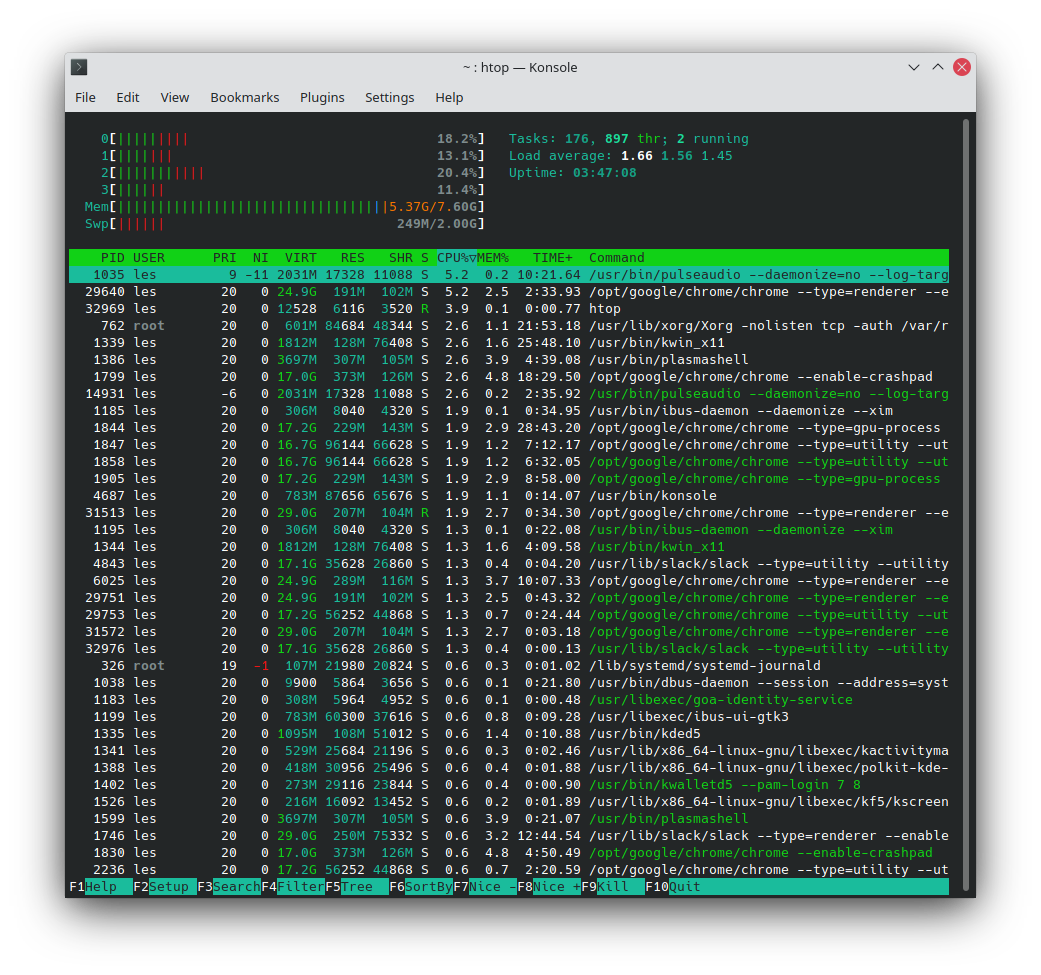
The standard top command is great, but htop is a much better alternative. Htop provides us with an interactive list of running processes.
To install htop.
1. Open a terminal window.
2. Update your list of repositories.
sudo apt update
3. Install htop using apt.
sudo apt install htop
4. Run htop.
htop
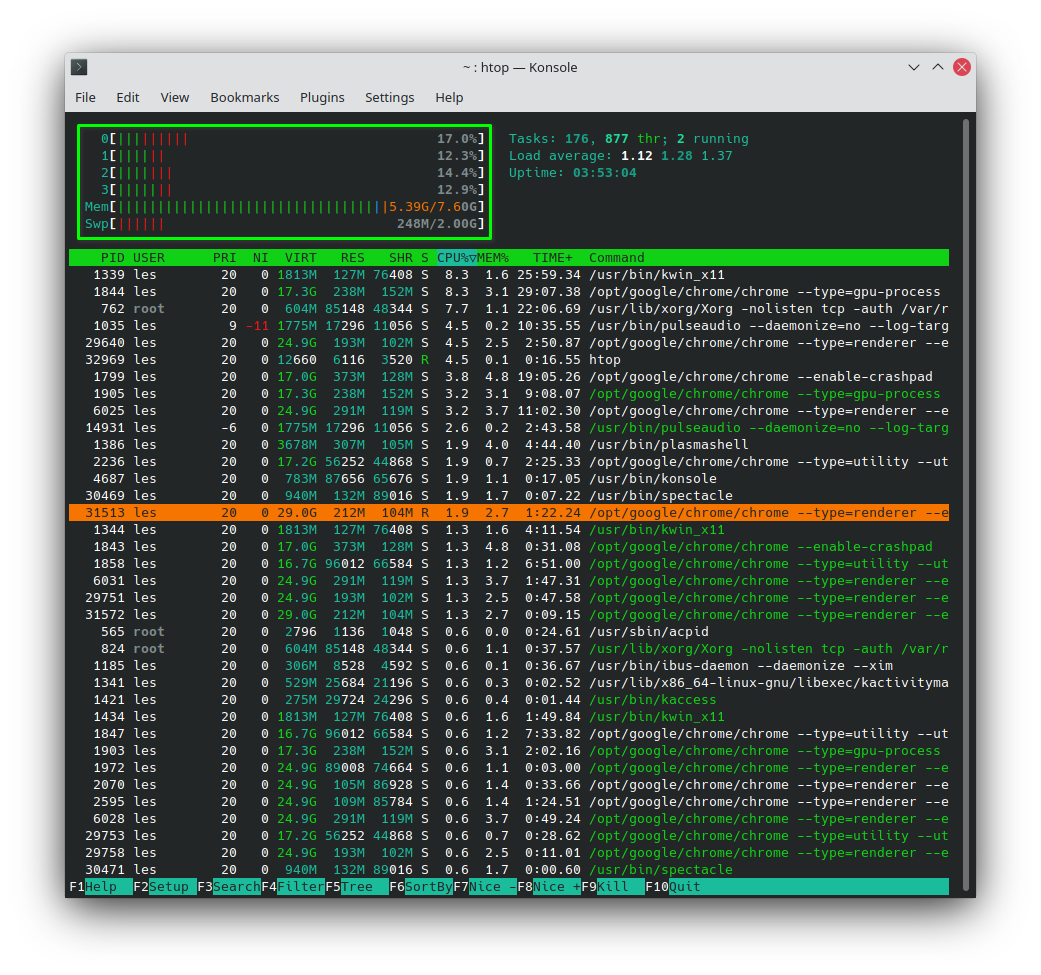
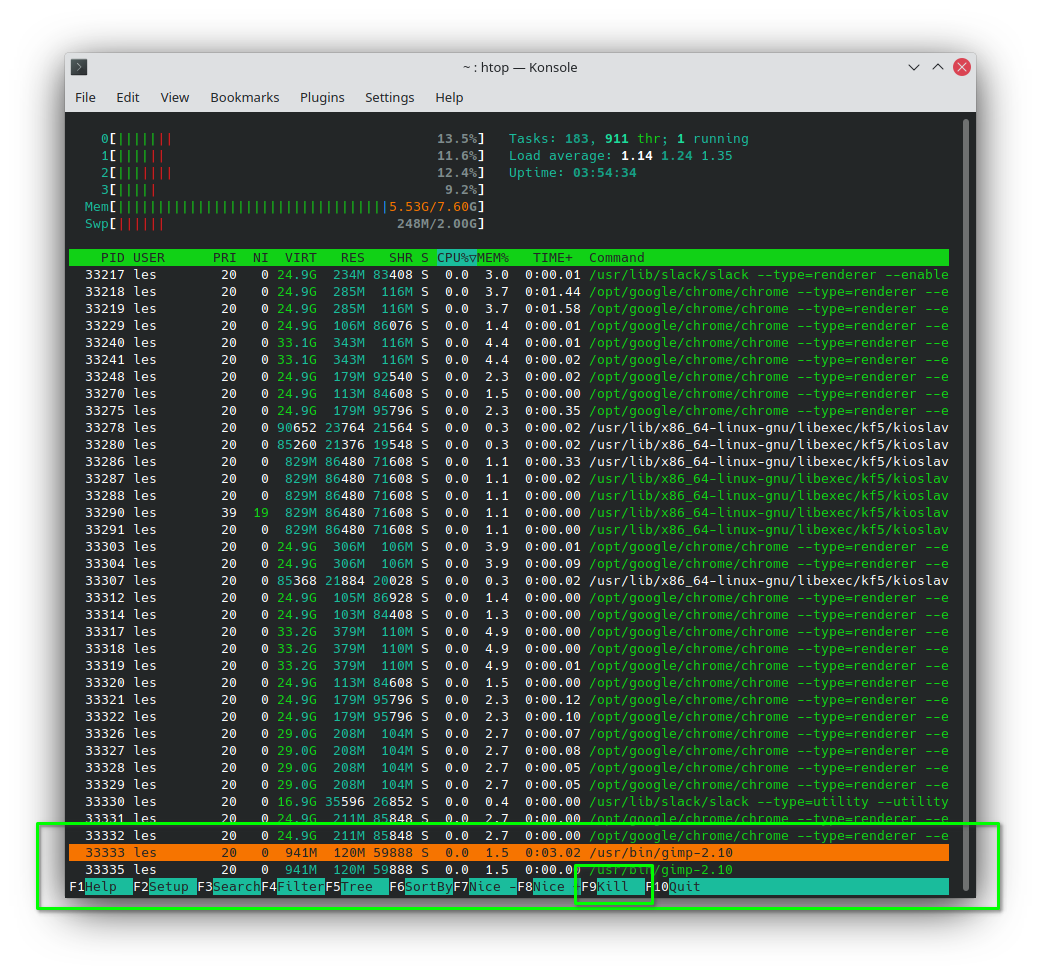
At the top of the window we can see the utilization of our CPU cores, under that is our RAM, and finally is the swap.
We can scroll through the list with our cursor keys or search using F3 followed by the name of a process or application. Here we have searched for the GNU Image Manipulation Program (GIMP). We can kill the app by pressing F9.
To close htop, press F10.
How to Install and Use Bpytop
Our personal preference is bpytop, a Python implementation of htop but with much more to offer.
To install bpytop.
1. Open a terminal window.
2. Install bpytop using the Python package manager pip.
sudo pip3 install bpytop
3. Run bpytop from the terminal.
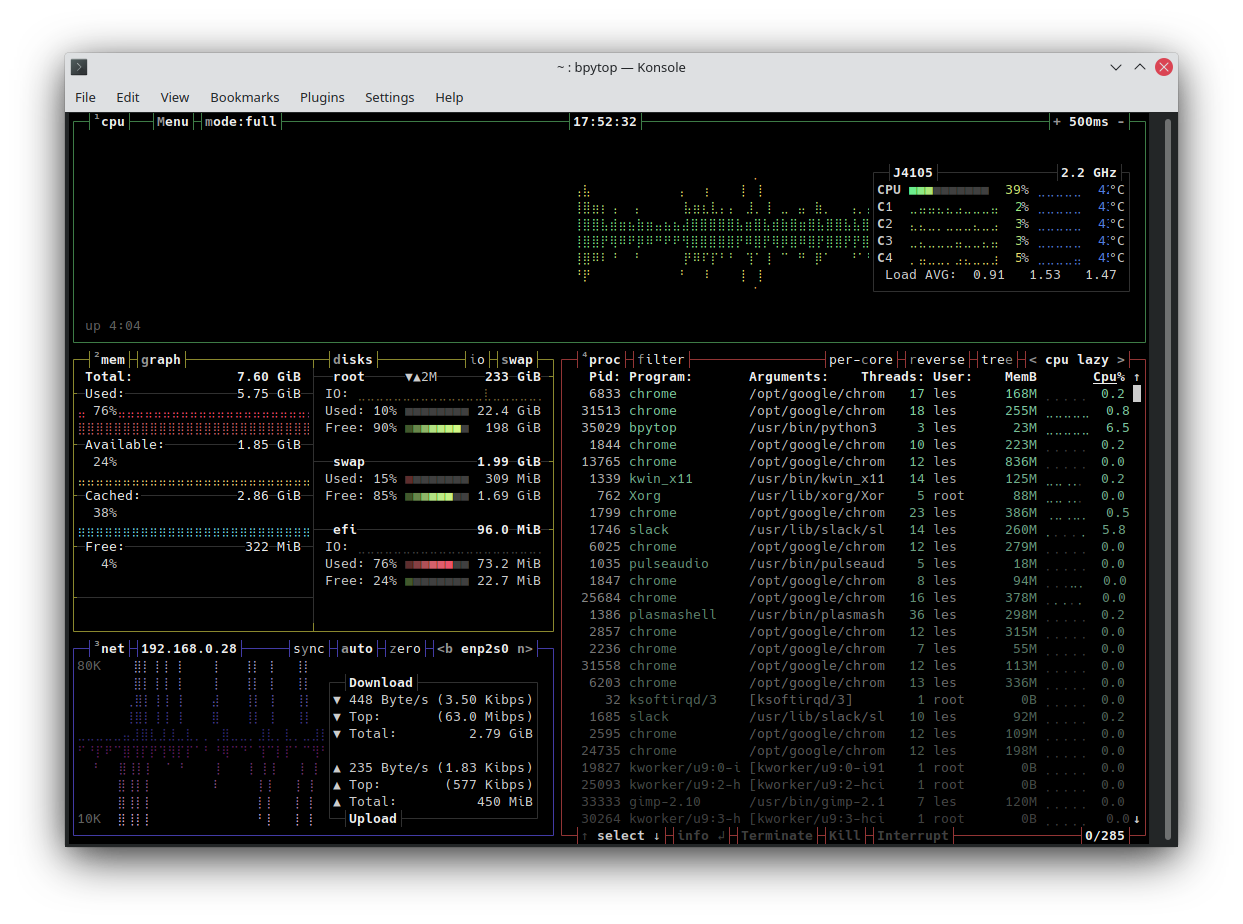
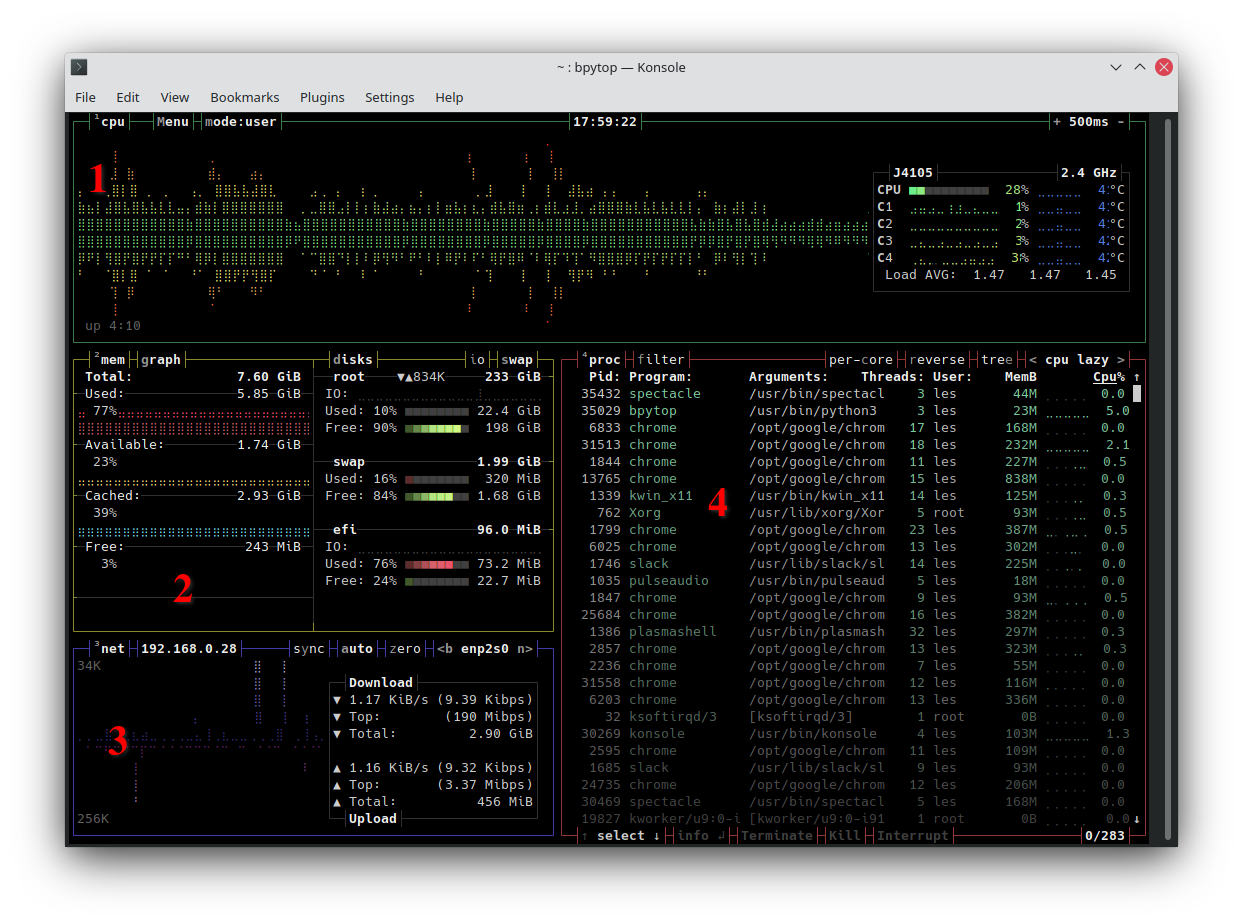
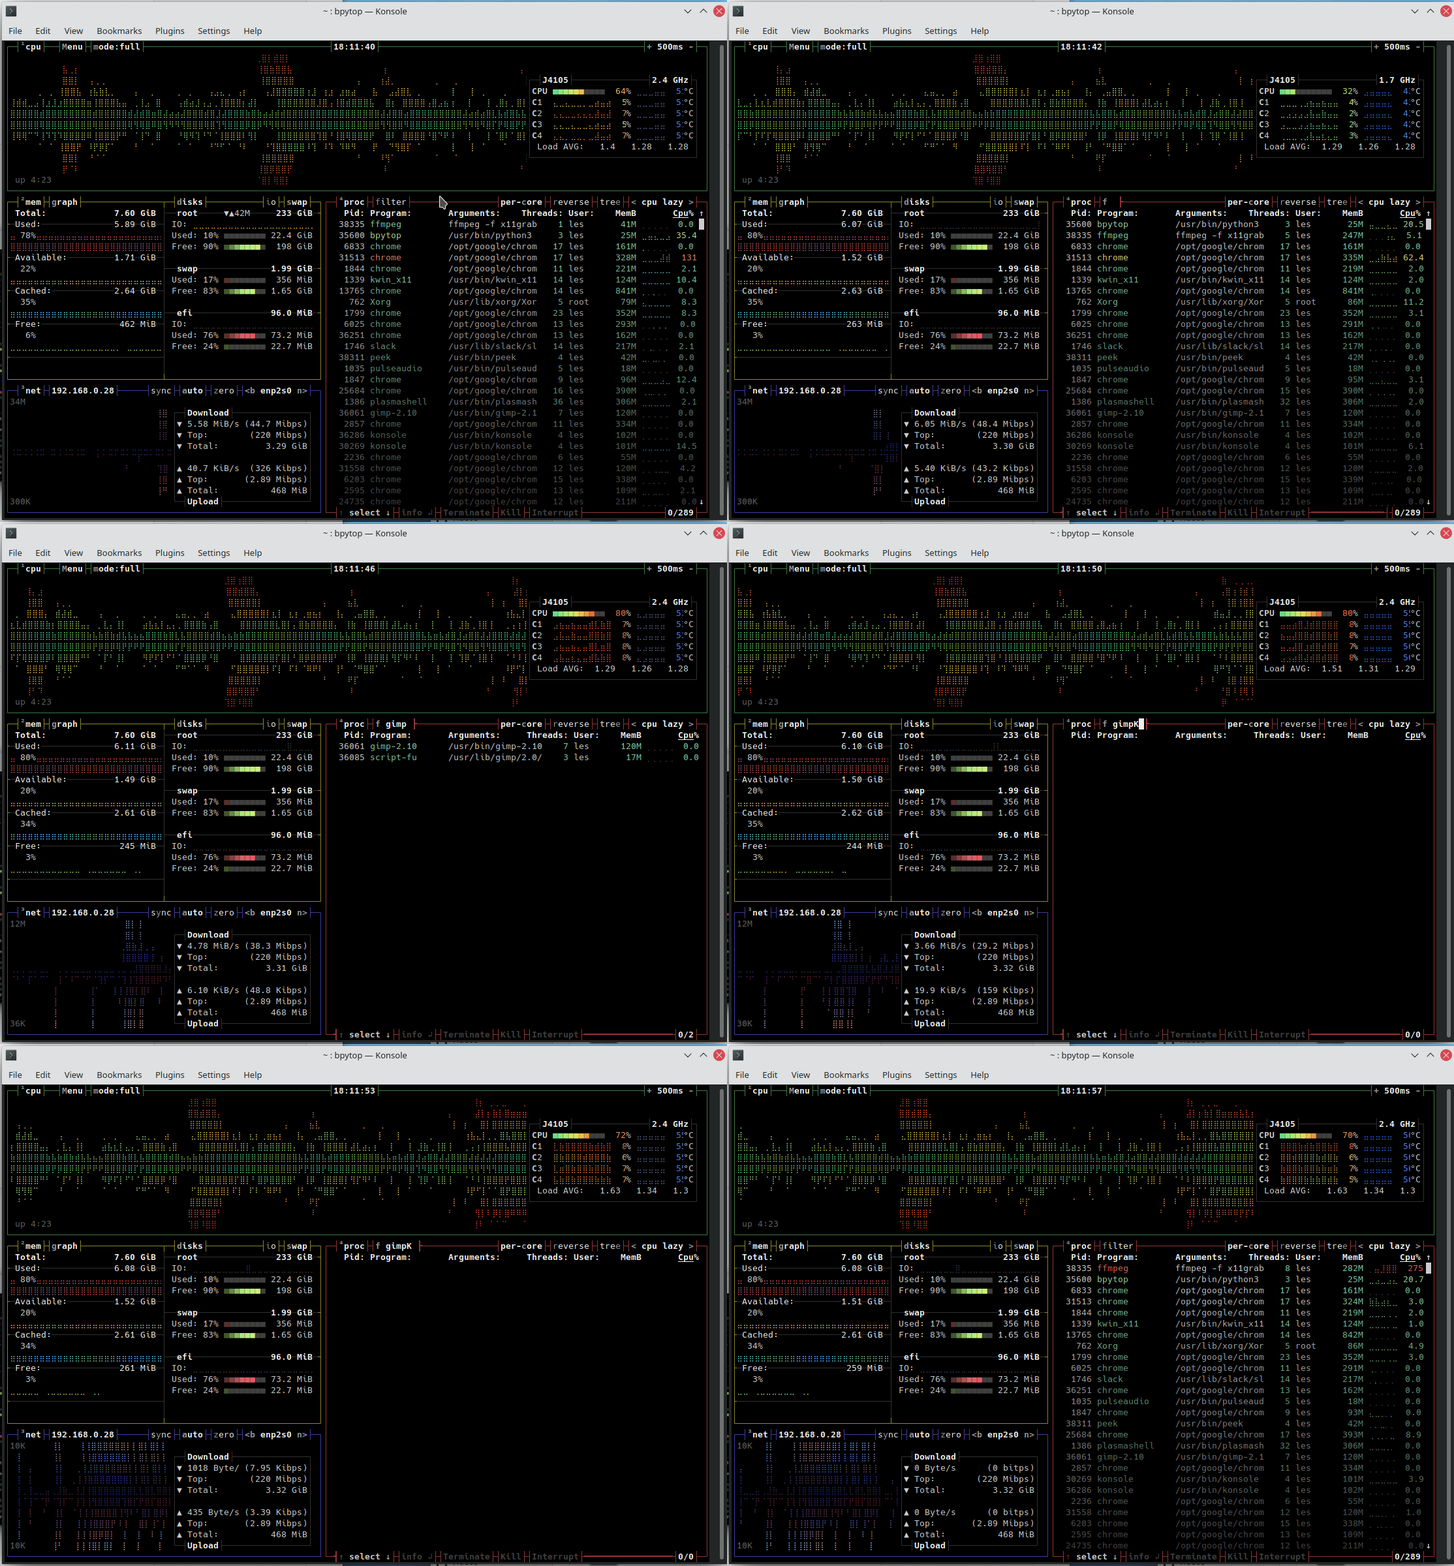
bpytopBpytop’s interface is split into a series of areas.
1. CPU Status
CPU Speed
Core utilization
Overall utilization
2. RAM Usage
Total RAM
Used RAM
Available RAM
Cache
3. Disk / Storage Usage
Used and free space on all mounted devices
4. Network Interface Usage
Up and down speeds
5. Processes (just like htop)
Process management
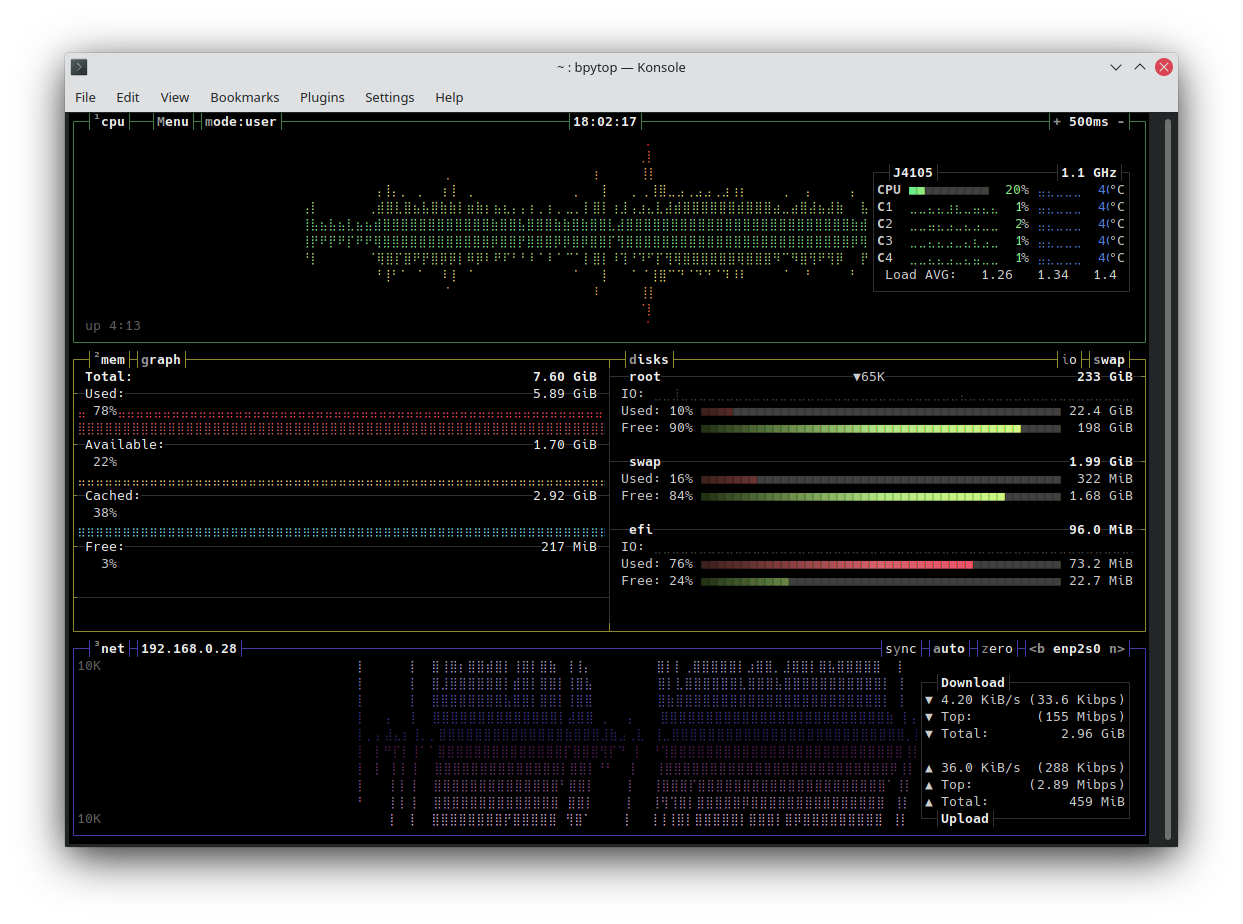
We can show or hide an area by pressing the corresponding number (1..4). If we just wanted CPU, RAM, storage and Network information then we press 4. To bring it back, press 4 again.
To filter the processes for a particular application.
1. Press f to filter. It has to be lower case f.
2. Type in the application / process name / Pid. The search will adapt to show the process, in our case GIMP.
3. Press T to terminate the process, or K to kill. These have to be upper case T and K.
To exit bpytop press q at any time.

Les Pounder is an associate editor at Tom's Hardware. He is a creative technologist and for seven years has created projects to educate and inspire minds both young and old. He has worked with the Raspberry Pi Foundation to write and deliver their teacher training program "Picademy".
