How to Use Raspberry Pi Pico W With Node-RED
Harness the power of the $6 Raspberry Pi Pico W to create live data feeds
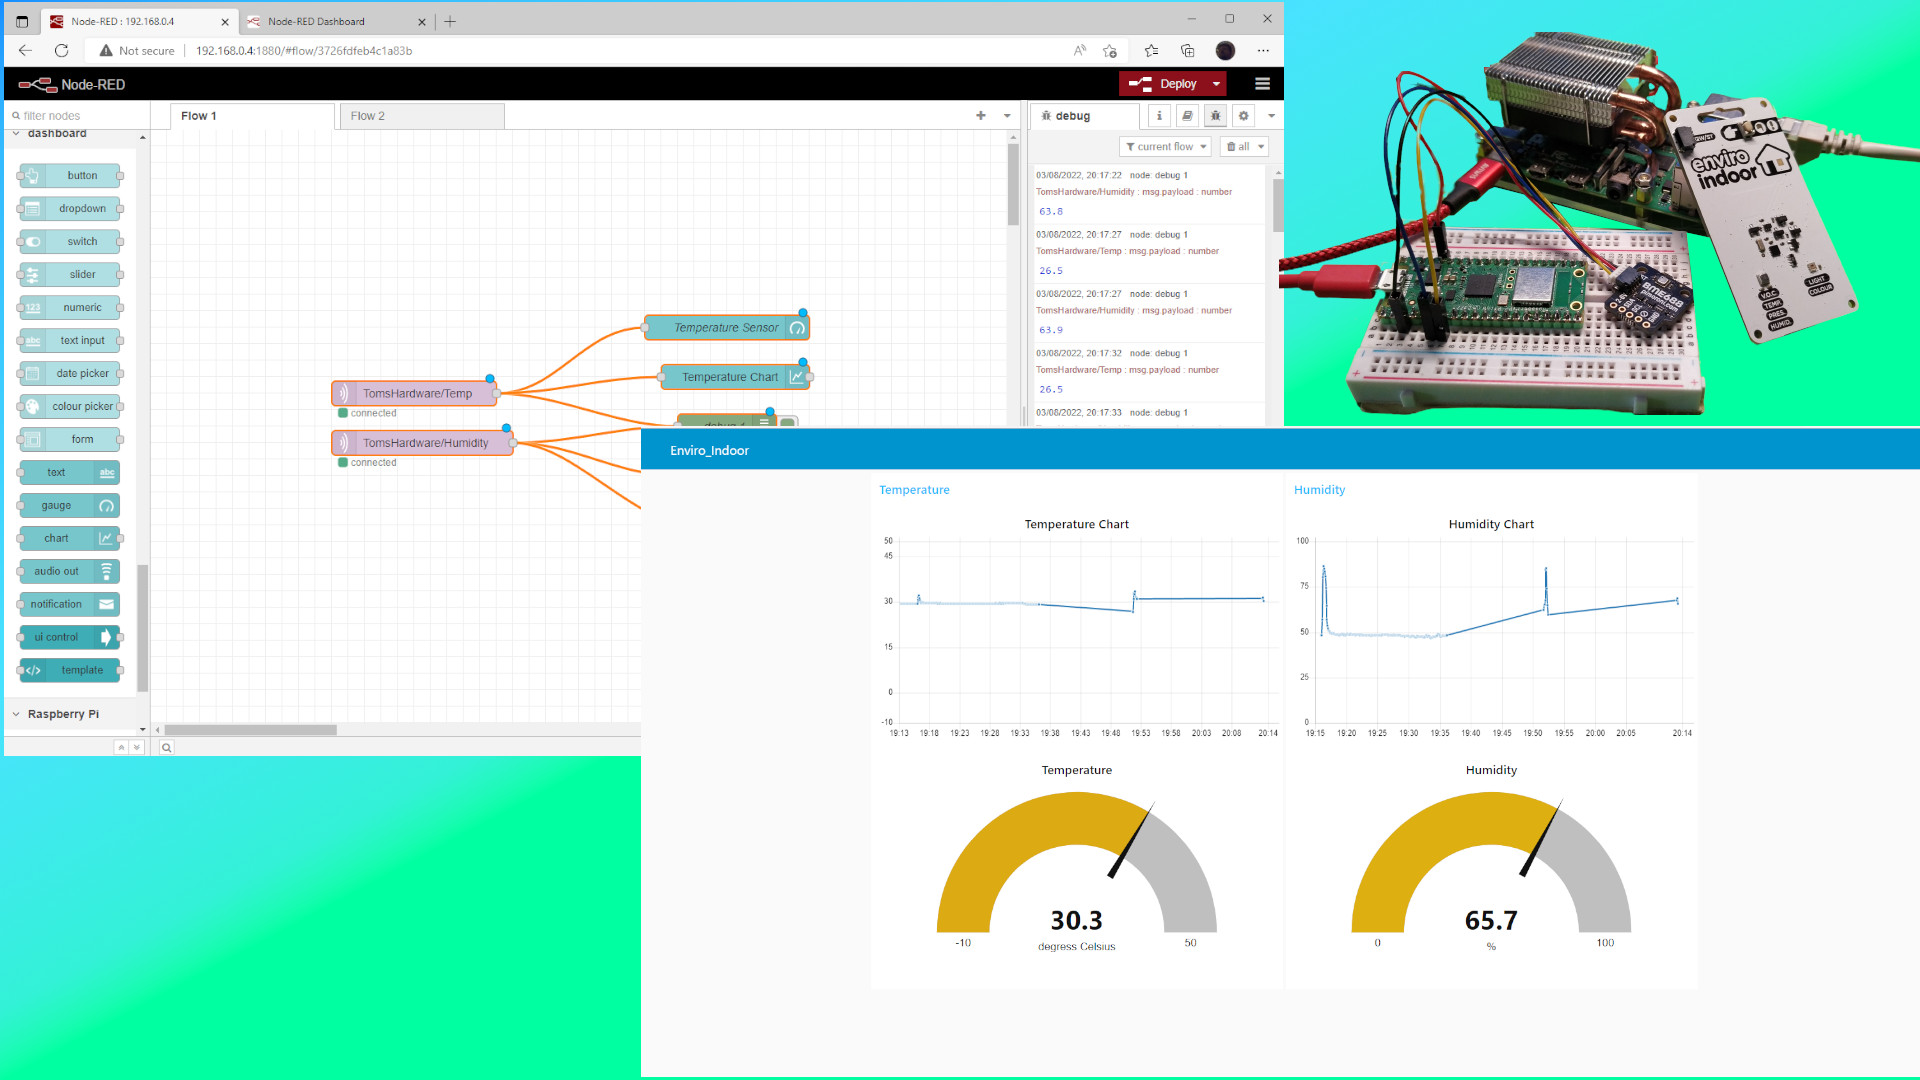
In a previous how to, we introduced MQTT (Message Query Telemetry Transport) with the $6 Raspberry Pi Pico W. In that tutorial we kept things relatively simple. Publishing and subscribing to messages using a little MicroPython and an MQTT broker. We then used an online MQTT service to interact with the Pico W. This proved that everything worked, but in this how-to, we are going to kick things up a notch and build a web application using very little code.
In this how to, we will use Node-RED, an event driven programming language that uses nodes (blocks) to create flows (algorithms) that will subscribe to a live MQTT data feed from our Raspberry Pi Pico W and use that data to create real-time charts and gauges in a web application.
We shall be using Pimoroni’s new Enviro Indoor kit, which is a ready made kit powered by the Raspberry Pi Pico W. It features a BME688 temperature and humidity sensor at its core. If you haven’t got one of these, we also build the project using a Raspberry Pi Pico W and a BME688 breakout board.
For this project you will need
- Raspberry Pi Pico W or Pimoroni Enviro Indoor
- Raspberry Pi running the latest version of Raspberry Pi OS
- Keyboard, mouse, display for the Raspberry Pi
- Wi-Fi connection
- BME688 sensor
- Qw/ST / Stemma QT to male jumper wires
- Breadboard
Connecting the BME688 Sensor to the Raspberry Pi Pico W
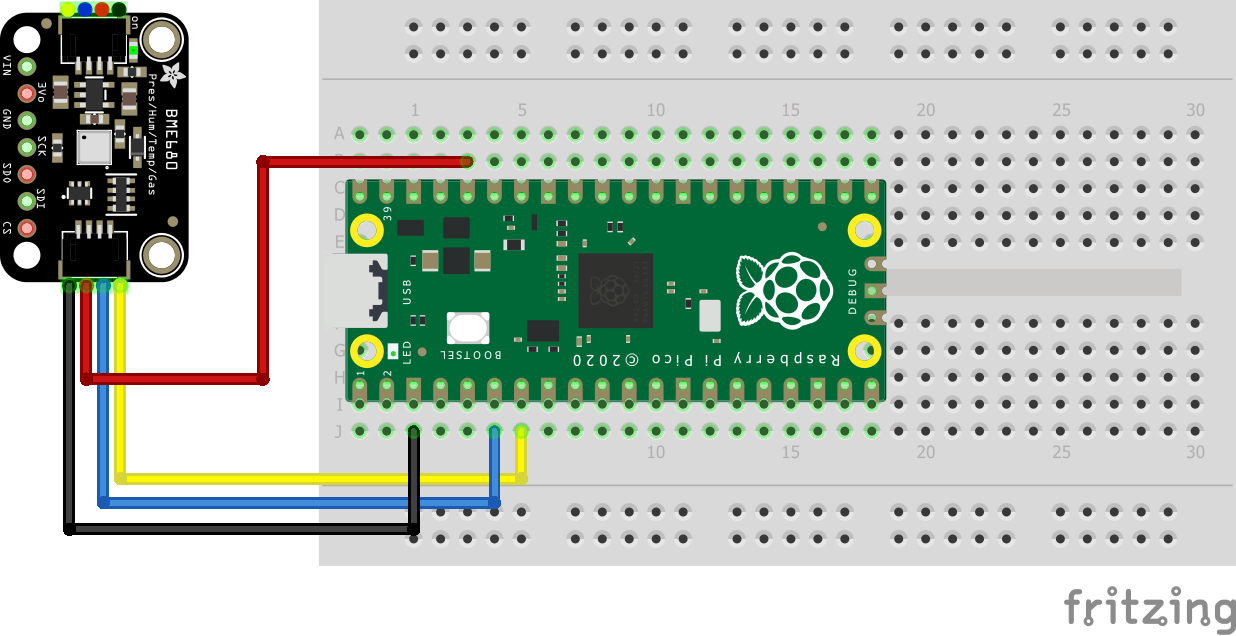
The BME688 sensor uses I2C as a means to communicate with the Raspberry Pi Pico W. Our board is a Breakout Garden style board, with Qw/ST (Stemma QT/ Qwiic) connector.
Connect the BME688 to your Pico W as follows.
| Raspberry Pi Pico W GPIO | Color |
| 3v3(OUT) | Red |
| GND | Black |
| SDA (GP4) | Blue |
| SCL (GP5) | Yellow |
Setting up the Raspberry Pi Pico W
For this project you can use a Raspberry Pi Pico W, or Pimoroni’s new Enviro Indoor kit. We will be using both, to illustrate the portability of the code.
1. Download the latest Pimoroni MicroPython firmware for the Raspberry Pi Pico W. This firmware comes with a MicroPython module for the BME688 sensor.
Get Tom's Hardware's best news and in-depth reviews, straight to your inbox.
2. Follow steps 2 and 3 in these instructions to flash the Pimoroni firmware to your Raspberry Pi Pico W. Later instructions show how to install Thonny on your machine. If you have not installed Thonny, please also follow those instructions.
3. Open Thonny and in the Python shell write four lines of MicroPython to connect your Raspberry Pi Pico W to Wi-Fi. Change the Wi-Fi AP and PASSWORD to match those of your Wi-Fi access point. Remember to press Enter at the end of each line.
import network
wlan = network.WLAN(network.STA_IF)
wlan.active(True)
wlan.connect("Wi-Fi AP","PASSWORD")
4. Import the upip module. The upip module is a version of the Python package manager, pip, for MicroPython.
import upip5. Using upip, install umqtt.simple. This module is a simplified MQTT client for MicroPython.
upip.install(‘umqtt.simple’)Publishing Sensor Data to MQTT
1. Create a new file in Thonny.
2. Import five modules of Python code for Wi-Fi connectivity, controlling the pace of the code, accessing the BME688 sensor, I2C and MQTT.
import network
import time
from breakout_bme68x import BreakoutBME68X, STATUS_HEATER_STABLE
from pimoroni_i2c import PimoroniI2C
from umqtt.simple import MQTTClient3.Create an object, wlan, which is then used to connect to your Wi-Fi access point.
wlan = network.WLAN(network.STA_IF)
wlan.active(True)
wlan.connect("Wi-Fi AP","PASSWORD")
4. Create a dictionary to store the GPIO pins that are used for I2C.
PINS_BREAKOUT_GARDEN = {"sda": 4, "scl": 5}5. Create an object, i2c, and use Pimoroni’s I2C class to set up the I2C connection.
i2c = PimoroniI2C(**PINS_BREAKOUT_GARDEN)6. Create an object, bmp, to make a connection between our code and the BME688 sensor. We use the i2c object and specify the address, 0x77, for the sensor on our Enviro Indoor. If you are using a standalone BME688, omit the 0x77 address.
bmp = BreakoutBME68X(i2c, 0x77)7. Create four variables to store the URL for our MQTT broker, our client_id, and two topics. Remember we are using a public broker. Our client_id will not be used, but we need to provide one anyway. The topic is the subject that a subscriber will be listening for. In our case we have two, one for the temperature and another for the humidity.
mqtt_server = 'broker.hivemq.com'
client_id = 'bigles'
topic_pub_temp = b'TomsHardware/Temp'
topic_pub_humid = b'TomsHardware/Humidity'
8. Create a function to handle MQTT connections. Using a function we can easily call the function later in the code, without the need to repeat the contents of the function.
def mqtt_connect():9. Create an object, client, and use it to store the client_id and MQTT broker details, along with an option to keep the connection live for one hour. Code inside of a function is indented four spaces (or one tab) to indicate it is part of the function.
client = MQTTClient(client_id, mqtt_server, keepalive=3600)10. Use the client object to connect to the MQTT broker.
client.connect()11. Print a message to the python shell upon successful connection, then return the contents of the client object to the shell. This is useful for debugging.
   print('Connected to %s MQTT Broker'%(mqtt_server))
   return client
12. Create a new function, reconnect, which will pause for five seconds before resetting the Pico W. This will force the Pico W to try and reconnect.
def reconnect():
   print('Failed to connect to the MQTT Broker. Reconnecting...')
   time.sleep(5)
   machine.reset()
13. Create an exception handler which will try to connect to the MQTT broker using mqtt_connect() function.
try:
   client = mqtt_connect()
14. Add an exception so that if the code fails to connect, an error is raised, which will force the Pico W to reset using the reconnect() function.
except OSError as e:
   reconnect()
15. Create a loop to constantly send sensor data.
while True:16. Read the sensor data from the BME688 and store it in corresponding objects.
temperature, pressure, humidity, gas, status, _, _ = bmp.read()17. Create an object, heater, and use it to store the status of the heater. The BME688 has its own heater element which takes around five minutes to heat up and provide consistent data. If the heater has yet to heat up, we treat it as unstable.
heater = "Stable" if status & STATUS_HEATER_STABLE else "Unstable"18. Print the current temperature, air pressure, humidity, volatile organic compounds (VOC) and heater status to the Python shell. This isn’t strictly necessary, but it provides a means to debug the code, and show that the sensor is producing data.
print("{:0.2f}c, {:0.2f}Pa, {:0.2f}%, {:0.2f} Ohms, Heater: {}".format(
       temperature, pressure, humidity, gas, heater))
19. Create two new objects, temperature and humidity. In the respective objects store the temperature and humidity rounded to one decimal place. This makes the data easier to read in our Node-RED web application.
   temperature = round(temperature,1)
   humidity = round(humidity,1)
20. Publish the temperature and humidity data to the respective MQTT topics. We convert the data into strings, otherwise an error will occur.
   client.publish(topic_pub_temp, str(temperature))
   client.publish(topic_pub_humid, str(humidity))
21. Pause the code for five seconds before the loop repeats. This can be changed to a longer or shorter period of time.
time.sleep(5.0)22. Save the code as main.py. This will ensure that the code automatically runs every time the Pico W is powered up.
23. Click on Run (green arrow in the toolbar) to run the code for a test.
Complete MQTT Publish Code Listing
import network
import time
from breakout_bme68x import BreakoutBME68X, STATUS_HEATER_STABLE
from pimoroni_i2c import PimoroniI2C
from umqtt.simple import MQTTClient
wlan = network.WLAN(network.STA_IF)
wlan.active(True)
wlan.connect("Wi-Fi AP","PASSWORD")
PINS_BREAKOUT_GARDEN = {"sda": 4, "scl": 5}
i2c = PimoroniI2C(**PINS_BREAKOUT_GARDEN)
bmp = BreakoutBME68X(i2c, 0x77)
mqtt_server = 'broker.hivemq.com'
client_id = 'bigles'
topic_pub_temp = b'TomsHardware/Temp'
topic_pub_humid = b'TomsHardware/Humidity'
def mqtt_connect():
   client = MQTTClient(client_id, mqtt_server, keepalive=3600)
   client.connect()
   print('Connected to %s MQTT Broker'%(mqtt_server))
   return client
def reconnect():
   print('Failed to connect to the MQTT Broker. Reconnecting...')
   time.sleep(5)
   machine.reset()
try:
   client = mqtt_connect()
except OSError as e:
   reconnect()
while True:
   temperature, pressure, humidity, gas, status, _, _ = bmp.read()
   heater = "Stable" if status & STATUS_HEATER_STABLE else "Unstable"
   print("{:0.2f}c, {:0.2f}Pa, {:0.2f}%, {:0.2f} Ohms, Heater: {}".format(
       temperature, pressure, humidity, gas, heater))
   temperature = round(temperature,1)
   humidity = round(humidity,1)
   client.publish(topic_pub_temp, str(temperature))
   client.publish(topic_pub_humid, str(humidity))
time.sleep(5.0)
Subscribing to the Sensor Data with Node-RED
At this time, our Pico W is firing BME688 temperature and humidity data into a void. Nobody is subscribed to read it. Rather than read it using HiveMQ’s online client, we are going to use Node-RED to create a web interface.
For this part of the project our focus turns to the Raspberry Pi 4. We shall use the Pi 4 as a server to run Node-RED. Node-RED can be installed on a Windows, Apple or Linux computer, but we chose the Pi as it offers a risk free means to learn Node-RED.
1. Power up your Raspberry Pi to the desktop.
2. Open a terminal and install Node-RED using a one line Bash script installer.
bash <(curl -sL https://raw.githubusercontent.com/node-red/linux-installers/master/deb/update-nodejs-and-nodered)3. Follow the installation instructions, and when prompted to install Pi-specific nodes, select yes. We don’t use them in this project, but they will be there should you wish to further your learning.
4. In the terminal, set Node-RED to start each time the Pi boots. This service will start when your Pi boots up and provides a quick means to access Node-RED.
sudo systemctl enable nodered.service5. On your Raspberry Pi, or another machine on the same network, open a browser window and open Node-RED via this URL. We can use the IP address or the hostname of the Pi followed by port 1880 to access the Node-RED web interface.
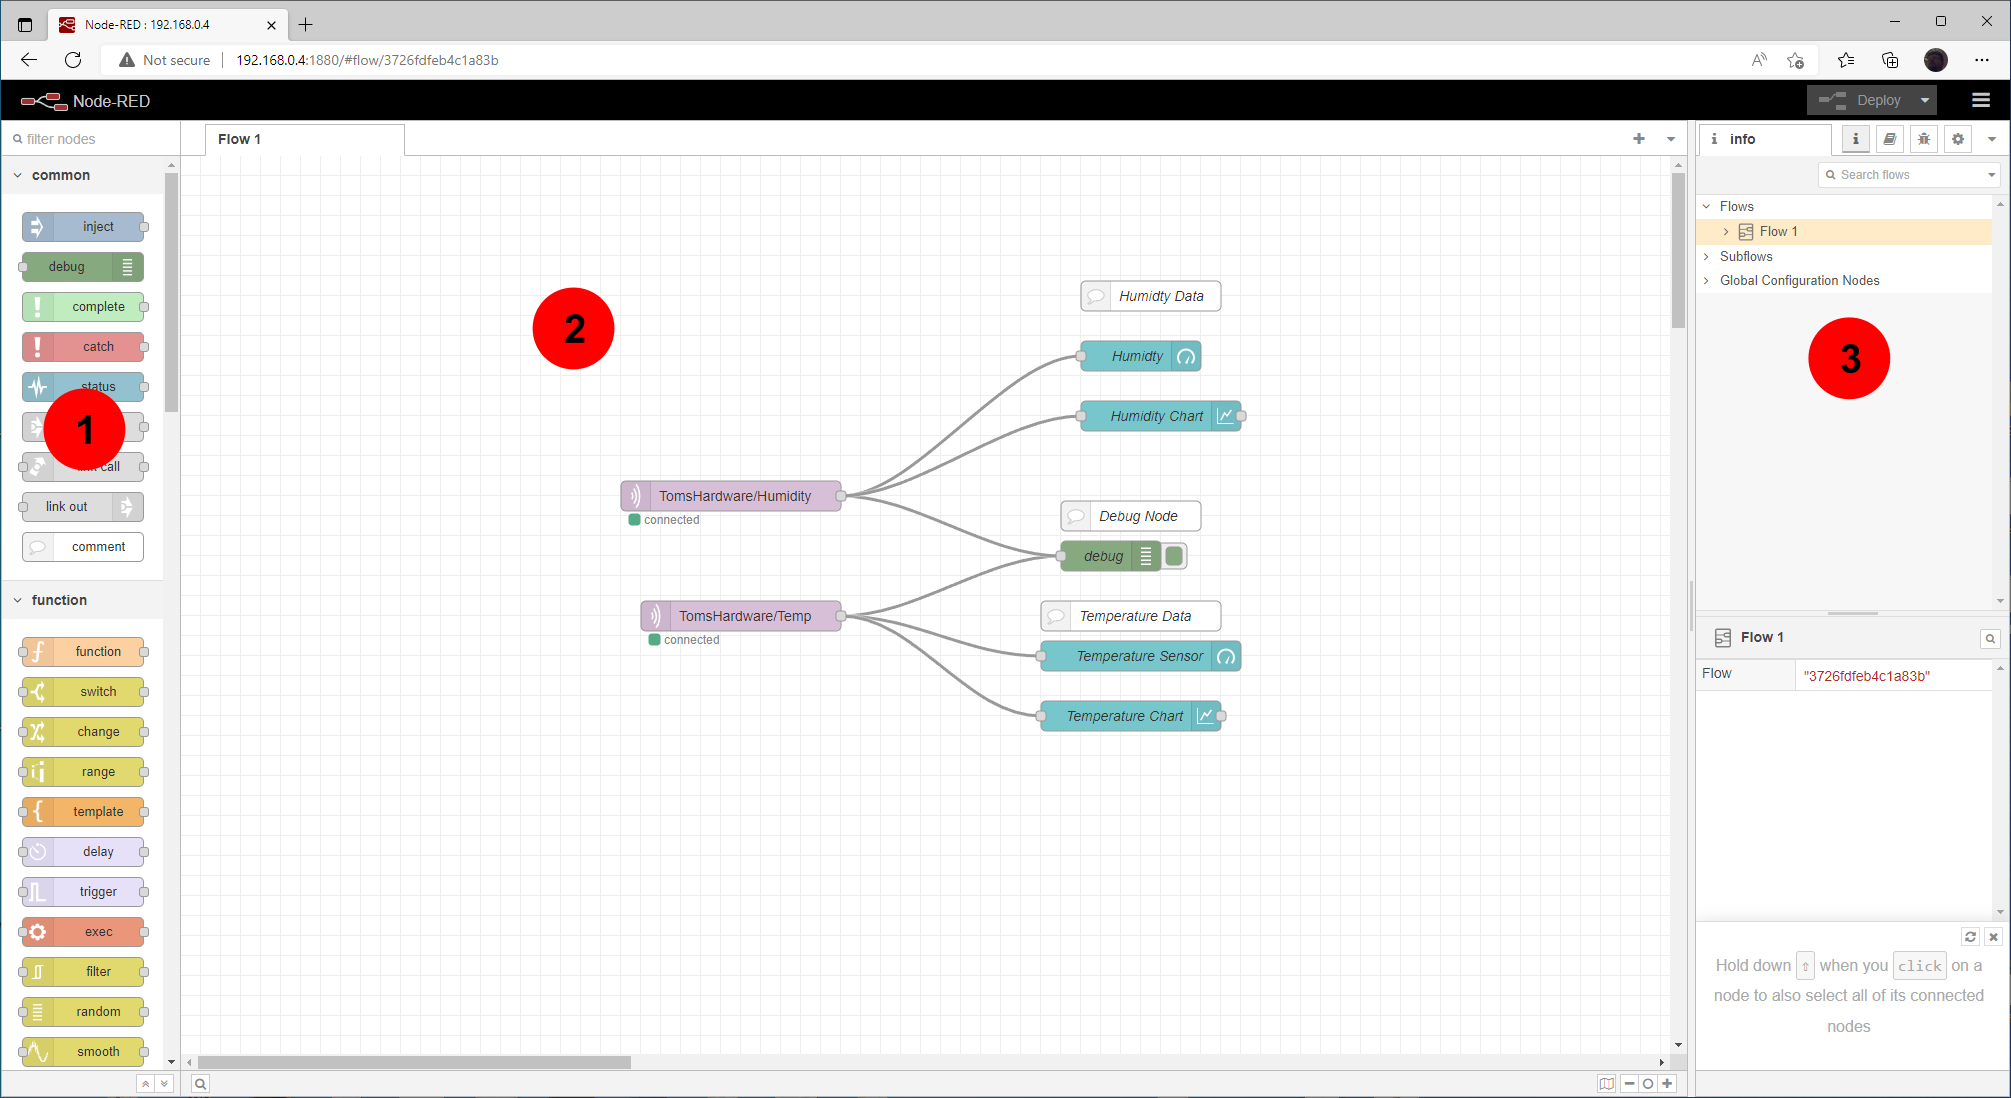
raspberrypi.local:1880The Node-RED user interface is split into three areas.
Our first task is to connect Node-RED to the same MQTT broker as our Pico W.
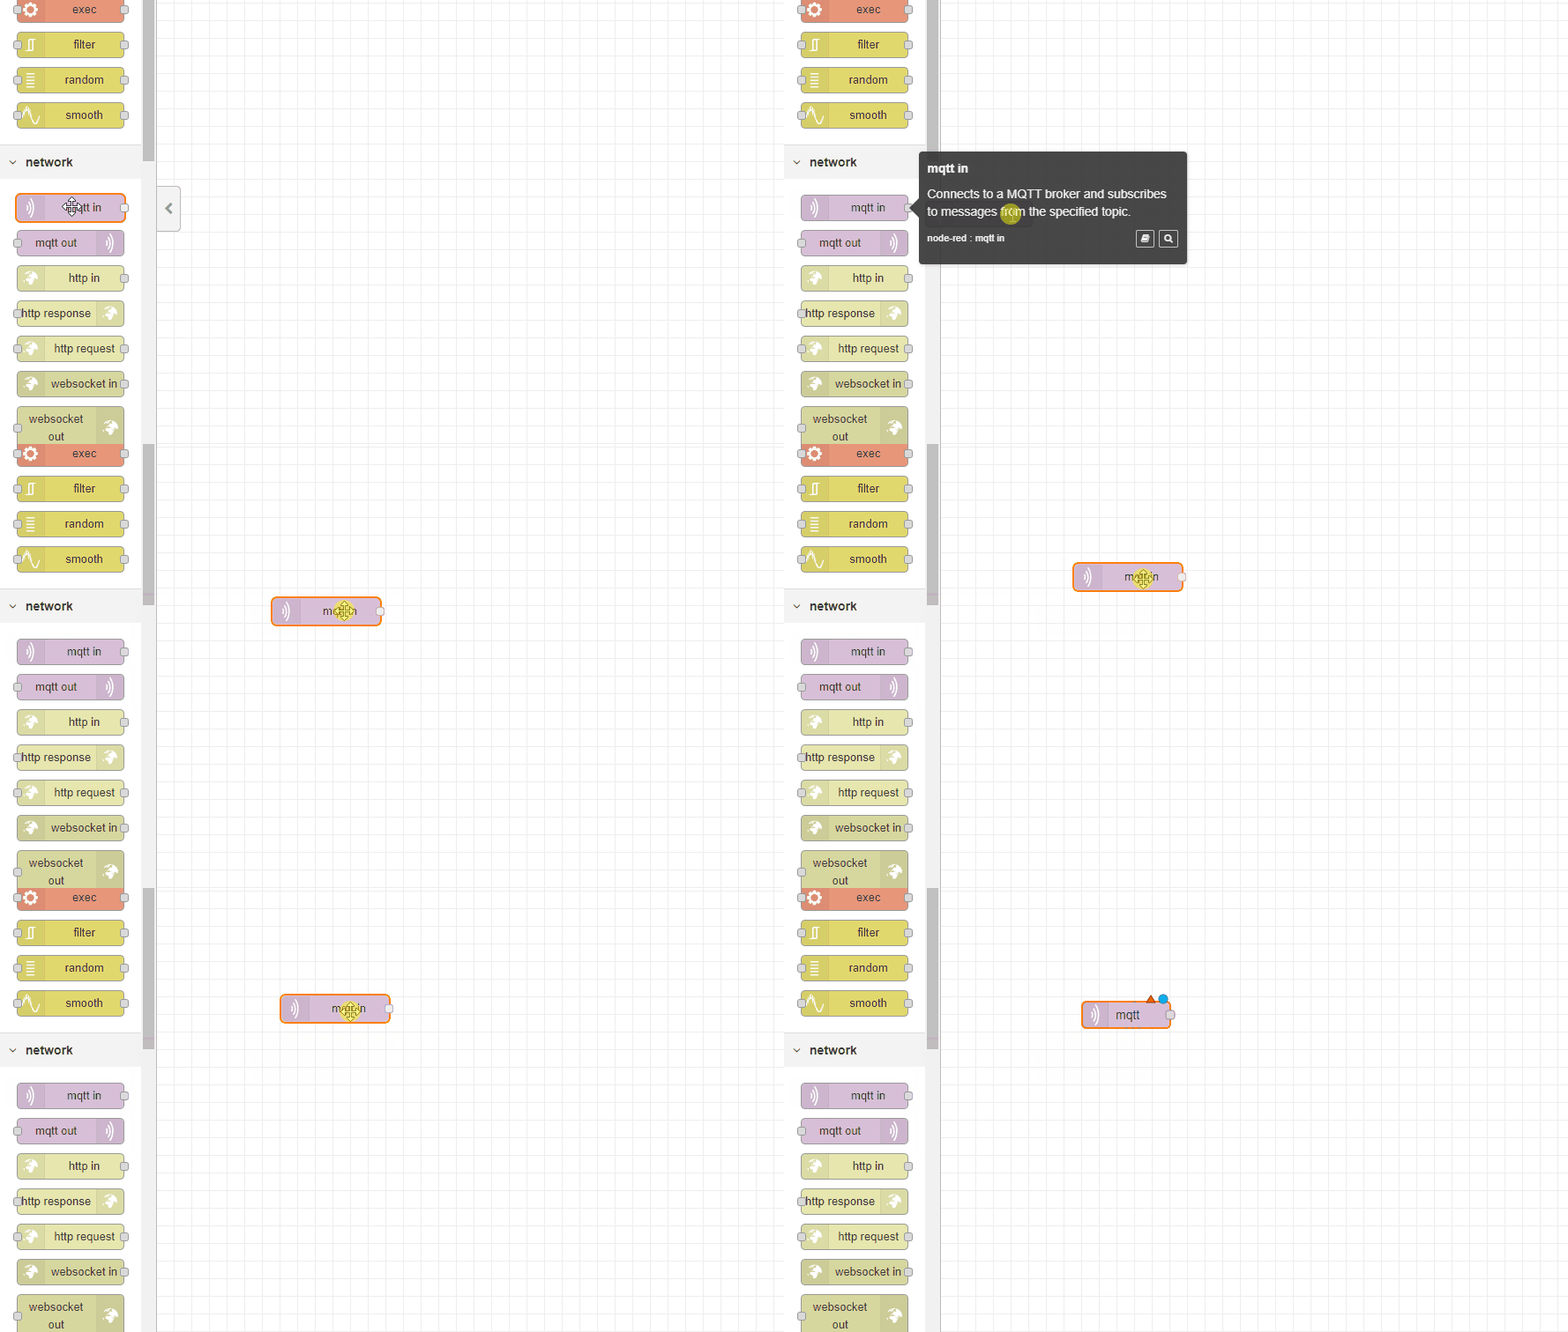
1. In Nodes, scroll down to Network and drag the MQTT In node into the flow.
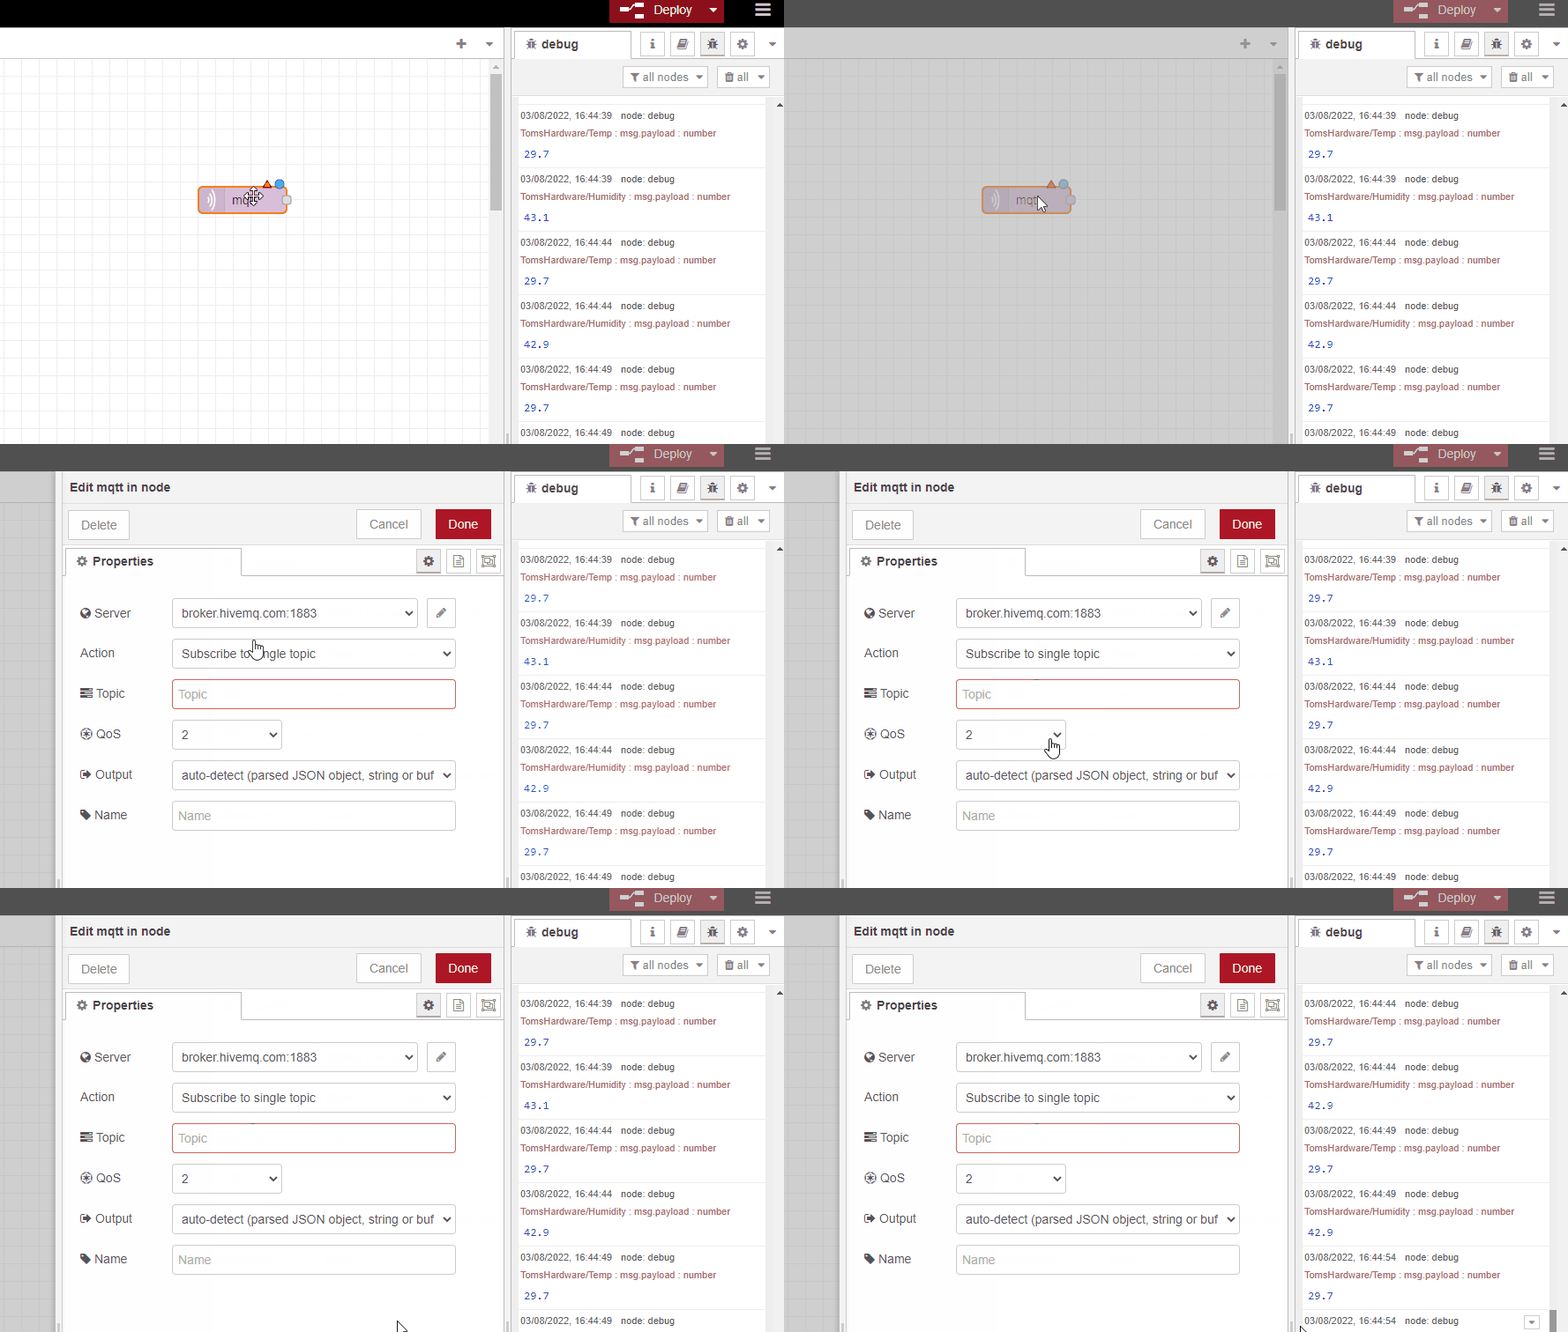
2. Double left click on the node to edit. The info / debug panel will see a pop-out dialog appear.
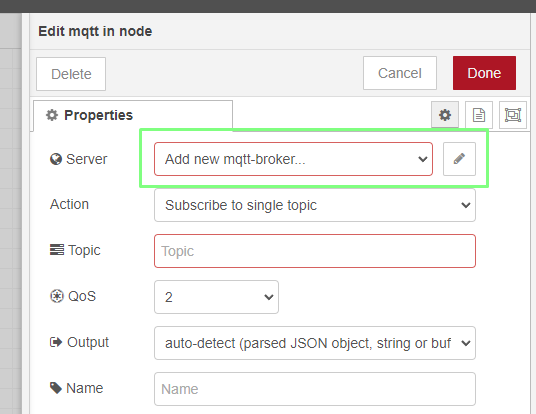
3. Under Server, select add new mqtt-broker and click on the edit button (pencil icon).
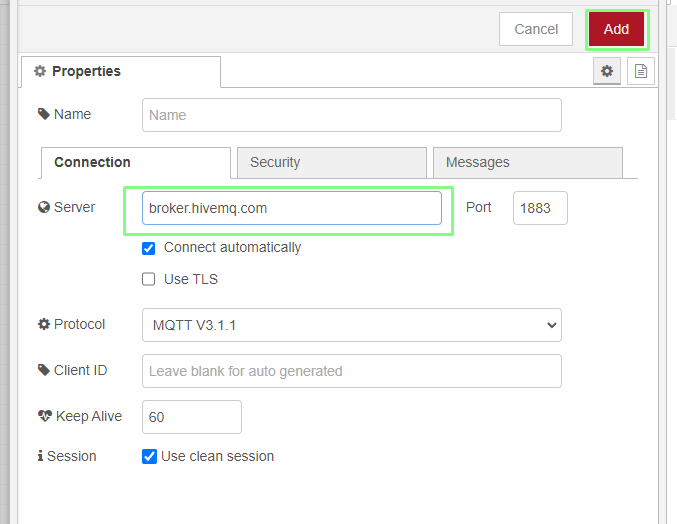
4. Set the Server to broker.hivemq.com and click Add. The default port for MQTT is 1883.
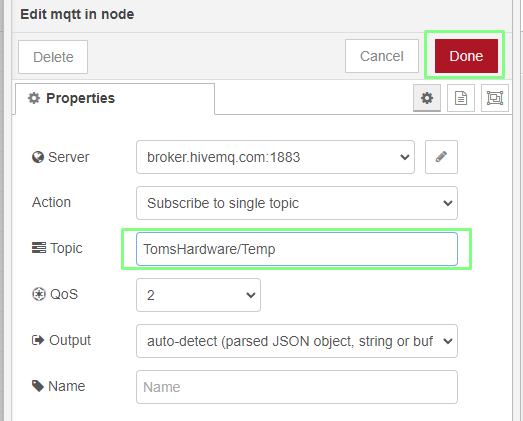
5. Set the Topic to TomsHardware/Temp and click Add. This is all we need to do to instruct Node-RED to subscribe to that topic, on HiveMQ’s broker.
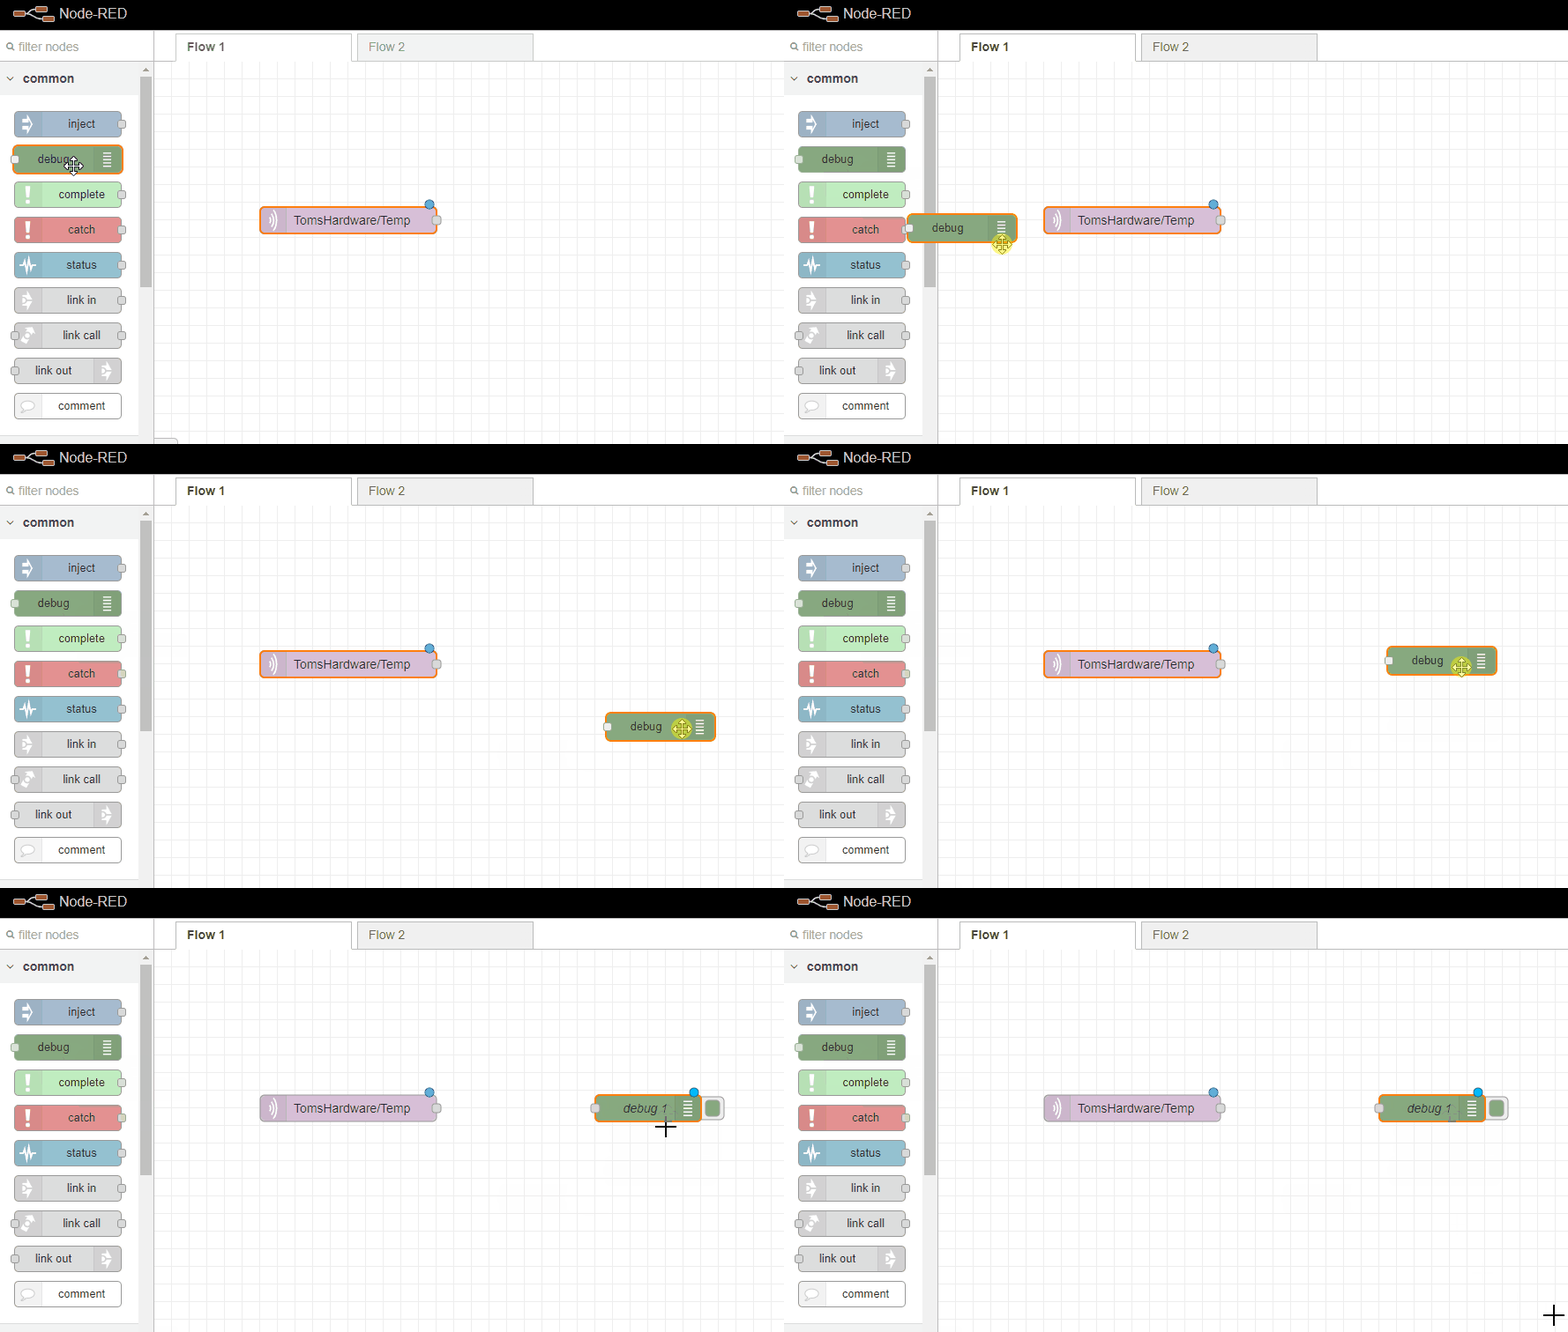
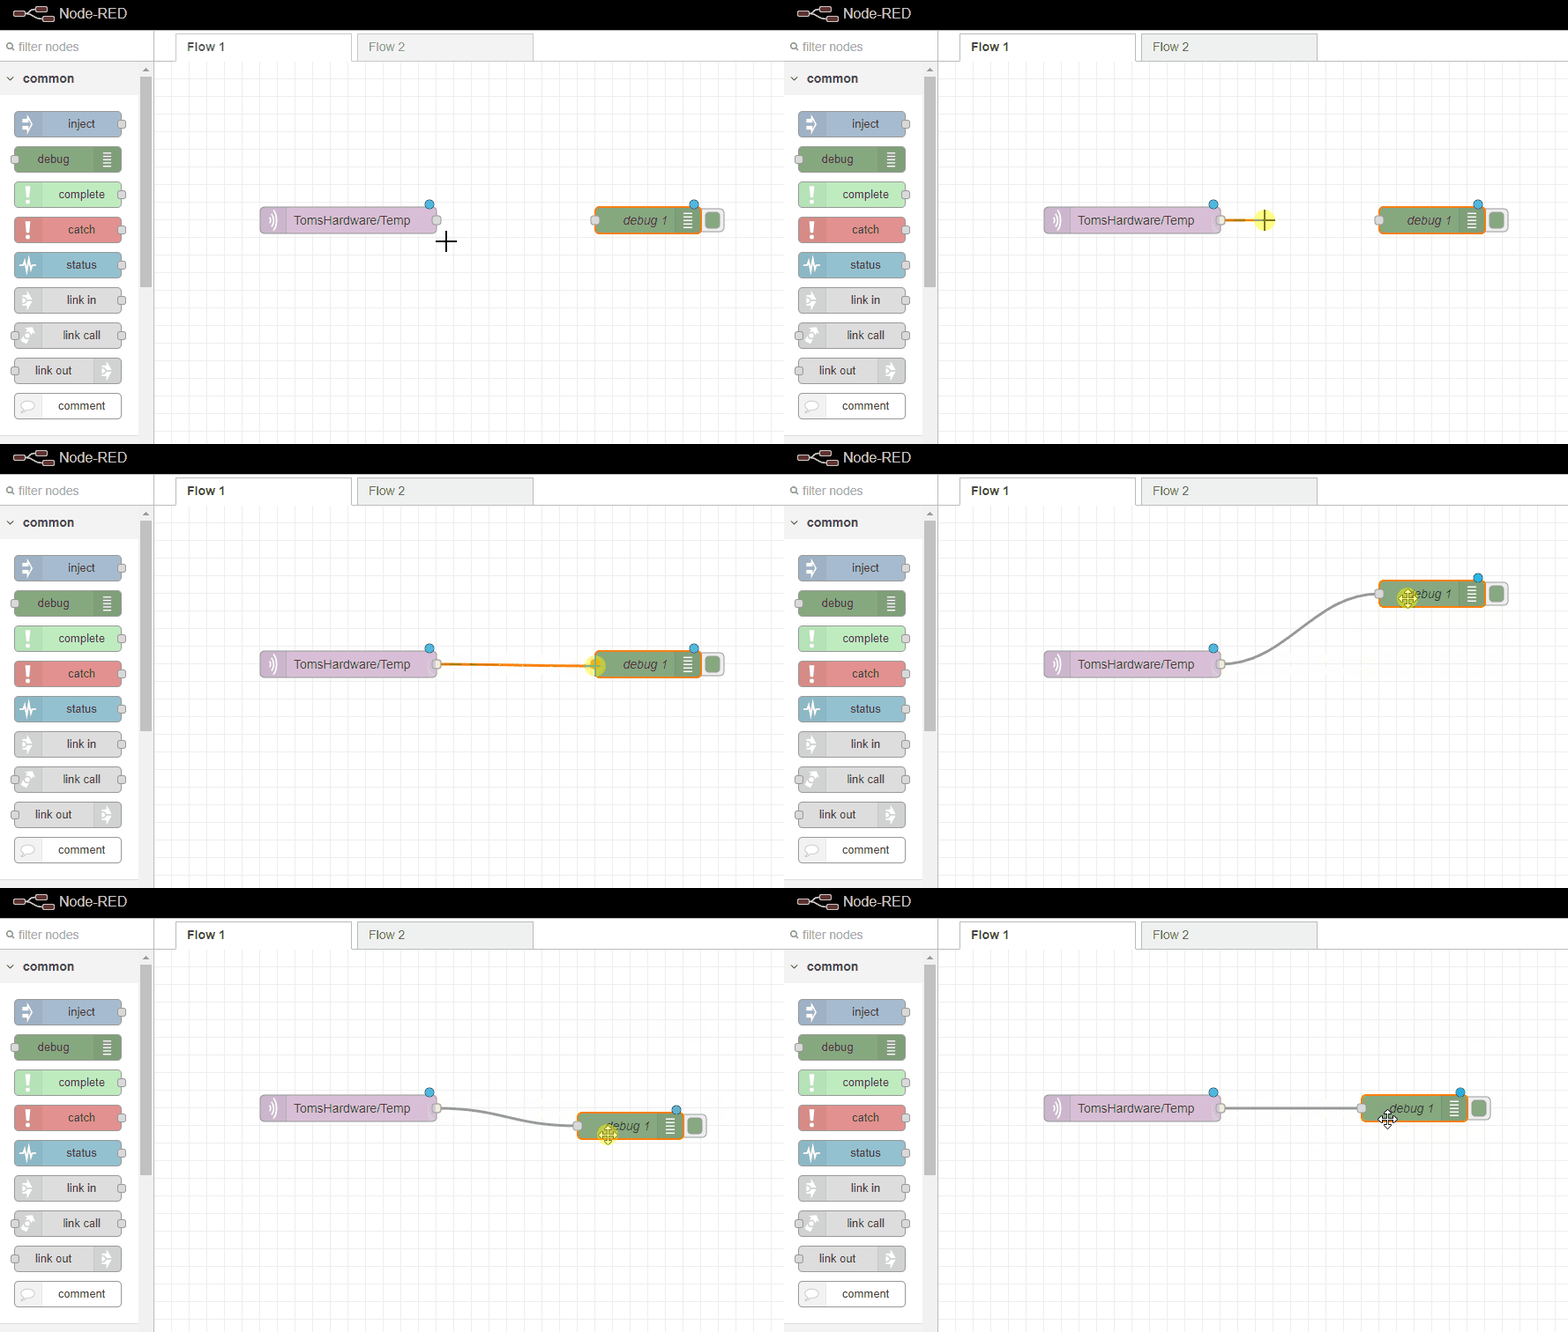
6. From Nodes, Common, drag debug into the flow.
7. Left click and hold to connect the output of the MQTT node to the input of the debug node.
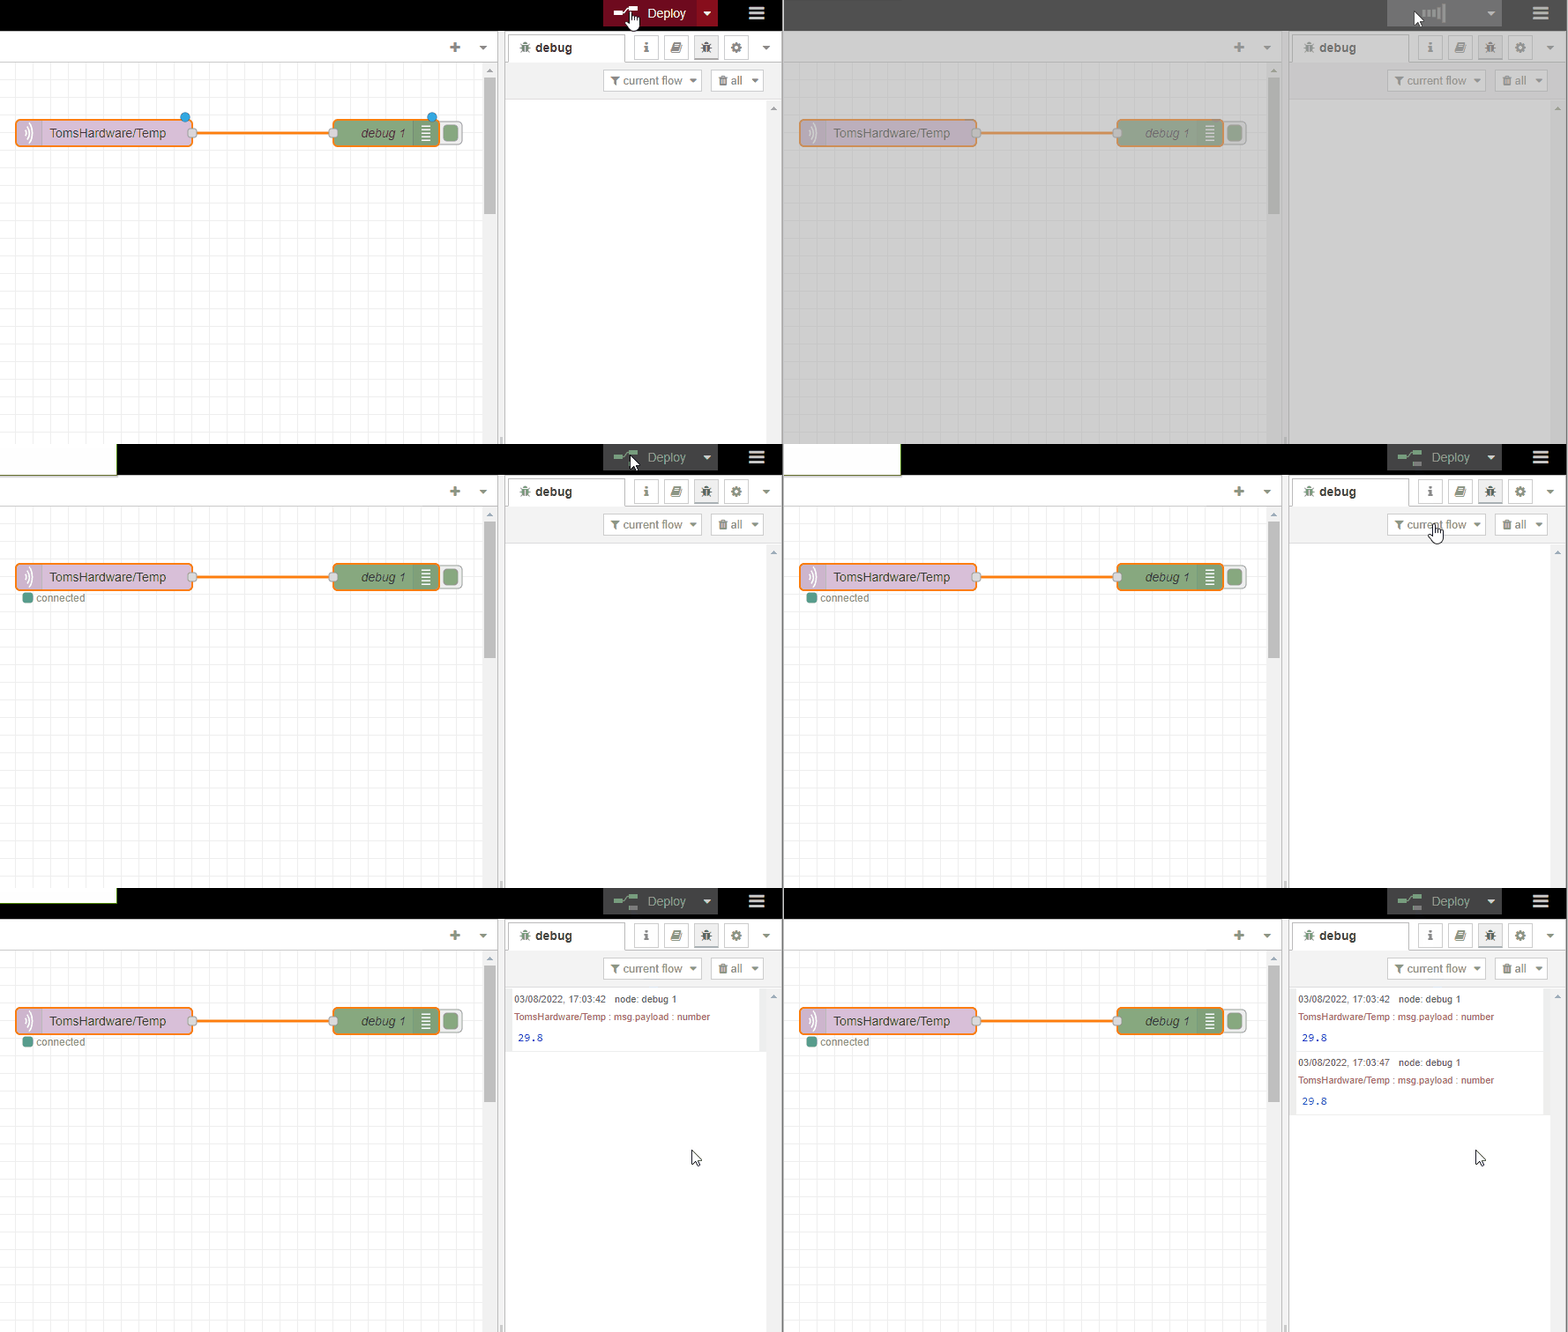
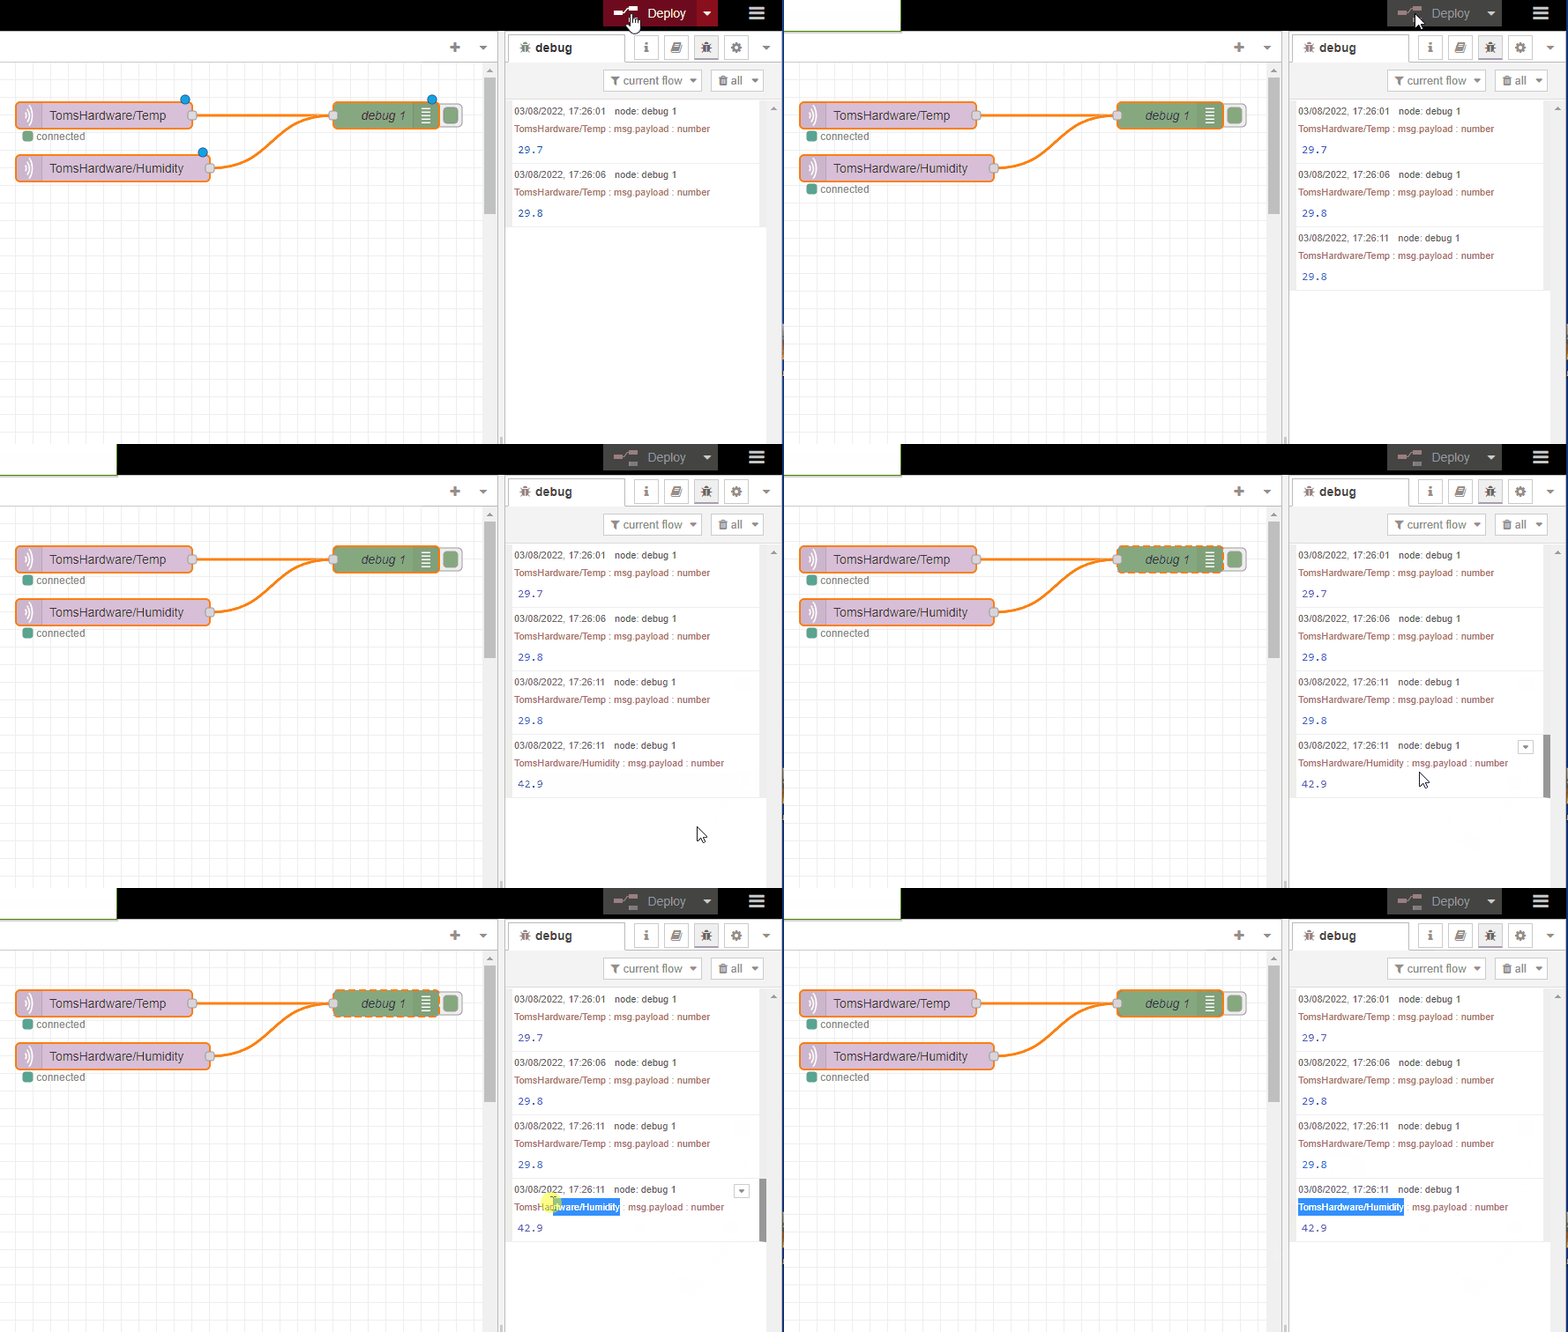
8. Click on Deploy (top right) to run the flow. Click on the debug tab (insect / bug icon) to see the output from MQTT.
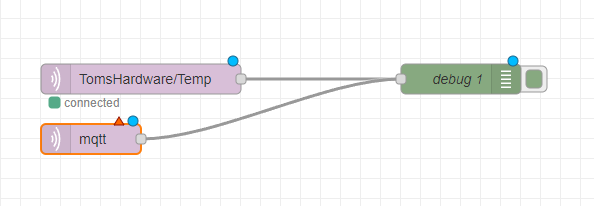
9. Drag another MQTT In node into the flow, and connect it to the debug node.
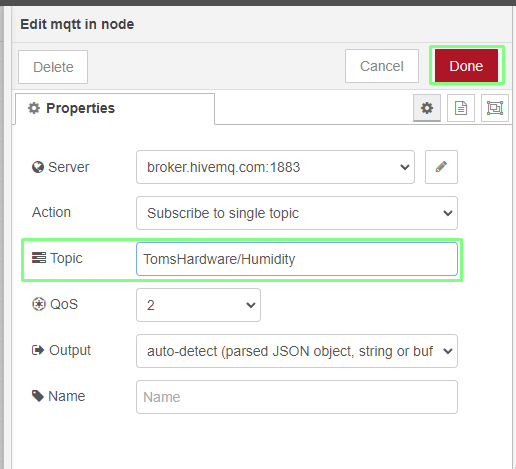
10. Double click on the node and set the Topic to TomsHardware/Humidity then click Done. The server will be pre-populated.
11. Click on Deploy to run the new flow. We will now see the temperature and humidity data in the debug console.
We have proven that our Pico W is publishing data via MQTT, and that our Node-RED flow can subscribe and print the raw data to the debug console. Now we move on to build our own web application. For this we will create a dashboard, and populate it with two gauges, and two charts all of which use the raw MQTT data.
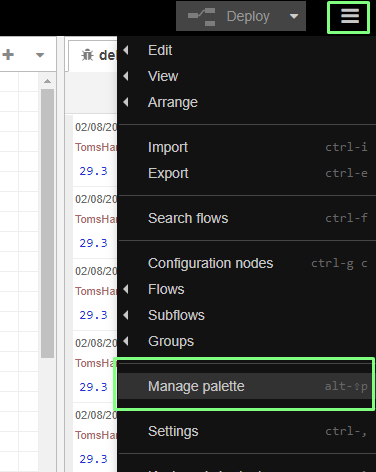
1. Click on the hamburger menu in the top right corner, and select Manage Palette.
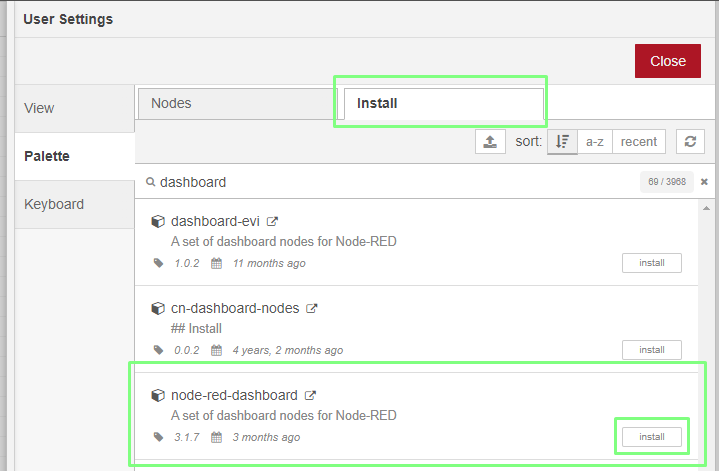
2. Click on the Install tab and search for “dashboard”. Look for “node-red-dashboard” and click Install.
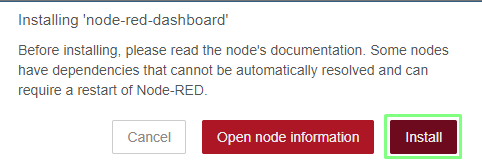
3. Click Install to begin the installation. A new selection of nodes will appear in the nodes column.
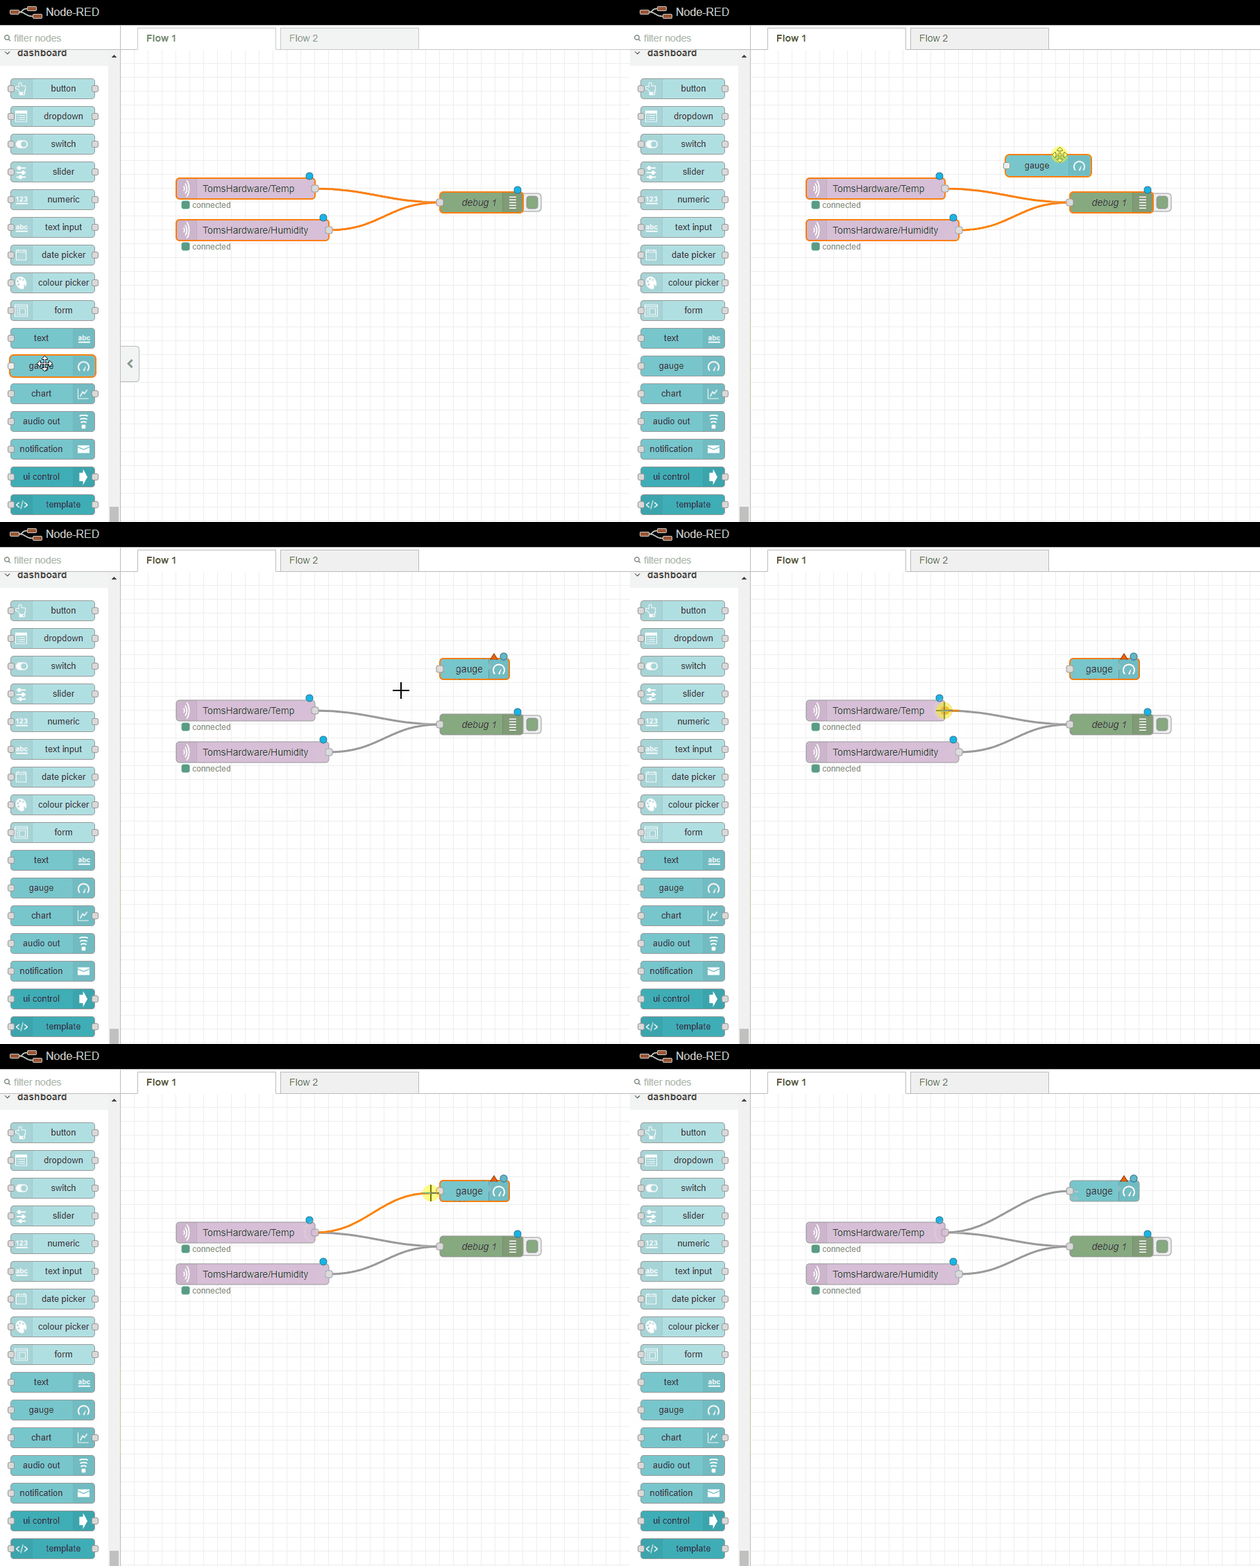
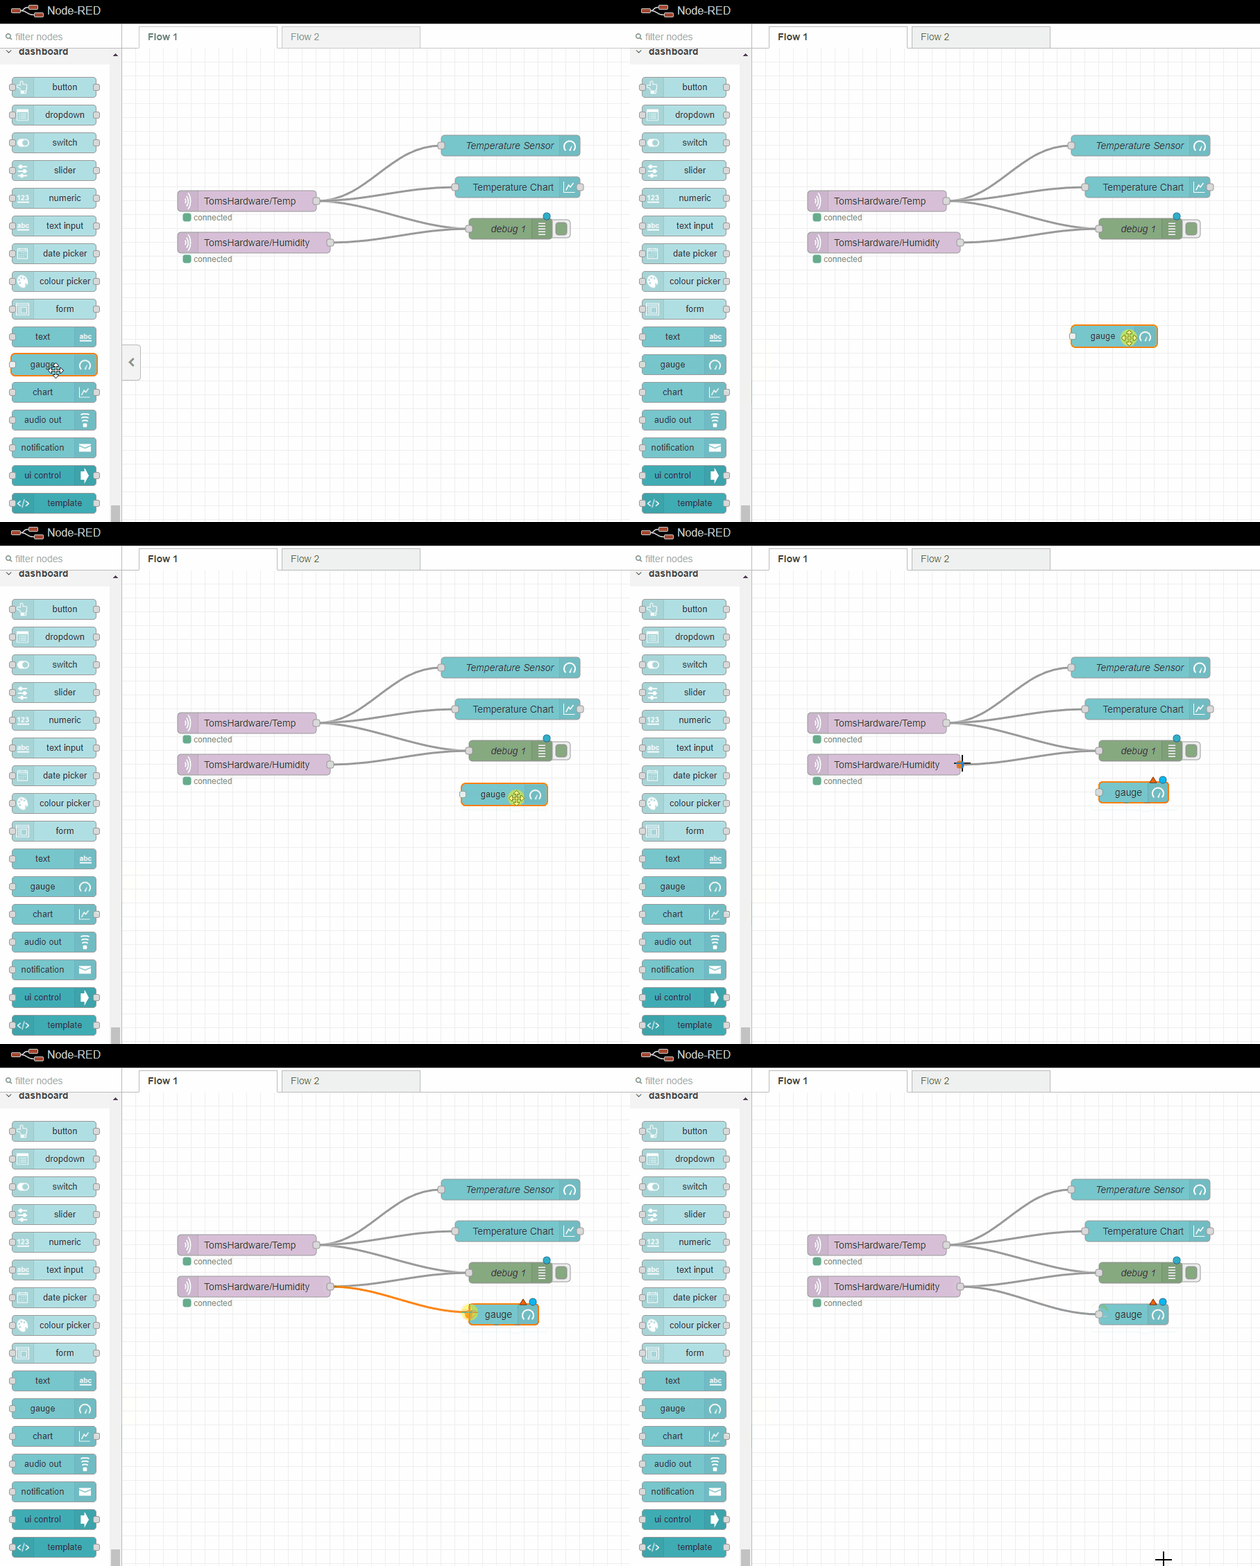
4. Scroll down the nodes to “dashboard” and drag a gauge node into the flow. Connect the gauge to the MQTT Temperature node.
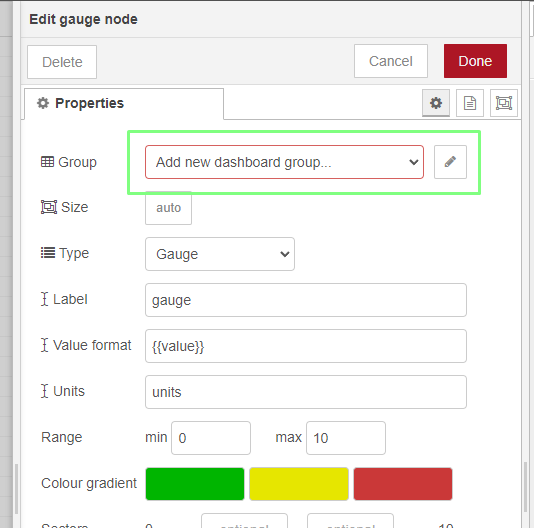
5. Double left click on the gauge node to edit, and in the new dialog select Add new dashboard group and click on the edit (pencil) icon.
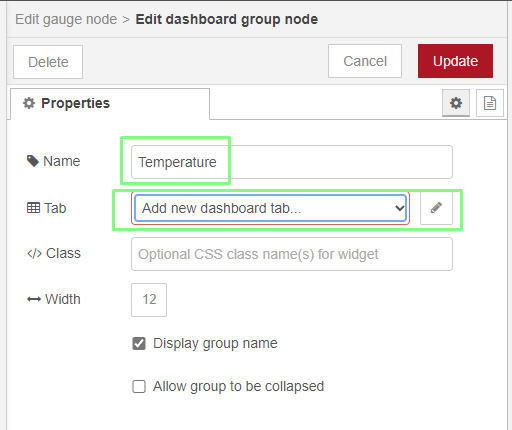
6. Set the group name to Temperature, and then click on “Add new dashboard tab” and the edit (pencil) icon. Groups are used to collect widgets and are used to enable layouts to be tweaked.
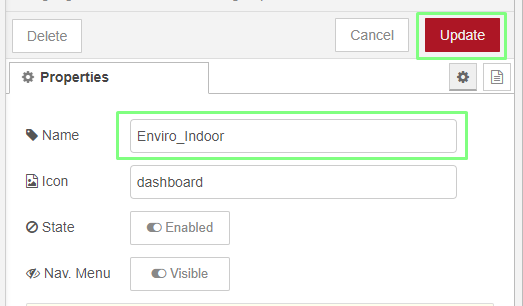
7. Set the dashboard tab name to Enviro_Indoor and then click Add / Update. Dashboard tabs are essentially tabs in the same manner as browser tabs. But these tabs exist inside a Node-RED window. We called our tab Enviro_Indoor, as that is the board we are using, this can be changed to suit your own project.
8. Click on Add to return to the Properties dialog.
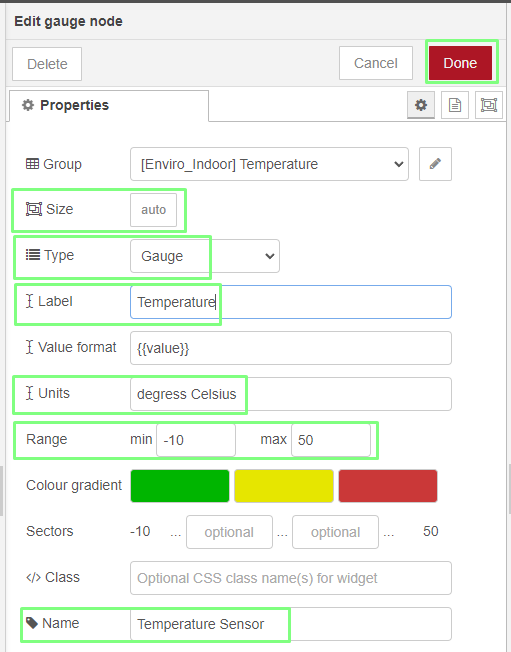
9. Set the Properties to Size: Auto, Label: Temperature, Units: degrees Celsius, Range: -10 to 50, Name: Temperature Sensor. Then click Done. The temperature is displayed in Celsius by default. Change the range to suit your location.
10. Click on Deploy to run the flow. The MQTT is still displayed in the debug console.
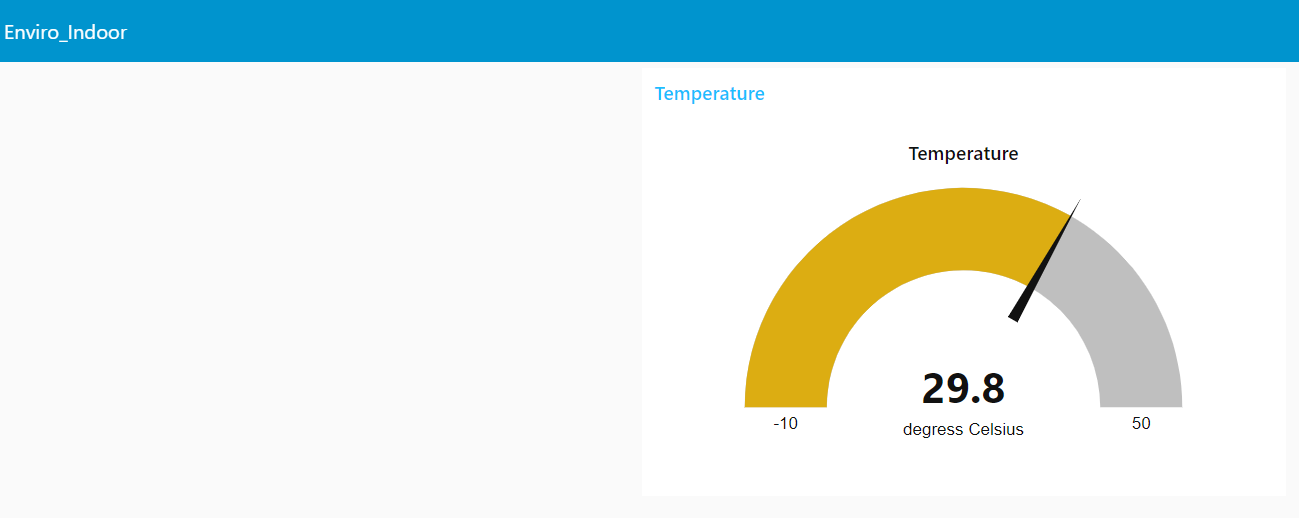
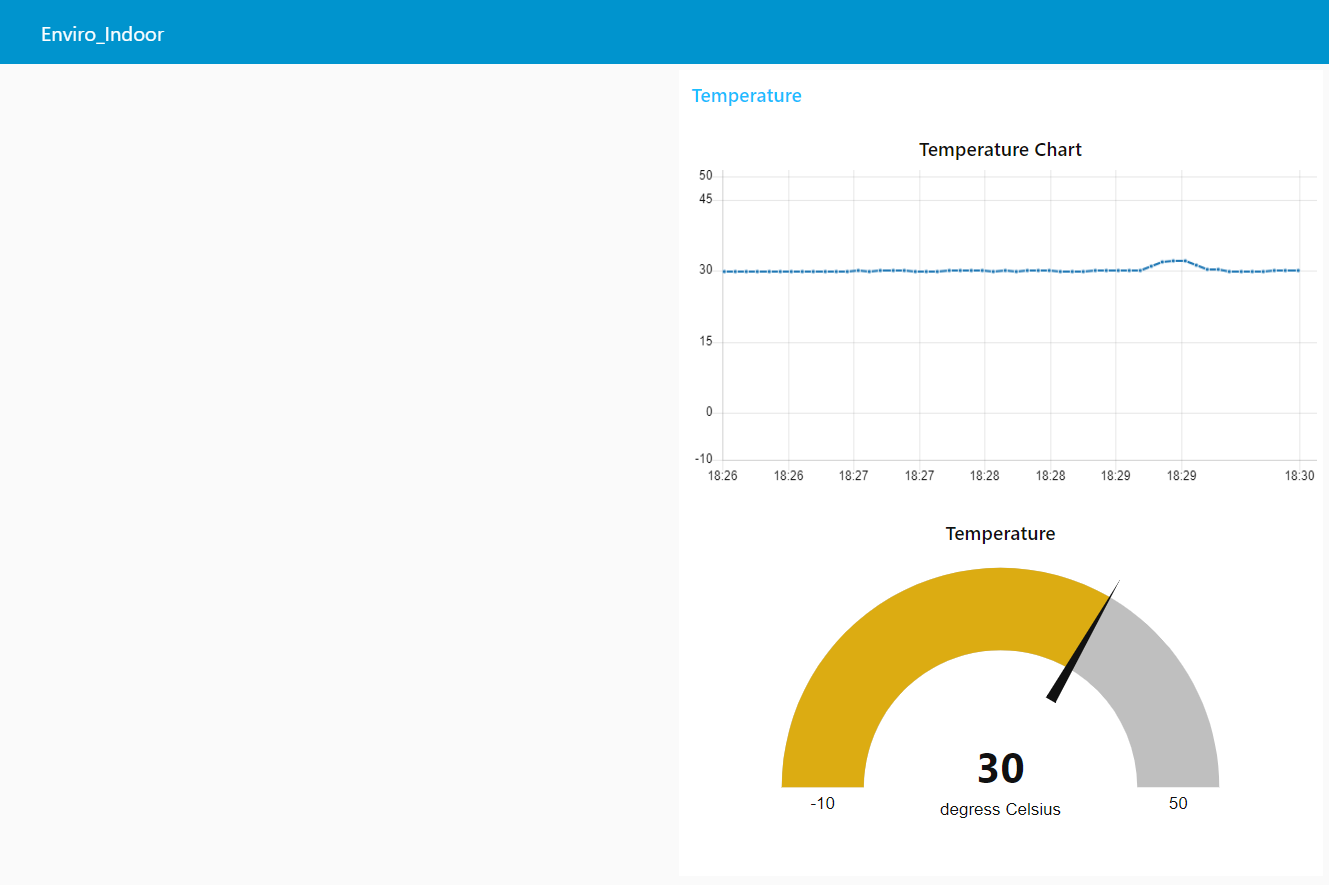
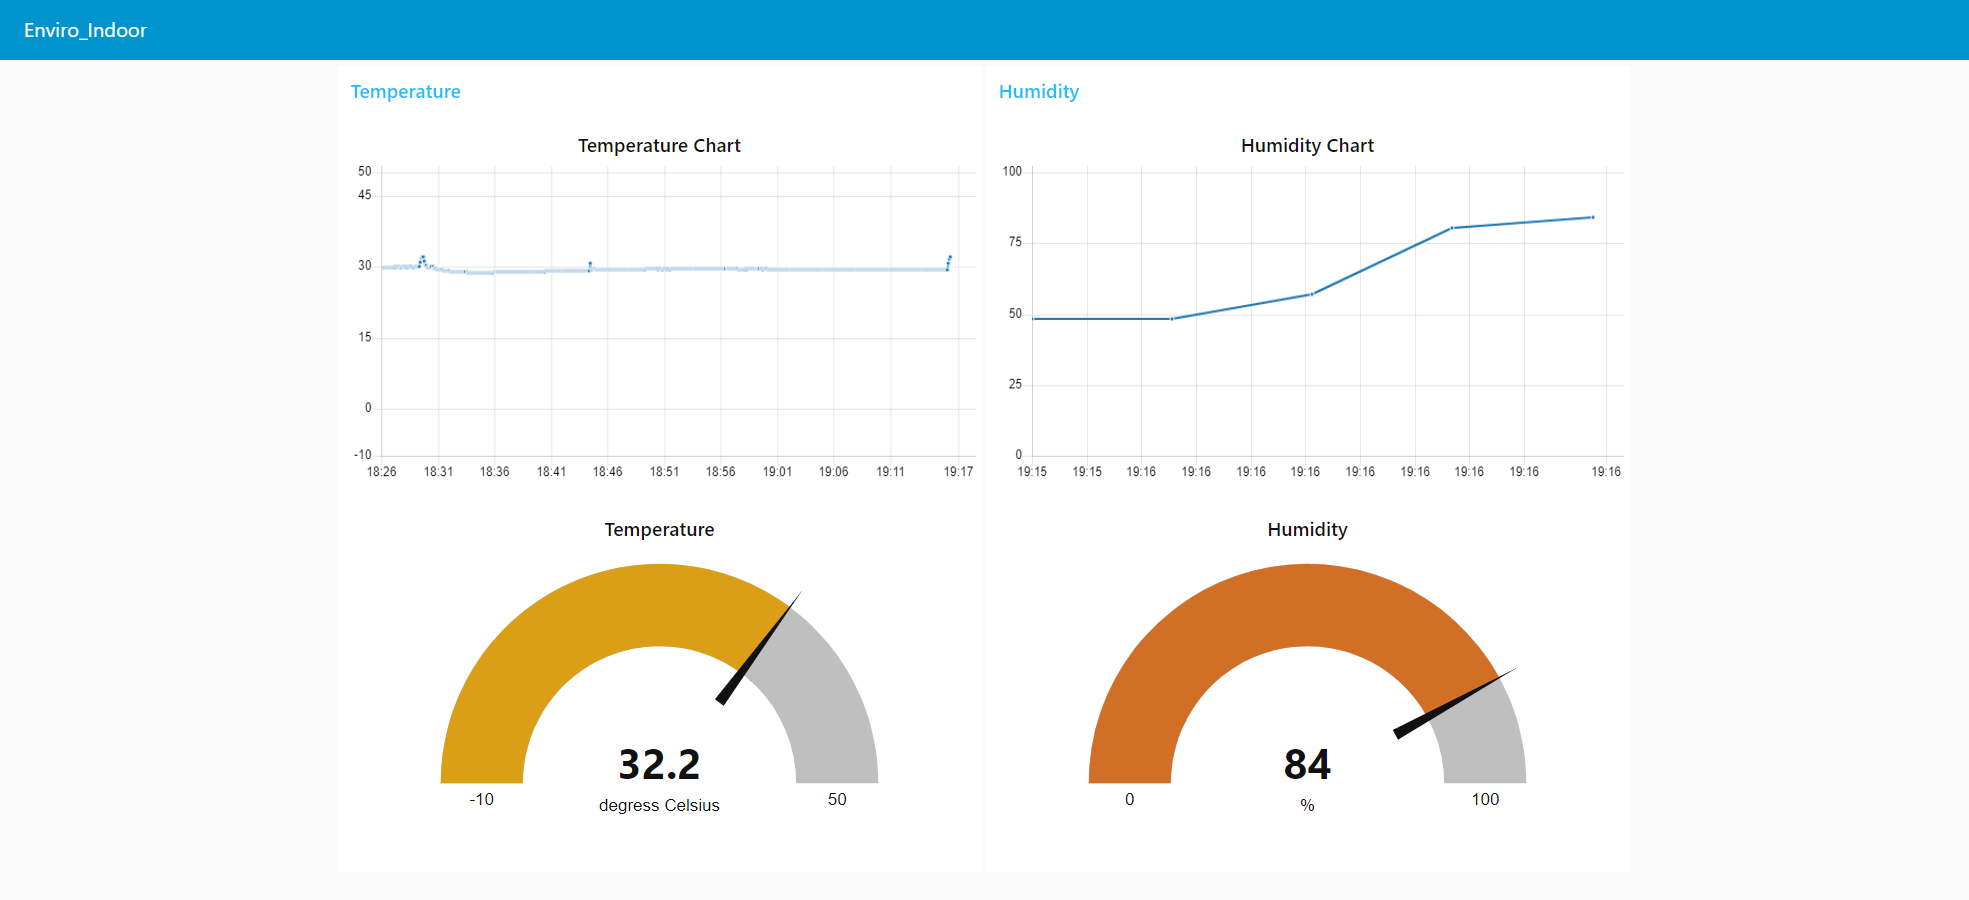
11. Open a new browser tab and go to raspberrypi.local:1880/ui to see the web interface.
Adding Humidity Data
Now we add a temperature chart which will show the temperature over a set period of time. This is useful for viewing temperature differences over time, versus the gauge which provides a view of the current temperature.
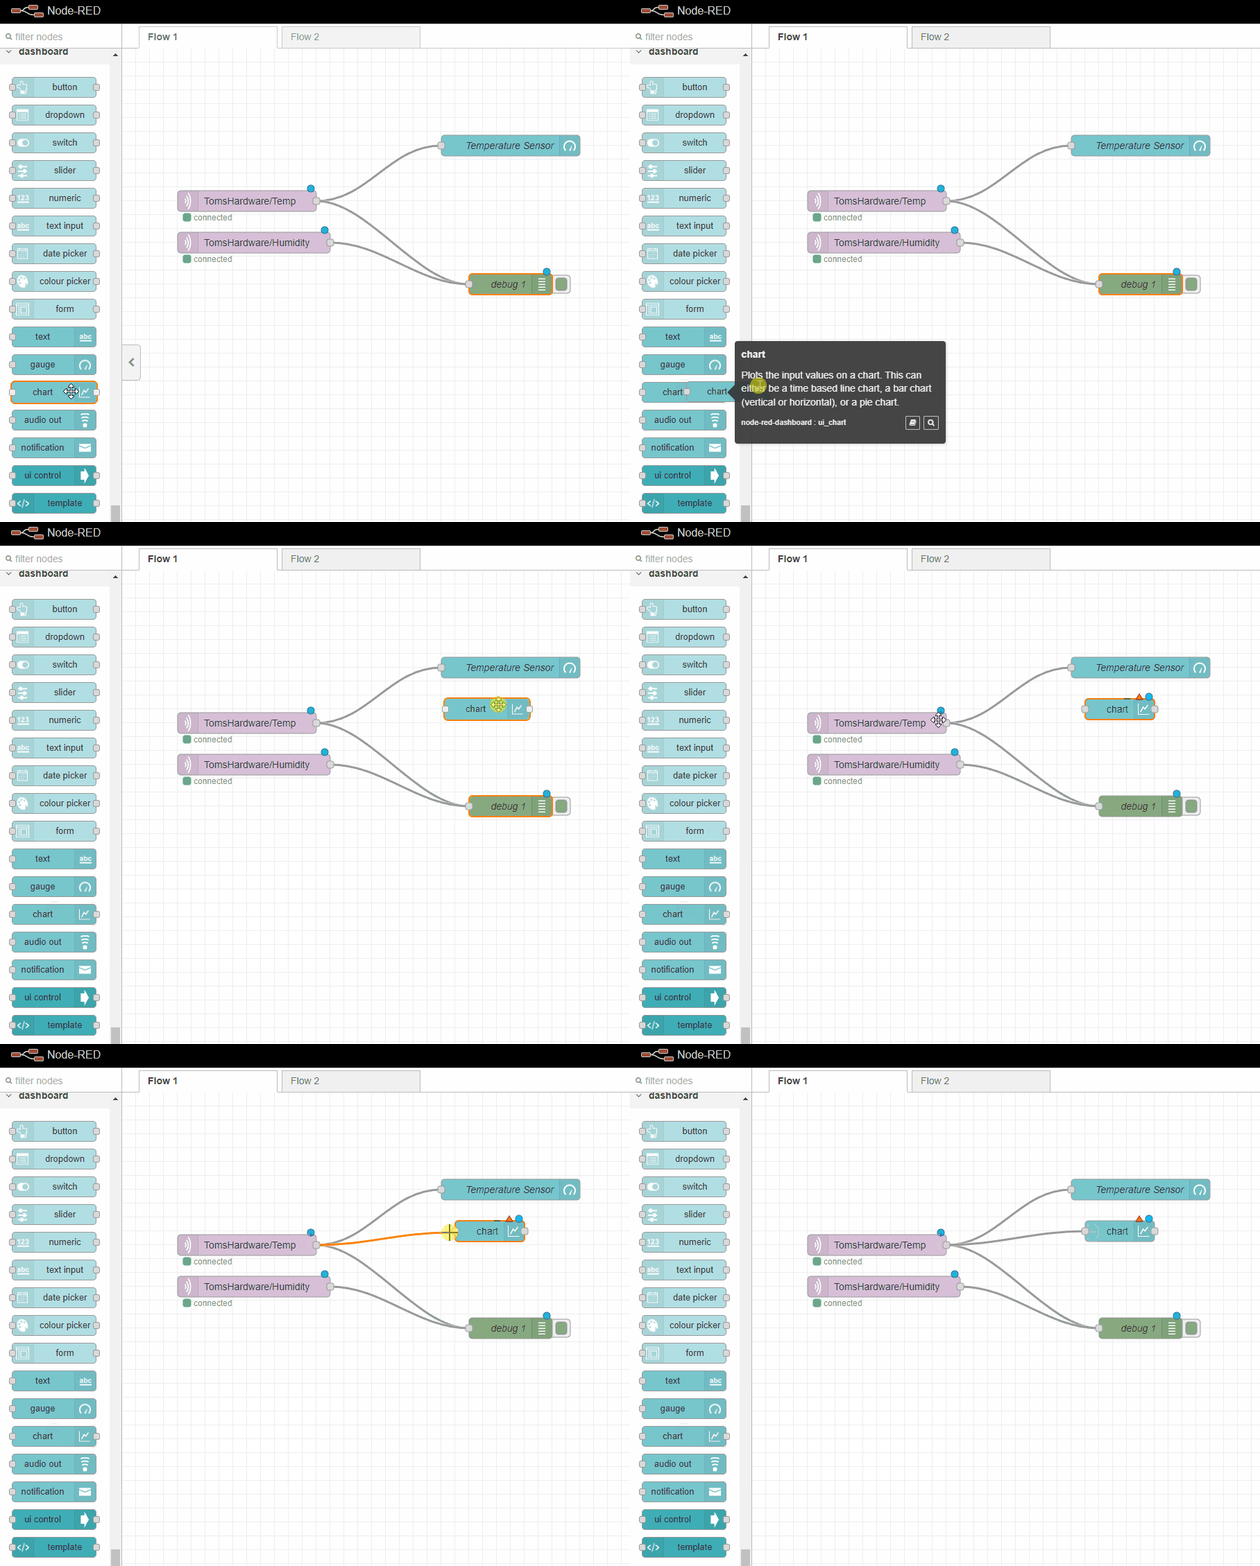
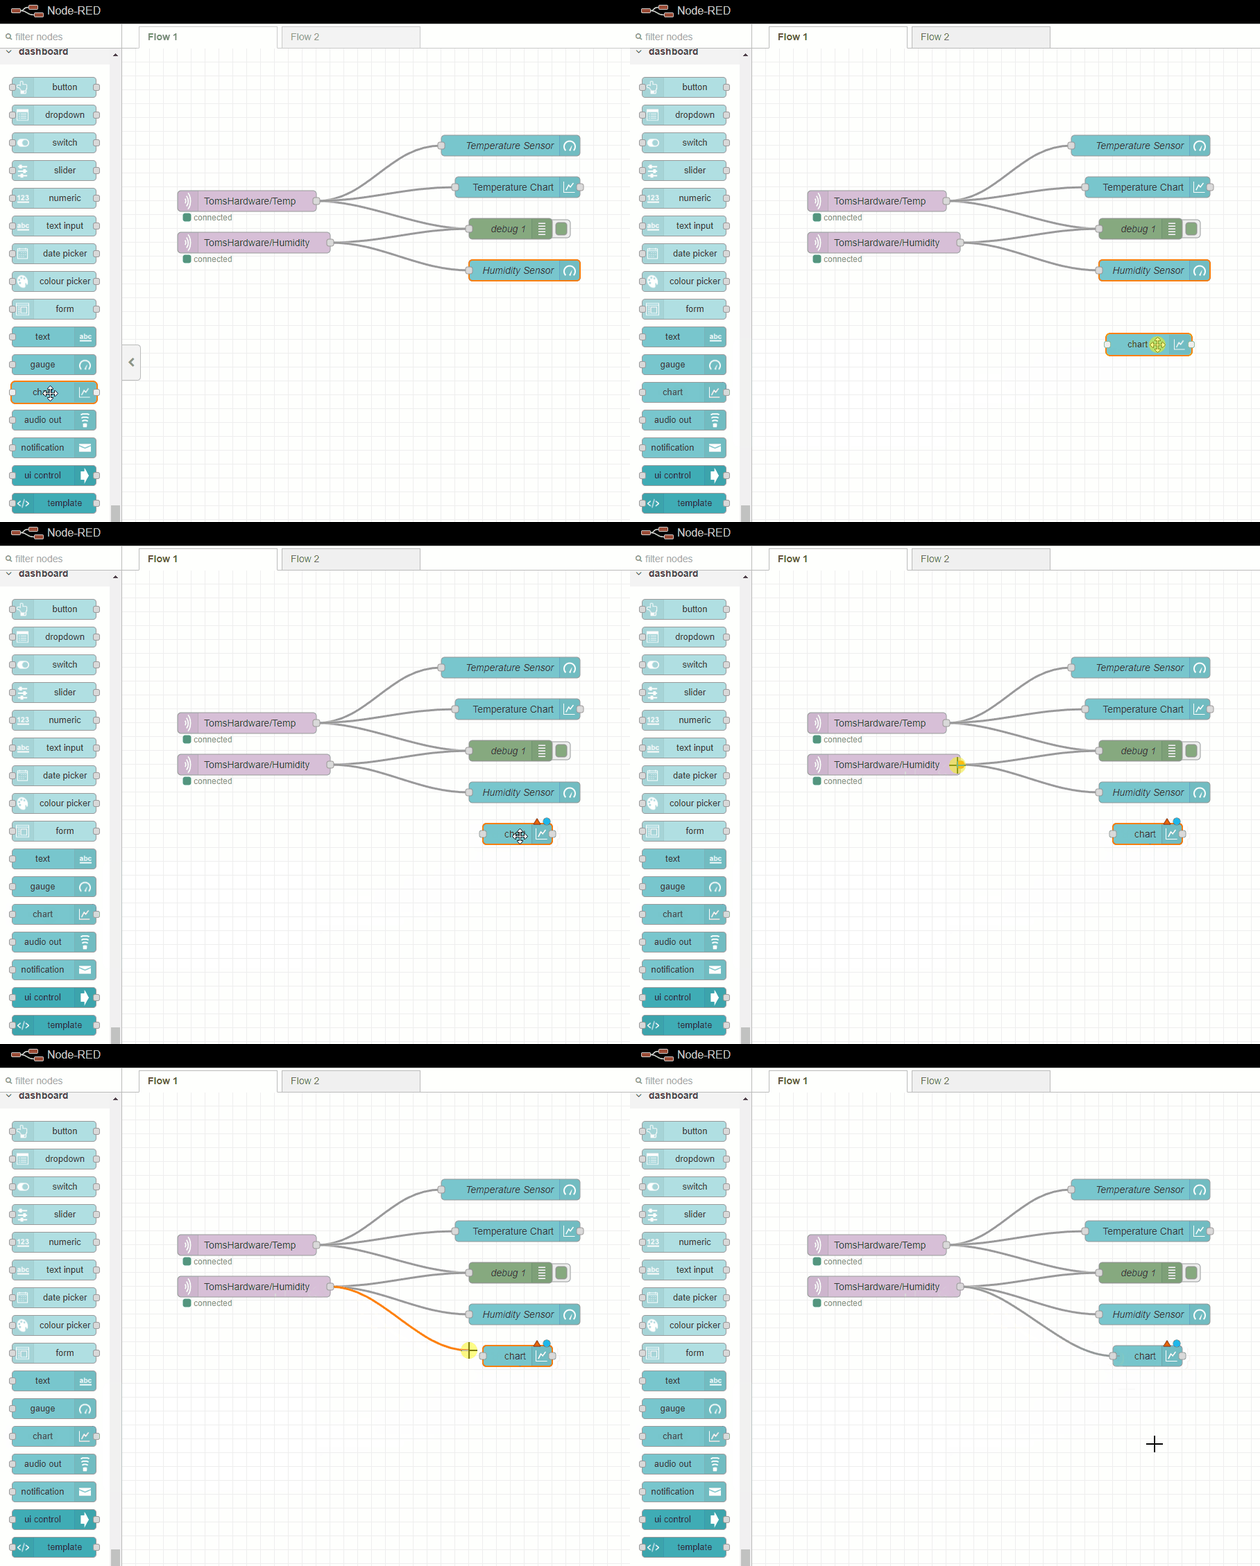
1. From the dashboard nodes, drag a chart node into the flow and connect it to the MQTT temperature node.
2. Double left click on the chart node to edit.
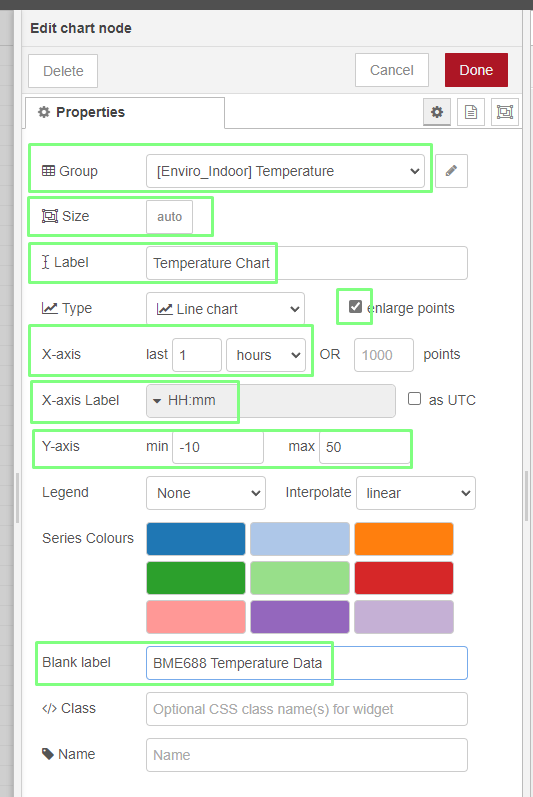
3. Set the chart node as follows. Group: Enviro_Indoor Temperature, Size: Auto, Label: Temperature Chart, Enlarge points, X-axis: 1 hours, X-axis label: HH:mm, y-axis: -10 to 50, Blank label: BME688 Temperature Data. Then Click Done.
4. Click on Deploy to run the flow.
5. Open the web interface tab to see the chart. It will update every five seconds.
With the temperature data now added to the dashboard, our focus now switches to humidity data. We are going to repeat the same process, but with a new group, Humidity, that will house a gauge and chart to show the current and historical humidity data.
1. Scroll down the nodes to “dashboard” and drag a gauge node into the flow. Connect the gauge to the MQTT Humidity node.
2. Double left click on the gauge node to edit, and in the new dialog select Add new dashboard group and click on the edit (pencil) icon.
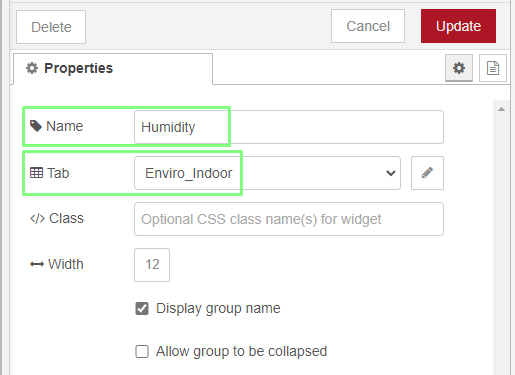
3. Set the group name to Humidity, and then ensure the Tab is set to Enviro_indoor. Click Add / Update to save.
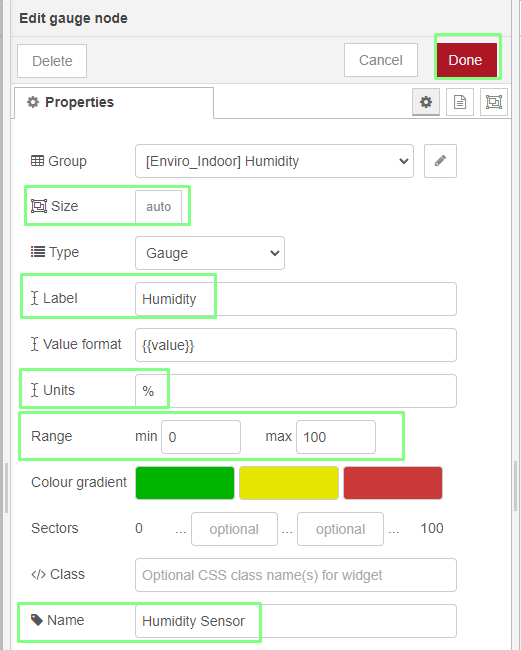
4. Set the Properties to Size: Auto, Label: Humidity, Units: %, Range:0 to 100, Name: Humidity Sensor. Then click Done.
5. Click on Deploy to run the flow.
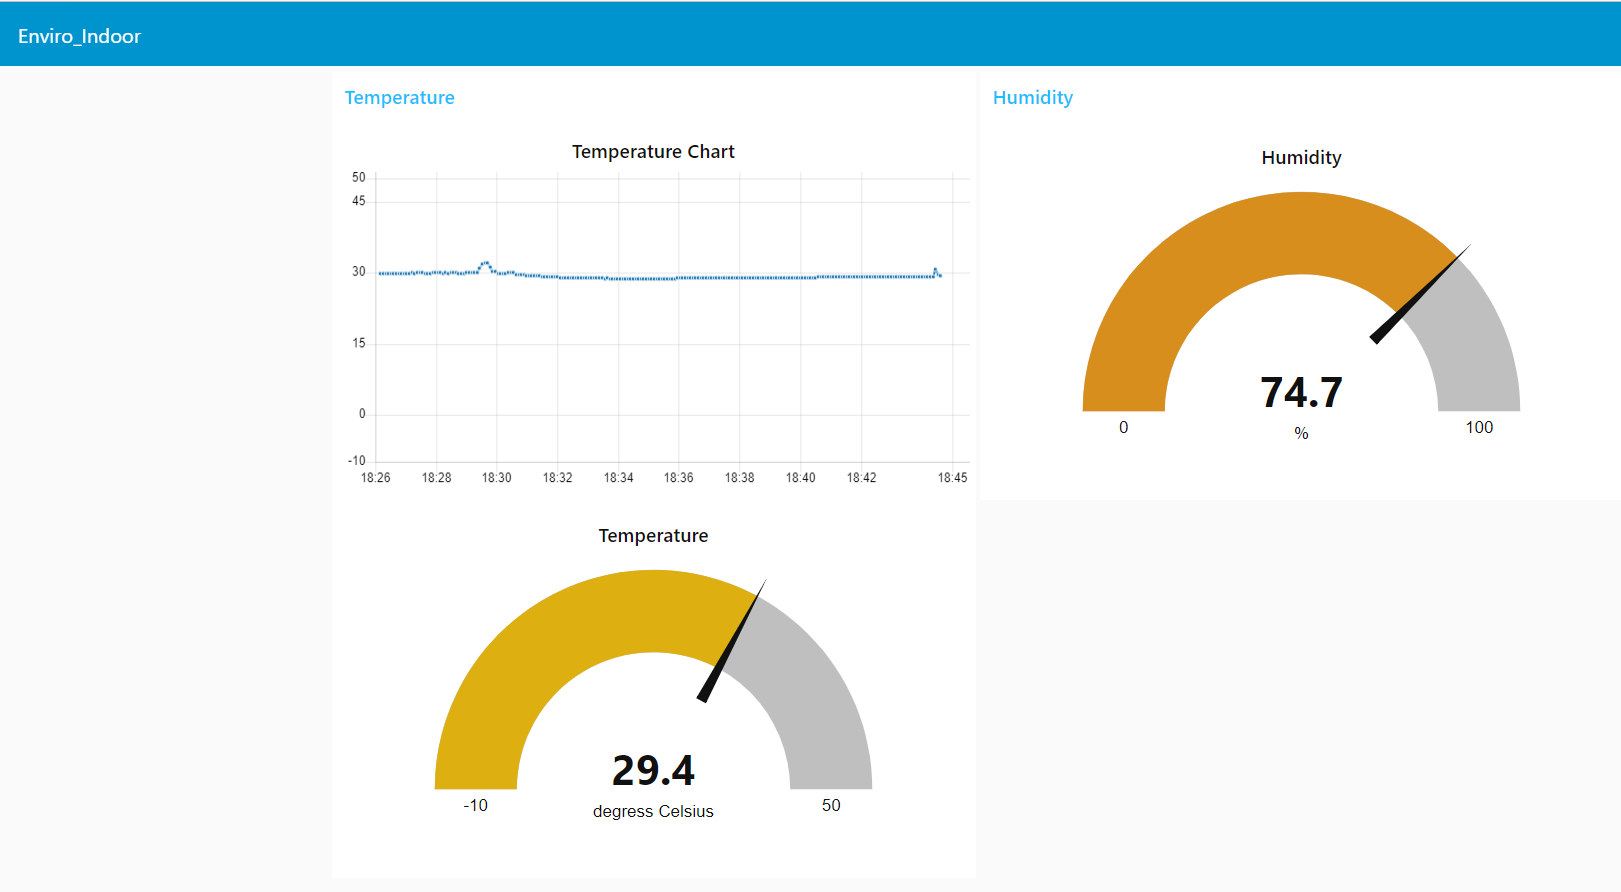
6. Open the web interface tab to see the chart. It will update every five seconds.
Now we add a humidity chart which will show the humidity over a set period of time. This is useful for viewing humidity changes over time, versus the gauge which provides a view of the current humidity.
7. From the dashboard nodes, drag a chart node into the flow and connect it to the MQTT humidity node.
8. Double left click on the chart node to edit.
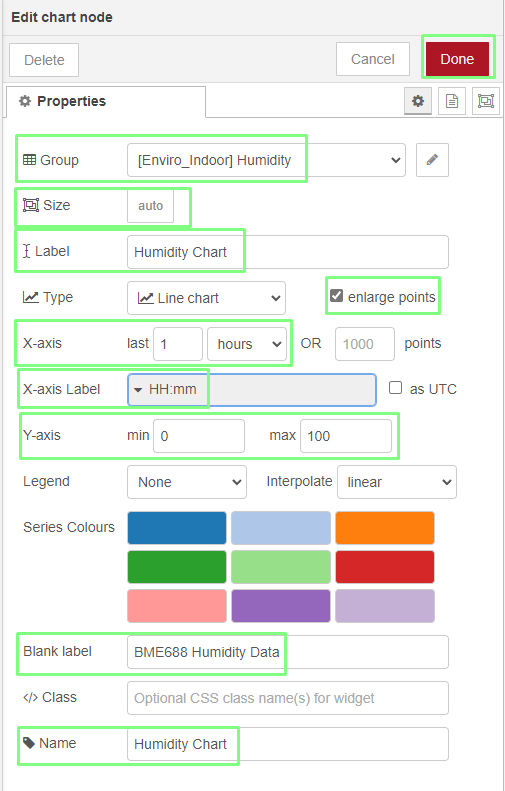
9. Set the chart node as follows. Group: Enviro_Indoor Temperature, Size: Auto, Label: Temperature Chart, Enlarge points, X-axis: 1 hours, X-axis label: HH:mm, y-axis: -10 to 50, Blank label: BME688 Temperature Data, Name: Humidity Chart. Then Click Done.
10. Click on Deploy to run the flow.
11. Open the web interface tab to see the chart. It will update every five seconds.
The project is now complete. Our Raspberry Pi Pico W has been set to automatically connect to our Wi-Fi, publish data over MQTT. Our Raspberry Pi 4 running Node-RED is interpreting the MQTT data into a live dashboard, keeping us informed of the temperature and humidity in our home. Node-RED will auto-start when the Raspberry Pi boots, creating an appliance, ready to serve data at a moment's notice.

Les Pounder is an associate editor at Tom's Hardware. He is a creative technologist and for seven years has created projects to educate and inspire minds both young and old. He has worked with the Raspberry Pi Foundation to write and deliver their teacher training program "Picademy".
-
TerryYoung2003 Do you HAVE to send the data to the cloud if the devices are both on the same local WiFi network?Reply
I wanted to use this type of thing to have Pico Ws read various boat sensors (tank levels, temps and stuff) and send that data to a central Raspberry Pi 4. The issue with how you have this is that when we're out sailing, we're often out of cell range, so the cloud isn't an option.
Given that I can already send simple data from the Pico W via a self-generated webpage, I was wondering if it could be streamed via maybe a particular IP : Port straight to Node Red on the central Pi 4, which is already reading marine NMEA data and sending it out over WiFi using Signal K.
