


Why you can trust Tom's Hardware Our expert reviewers spend hours testing and comparing products and services so you can choose the best for you. Find out more about how we test.
AMD Ryzen 9 9950X3D Power Consumption and Efficiency
We are now measuring CPU power consumption metrics at the EPS12V connector, so our new results are not comparable to the data in our prior reviews. We previously used software monitoring tools like AIDA64 and HWinfo for our power measurements. These tools scrape power consumption measurements directly from the motherboard's sensor loop, thus removing VRM inefficiencies from the values and presumably showing us exactly how much power the processor consumes.
However, motherboard OEMs can game these measurements, so we always did spot checks with various hardware-based measurement tools (Powenetics hardware or Passmark's In-Line PSU), and we've avoided using certain motherboards with unreliable power metrics in the past. We ultimately chose software monitoring because we can integrate it into our scripted tests, thus simplifying and speeding up the process, and it allows us to catch more granular workload data.
Intercepting power at the EPS12V connectors (the eight-pin connectors on the motherboard) is great for measuring power consumption. However, the main drawbacks are that it doesn't measure the true amount of power flowing into the processor due to VRM inefficiencies, typically in the range of 10 to 15% on high-end motherboards, and it wasn't easy to script a software trigger.
We finally have hardware-based power monitoring with Benchlab equipment that can be integrated and scripted into our test suite. You can see those results below. As a reminder, these values are measured before VRM inefficiencies are taken into account.


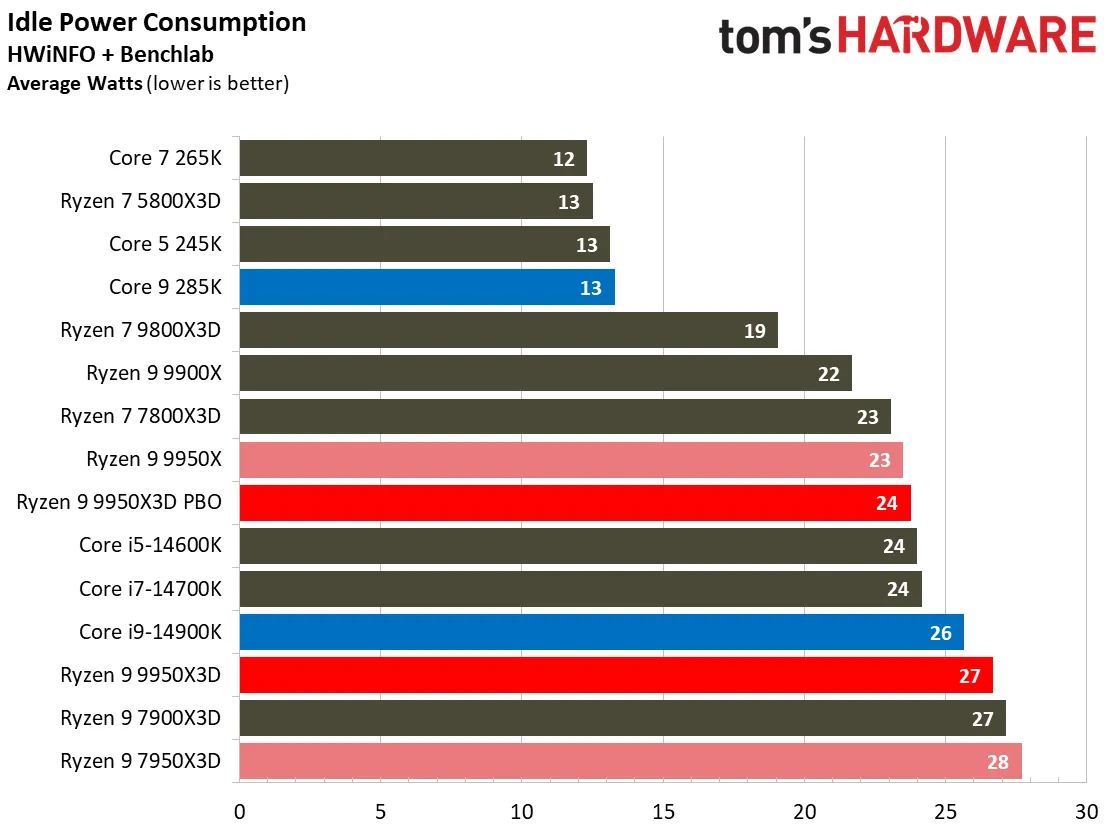


The Ryzen 9 9950X3D is a comparatively miserly chip, given the level of performance it delivers throughout our test suite. The chip peaked at 233W but hovered in the low 200s during most workloads.
In comparison, the Core i9-14900K is an egregious power guzzler, sucking down up to 383W during a Blender workload, and bear in mind this chip doesn’t match the 9950X3D in productivity workloads.
The Core Ultra 9 285K is more miserly than the 14900K, but it peaks at 325W, showing it can also have a voracious appetite. In most workloads, the 285K draws as much or more power than the 9950X3D in its overclocked PBO configuration.
As expected, we see a disproportionately large increase in power consumption for slim performance gains when we kick on the 9950X3D’s PBO feature. Given the small gains in gaming, PBO certainly isn’t worth it for gaming, but it is far more useful for those focused on productivity work.


The watts-per-FPS chart quantifies power efficiency during an x265 HandBrake workload. As you can see, the 9950X3D is near the top of the list with exceptional power efficiency, particularly given its 16-core design.
The last two slides take a slightly different look at power consumption by plotting the cumulative energy required for an x265 HandBrake and Blender workload. We plot this 'task energy' value in Kilojoules on the left side of the chart, with performance charted on the x-axis.
These workloads consist of a fixed amount of work, so we can plot the task energy against the performance during the job (bottom axis), thus generating a useful power chart. Faster compute performance and lower task energy are ideal. That means processors closest to the bottom right corner of the chart are the best.
As you can see, the newest AMD chips gather in that area during the HandBrake workload but migrate to the upper right corner in the Blender plot. Meanwhile, the 285K and other Arrow Lake chips greatly improve over their 14th-Gen predecessors.
AMD Ryzen 9 9950X3D Test Setup
We have moved from the RTX 4090 to the RTX 5090 FE for our game testing, which spurred an update to our gaming and application suites. We tested with the latest version of Microsoft Windows 24H2 (22631) and updated all drivers, BIOSes, and applications to the latest versions (sans y-cruncher). To speed up the testing process, we use XMP/EXPO as the default memory profiles for all tested configurations. The memory speeds used for each chip are shown in the table below.
We tested the Ryzen 9 9950X3D in standard stock trim and with the auto-overclocking Precision Boost Overdrive (PBO) feature enabled. We used the 'advanced' and 'motherboard' power settings for the PBO configuration with a 10X scalar and 200 MHz clock adjustment. We also dialed in a -15 all-core Curve Optimizer offset.
We used lifted power limits for the Intel processors, which results in higher power consumption and heat, but you get faster performance in exchange.
Microsoft has advised gamers to turn off several security features to boost gaming performance. For maximum performance, we disabled Virtualization Based Security (VBS) on all systems. Be aware that, due to hardware acceleration, some processor architectures handle virtualization better than others. This can provide a performance advantage when gaming with VBS enabled, but we haven't observed meaningful differences in our testing.
Intel Socket 1851 (Z890) | Core Ultra 9 285K, Ultra 7 265K, Ultra 5 245K |
Motherboard | MSI Z890 Ace |
RAM | 32GB G.Skill Trident Z5 RGB DDR5-7200 |
Intel Socket 1700 DDR5 (Z790) | Core i9-14900K, i7-14700K, Core i5-14600K |
Motherboard | MSI Z790 Carbon Wifi |
RAM | 32GB G.Skill Trident Z5 RGB DDR5-7200 |
AMD Socket AM5 (X670E) | Ryzen 9 9950X3D, Ryzen 7 9800X3D, Ryzen 9 9900X, Ryzen 9 9950X, Ryzen 7 7800X3D, Ryzen 9 7900X3D, Ryzen 9 7950X3D |
Motherboard | MSI MPG X870E Carbon WiFi |
RAM | 32GB G.Skill Trident Z5 Neo DDR5-6000 |
AMD Socket AM4 (X570) | Ryzen 7 5800X3D |
Motherboard | MSI MEG X570 Godlike |
RAM | 2x 8GB G.Skill Trident Z Royal DDR4-3600 |
All Systems | 2TB Sabrent Rocket 4 Plus, Silverstone ST1100-TI, Open Benchtable, Arctic MX-4 TIM, Windows 11 Pro |
Gaming GPU | Nvidia RTX 5090 FE |
Application GPUs | Nvidia GeForce RTX 2080 Ti FE |
Cooling | Corsair iCue Link H150i RGB |
Note: | Microsoft advises gamers to disable several security features to boost gaming performance. As such, we disabled secure boot, virtualization support, and fTPM/PTT. |
