Why you can trust Tom's Hardware Our expert reviewers spend hours testing and comparing products and services so you can choose the best for you. Find out more about how we test.
Benchmark Results
Our standard benchmarks and power tests are performed using the CPU’s stock frequencies (including any default boost/turbo) with all power-saving features enabled. We set optimized defaults in the BIOS and the memory by enabling the XMP profile. For this baseline testing, the Windows power scheme is set to Balanced (default) so the PC idles appropriately.
Synthetic Benchmarks
Synthetics provide a great way to determine how a board runs, as identical settings should produce similar performance results. Turbo boost wattage and advanced memory timings are places where motherboard makers can still optimize for stability or performance, though, and those settings can impact some testing.


For our first Z890 review, due to time limitations, we could only capture a couple of motherboards' worth of data for launch day, but we will add more as time goes on. From what we see in most of these tests, our Core Ultra 9 285K CPU is performant, beating out AMD’s Ryzen 9 9900X (as expected) and trading punches with the Core i9 14900K, depending on the tests. As we’ve seen in past generations, the results are all quite close.
Timed Applications


Timed applications show a bit more of a difference, especially in the Corona tests, where the new platform is slower than the last-gen Intel by a notable amount. LAME testing is closer, at least with the Z890 Ace, while the Asus falls behind. Differences found in the Handbrake tests among motherboards are negligible at this time.
3D Games and 3DMark


Starting with the launch of Zen 5, we’ve updated our game and 3DMark tests. For the latter, we’ve updated to Steel Nomad and Speed Way. For actual games, we kept the F1 racing game but have upgraded to F1 24. We also dropped Far Cry 6 in favor of an even more popular and good-looking game in Cyberpunk 2077. We run both games at 1920x1080 resolution using the Ultra preset (details listed above). Cyberpunk 2077 uses DLSS, while we left F1 24 to native resolution scaling. The goal with these settings is to determine if there are differences in performance at the most commonly used (and CPU/system bound) resolution with settings most people use or strive for (Ultra). We expect the difference between boards in these tests to be minor, with most falling within the margin of error differences. We’ve also added a minimum FPS dataset, but note this is a one-frame result and not a 1% value where it’s more noticeable.
Testing within 3DMark among our platforms was dead even in Steel Nomad and Speed Way, except the Ace, which managed a couple of hundred points (~4%) better. In our new games, it was a different story altogether. The Core Ultra, 9 285K was significantly slower than the i9-14900K and Ryzen 9 9900X. We expected it to be slower, but these two titles show more than we expected.
If you look at a wider variety of titles, like in our Core 9 285K CPU review from Paul Alcorn (14 titles), it’s “only” several percent slower overall, but some titles take a big hit. Regarding the two games here, we’re still investigating the results. If things change for whatever reason (flawed process, performance improvements from UEFI/Windows), we’ll update accordingly.
Overclocking
Over the past few CPU generations, overclocking headroom has been shrinking on both sides of the fence, while the out-of-box potential has increased. For overclockers, this means there’s less fun to have. For the average consumer, you’re getting the most out of the processor without manual tweaking. Today’s motherboards are more robust than ever, and they easily support power-hungry flagship-class processors, so we know the hardware can handle them. There are multiple ways to extract even more performance from these processors: manually adjust the settings or use some of the fancy AI overclocking board partners have been touting. Results will vary and depend on the cooling and quality of the CPU. In other words, your mileage may vary. Considering the above, we’re not overclocking the CPU for these review articles. However, we will try out our different memory kits to ensure they meet the specifications.
IMG - z890ace 82k
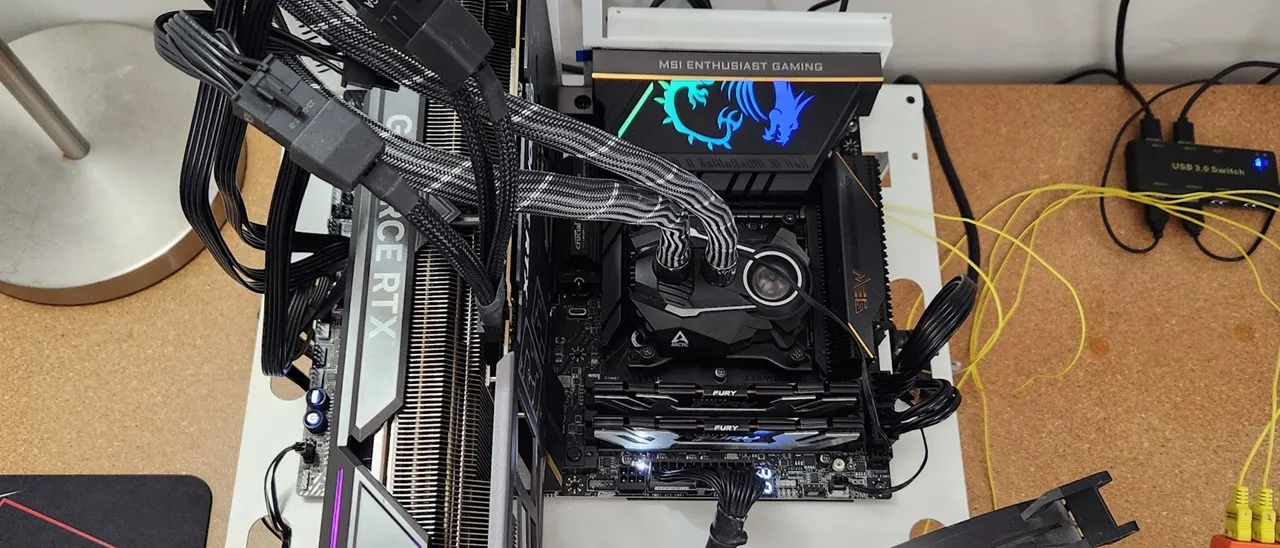
MSI shipped us and several other publications a package that included the Coreliquid I360 AIO, the MEG Ace motherboard with the Intel CPU, and a set of Kingston Renegade Fury DDR5-8200 CU-DIMMs. We didn’t use the I360 AIO to keep our test system the same for everyone, but we did review the 240mm and 360mm versions, which showed strong thermal performance and quiet operation of the pre-installed UNI frame fans.
We dropped the Kingston CU-DIMM kit in and, as expected, it booted up and was stable for the AIDA64 bandwidth tests and our 30-minute stress test. MSI lists support up to a crazy-high 9200+ MT/s, so there should be plenty of headroom for those looking to push the memory envelope. As usual, stick to the Memory QVL list for best results.
Power Consumption / VRM Temperatures
IMG - image44
We used AIDA64’s System Stability Test with Stress CPU, FPU, Cache and Memory enabled for power testing, using the peak power consumption value from the processor. The wattage reading is from the wall via a Kill-A-Watt meter to capture the entire PC (minus the monitor). The only variable that changes is the motherboard; all other parts remain the same. Please note we moved to use only the stock power use/VRM temperature charts, as this section aims to ensure the power delivery can handle flagship-class processors.
Our Core Ultra 9 285K-equipped system sipped on power compared to the i9-14900K. Where the latter was pushing 400W under load during our stress testing, the 295K peaked at 320W on the Ace using the performance setting (250W PL1/2, 400A) with the CPU bouncing off the 250W limit. Intel was correct; these run cooler and use less power, but you can still run into thermal throttling under these loads.
ALBM - vrm1/2
VRM temperatures peaked right around 50 degrees Celsius on our sensors and a little higher on theirs (expected). The wavy fins design and oversized VRM heatsinks do a great job of keeping the robust power bits below running within specification. Again, the VRMs won’t hold you back in any way, even if you decide to run sub-ambient cooling methods.
Bottom Line
MSI’s MEG Z890 Ace is a worthy successor to the Z790 version. In addition to the Arrow Lake processor support, the board offers fast Wi-Fi 7, Thunderbolt 4, five M.2 sockets (2x PCIe 5.0), high-end power delivery, an improved premium appearance, and a slew of EZ DIY features. At $699.99, it’s not cheap, but the good news is that we didn’t see a price increase over the Z790 version, either.
As far as competition at this price point, several are in the ballpark. ASRock’s Z890 Taichi ($499.99) with its six M.2 sockets and the Asus ROG Strix Z890-E Gaming WIFI ($499.99) undercut it, with Gigabyte’s stylish Z890 Aorus Master ($599.99) at the same price point. The Asus Z890 Hero ($699.99) is also in the discussion but is $100 more than our Ace. All these boards offer something you’re sure to like, be it appearance, AI or DIY features, or just a specific feature you need; there’s a lot to like with Z890 in the premium mid-range segment. If any boards stick out above the rest, ASRock’s Z890 Taichi is around $100 less with similar hardware. Its look may be more polarizing than the others, but beauty is always in the eyes of the beholder.
While our Arrow Lake processor’s performance in gaming wasn’t good, even when you average things out among 14 titles, its efficiency and multi-threading (even without Hyperthreading) improved. The platform also offers significantly increased RAM speeds, especially when using the new CU-DIMMs with the integrated clock driver, increasing high-speed stability. In the end, we like what the new Z890 platform offers, and MSI’s MEG Z890 Ace is a solid representation of it. If you’re in the market for what Arrow Lake and Z890 offer, The MSI MEG Z890 Ace is a good all-around motherboard if you have room for it in your build budget.
MORE: Best Motherboards
MORE: How To Choose A Motherboard
MORE: All Motherboard Content