Why you can trust Tom's Hardware
Benchmark Results and Final Analysis
Our standard benchmarks and power tests are performed using the CPU’s stock frequencies (including any default boost/turbo), with all power-saving features enabled. We set optimized defaults in the BIOS and the memory by enabling the XMP profile. For this baseline testing, the Windows power scheme is set to Balanced (default) so the PC idles appropriately.
Synthetic Benchmarks
Synthetics provide a great way to determine how a board runs, as identical settings should produce similar performance results. Turbo boost wattage and advanced memory timings are places where motherboard makers can still optimize for either stability or performance, though, and those settings can impact some testing.
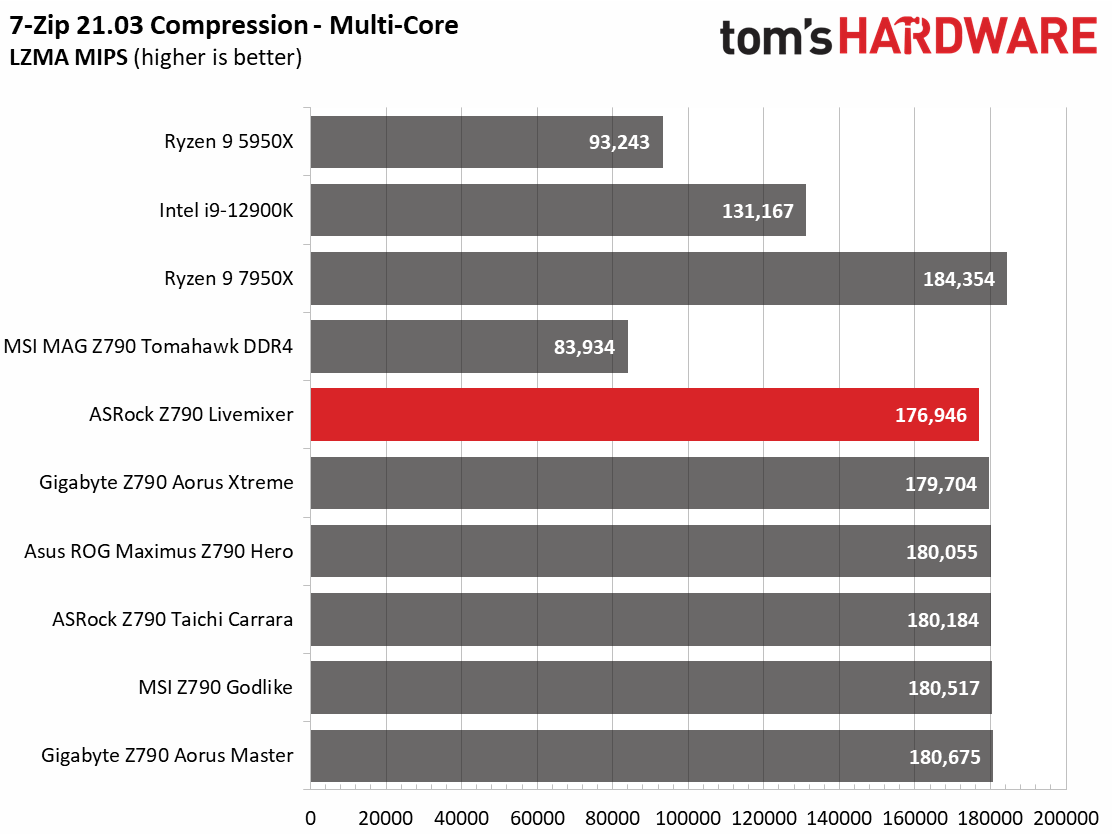
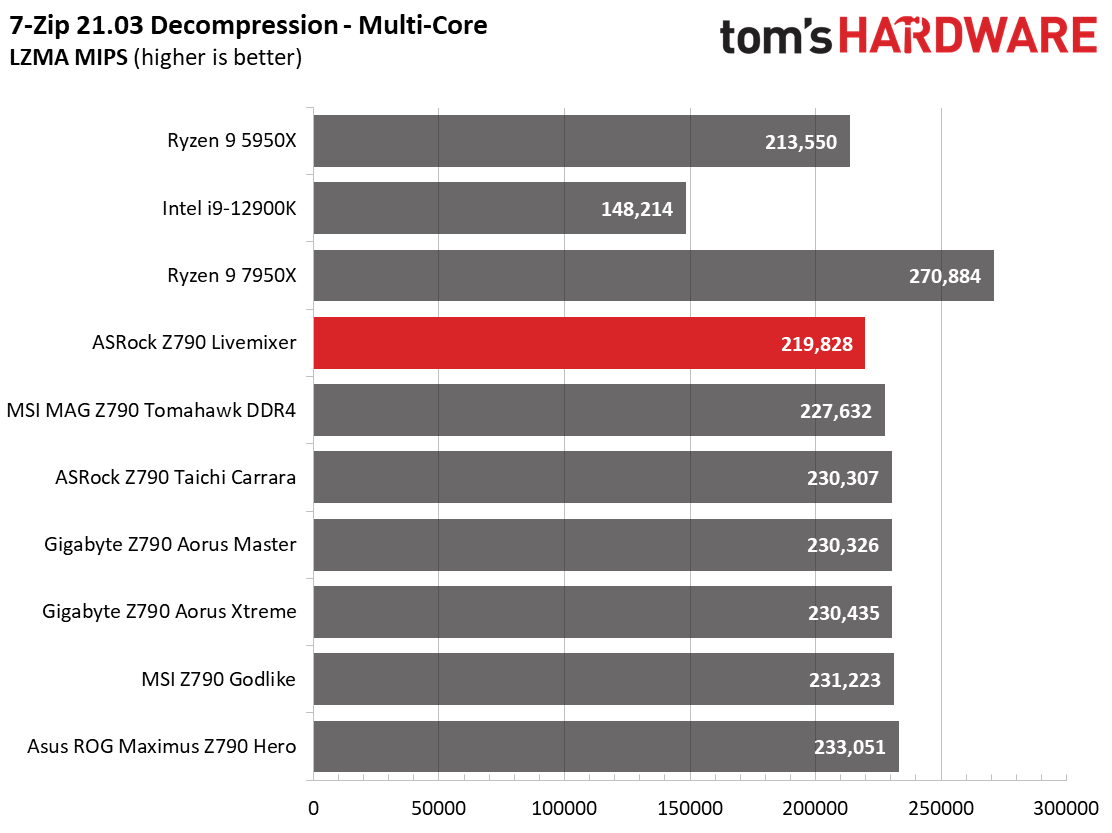
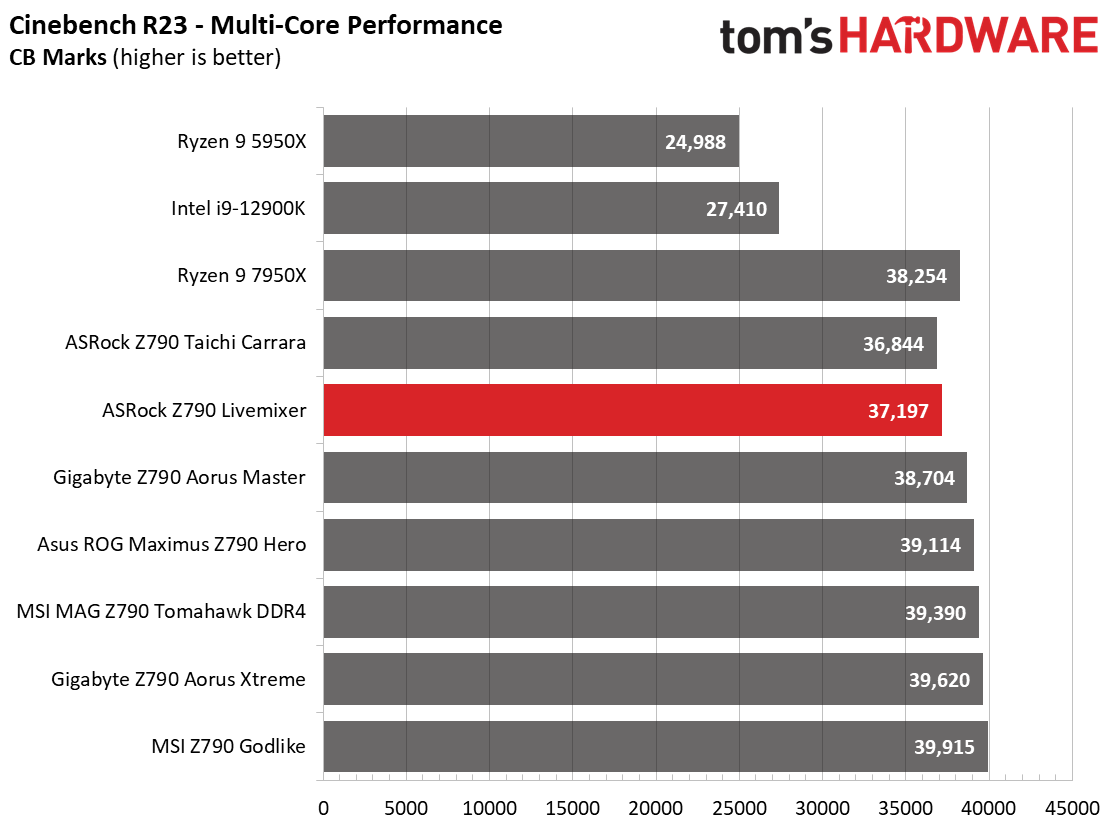
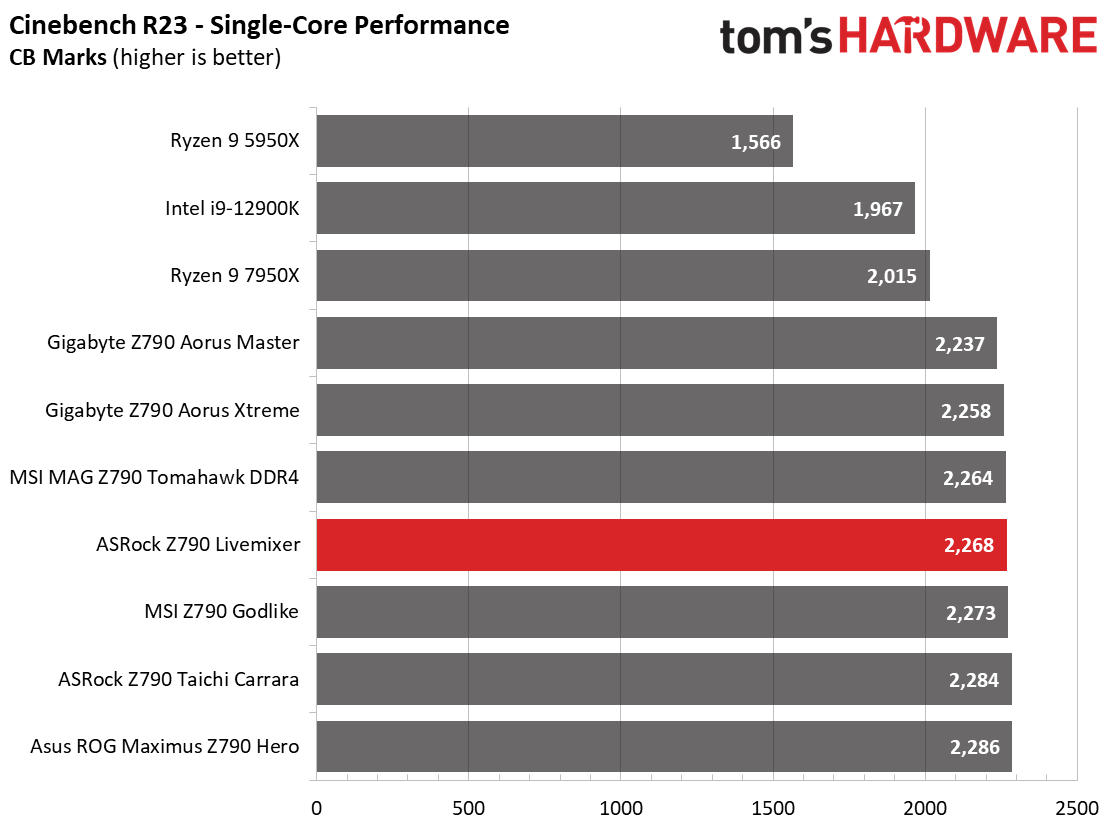
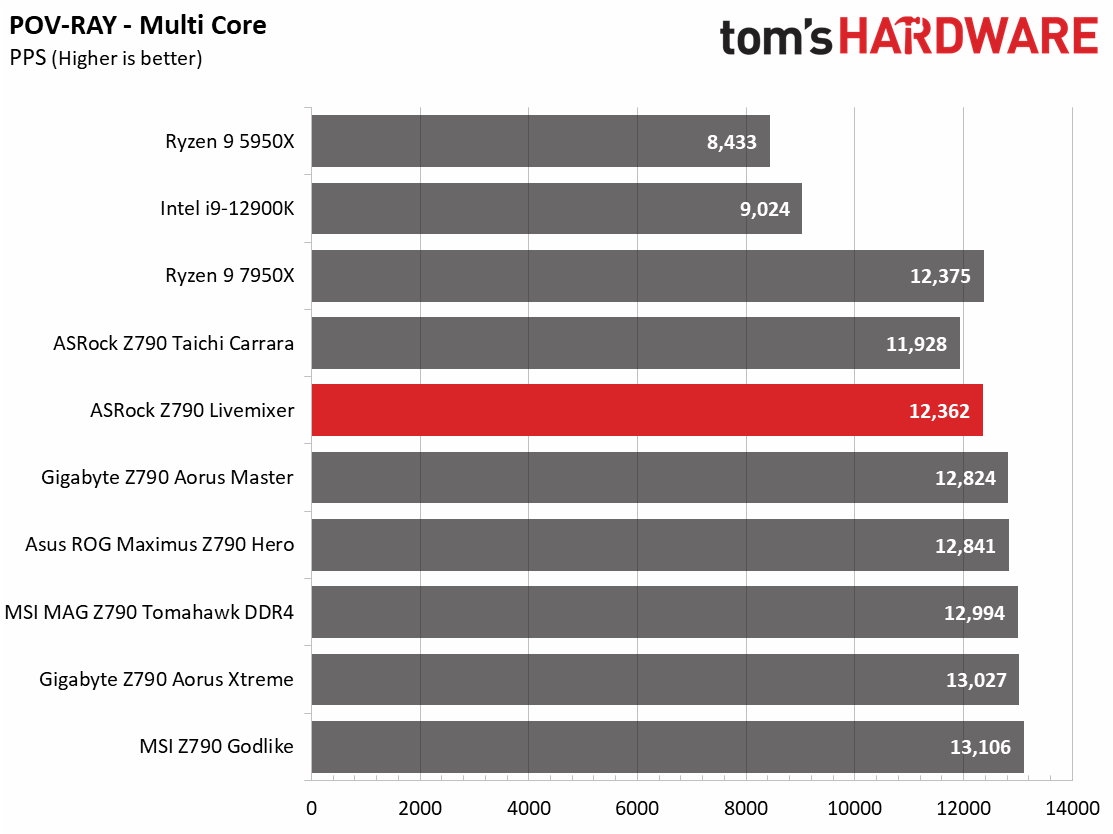
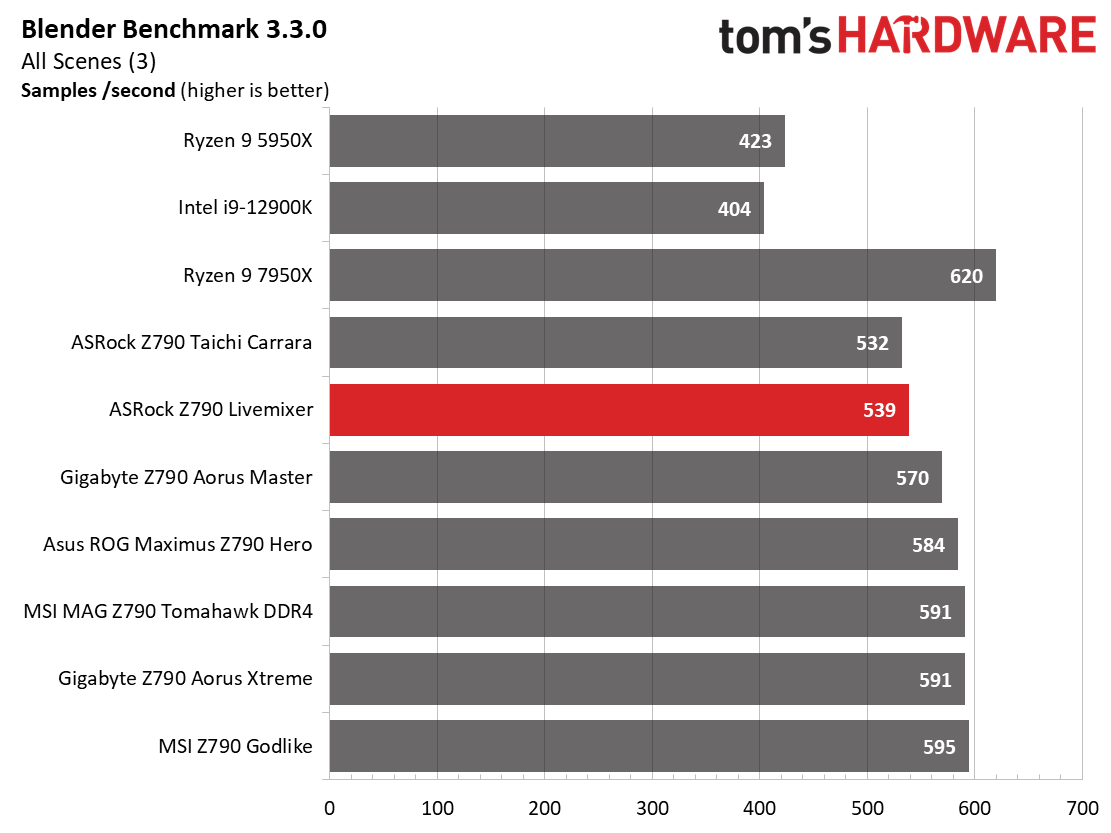
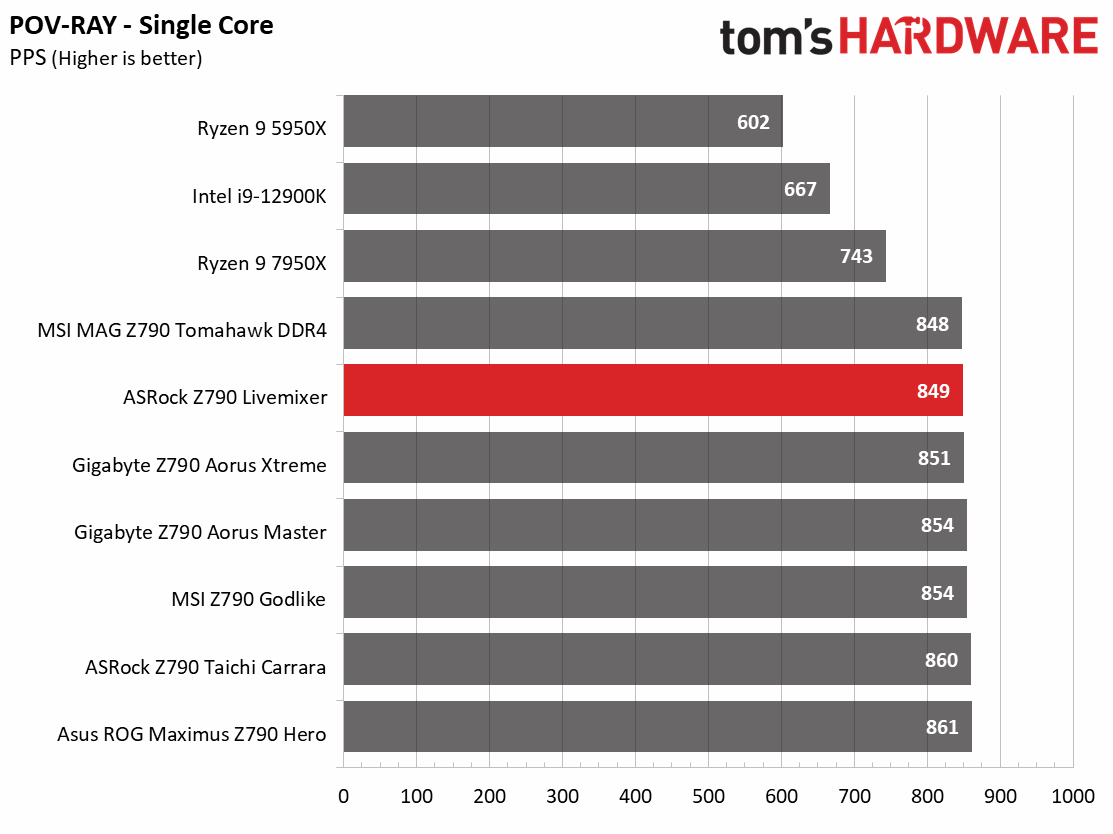
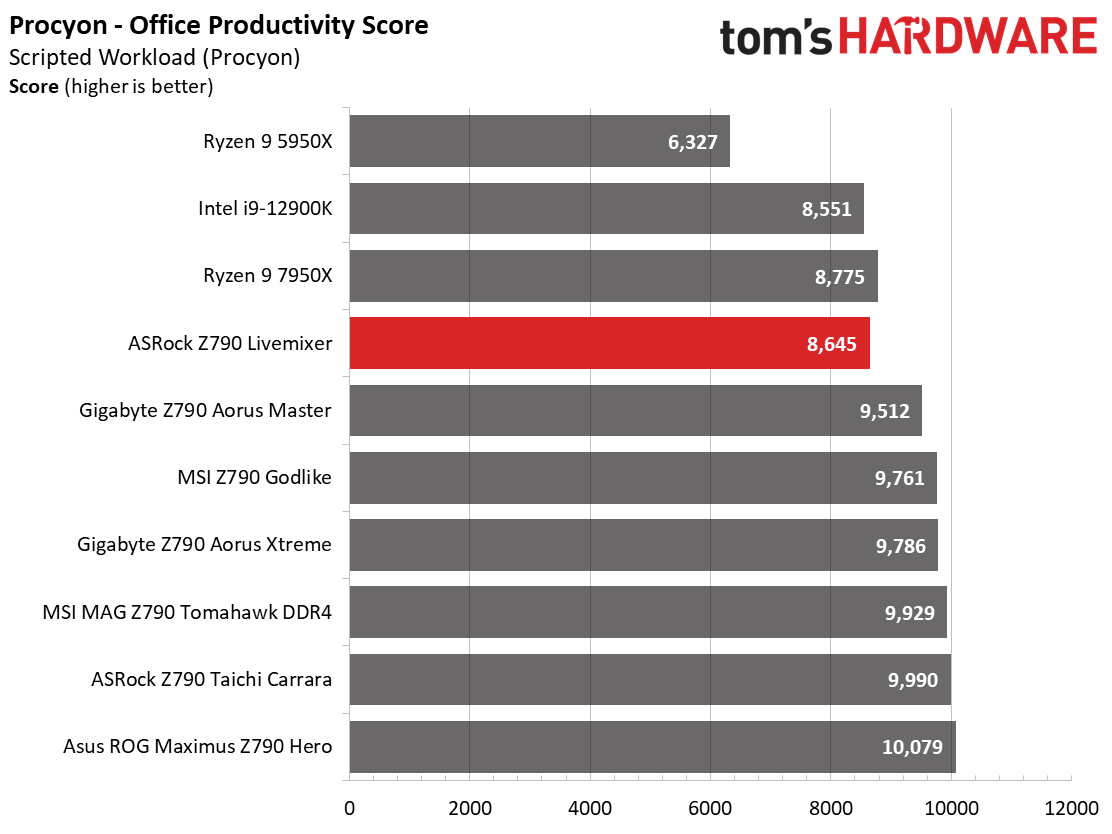
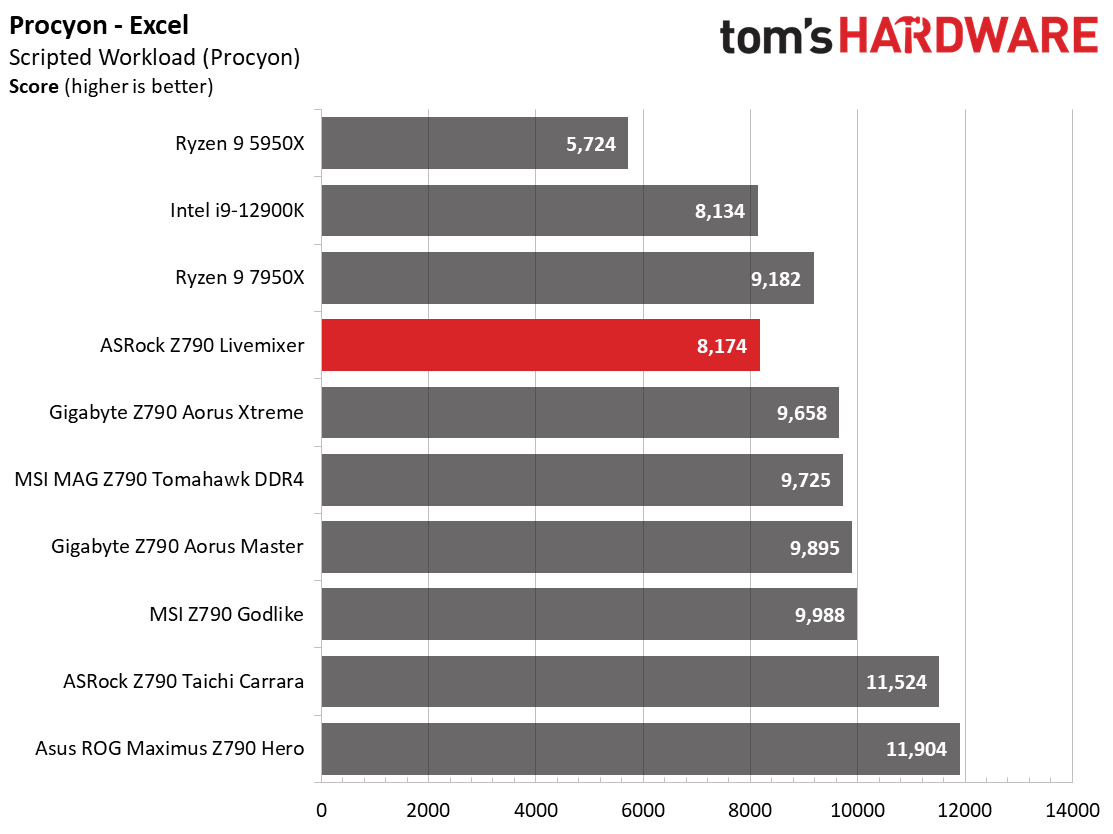
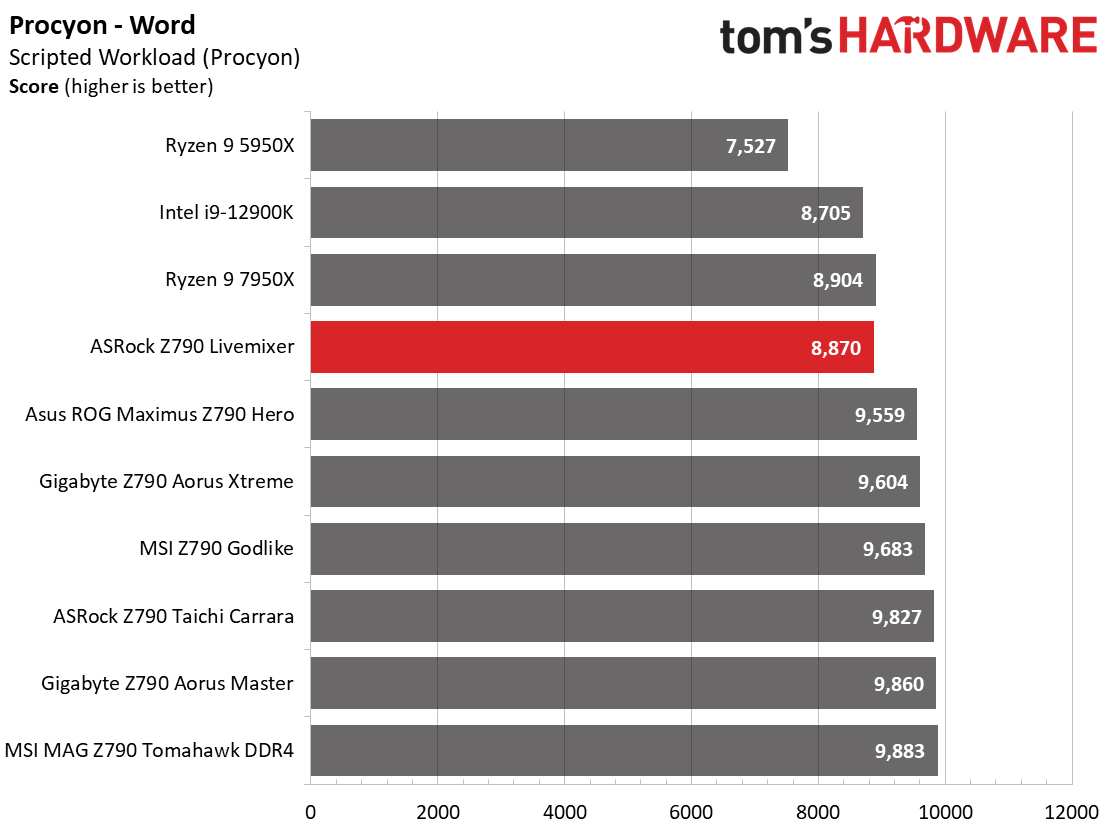
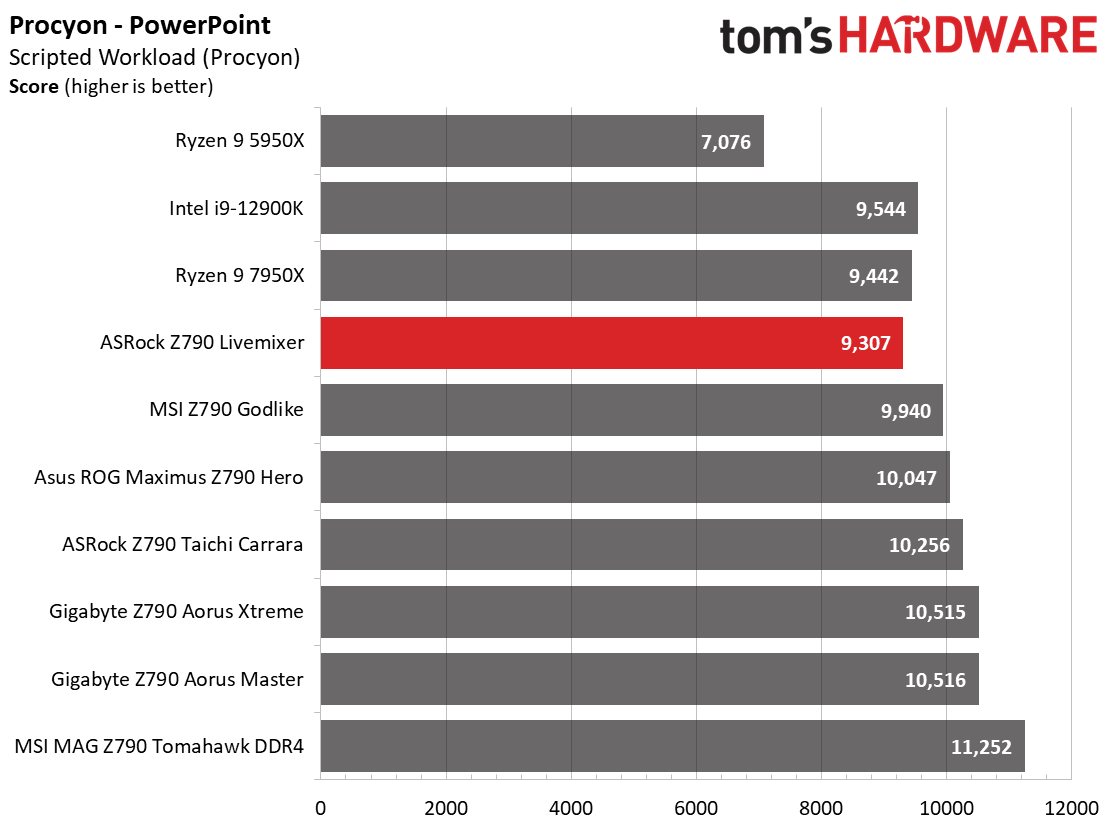
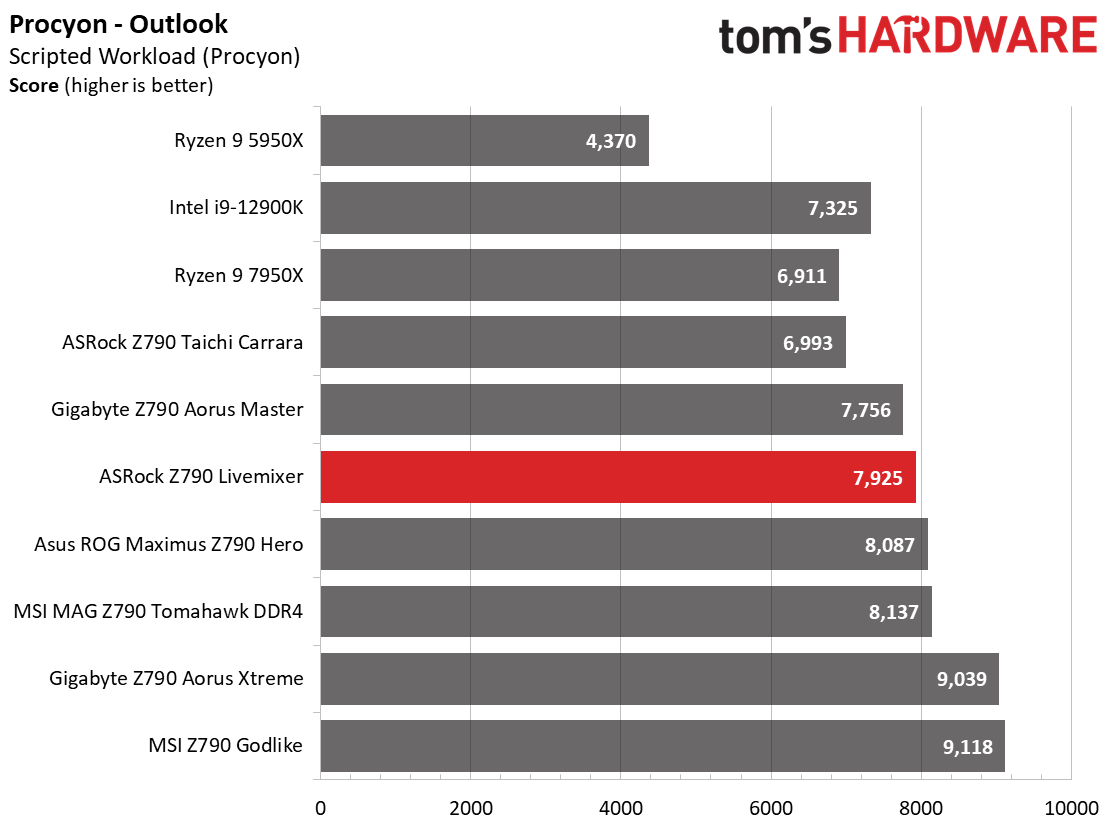
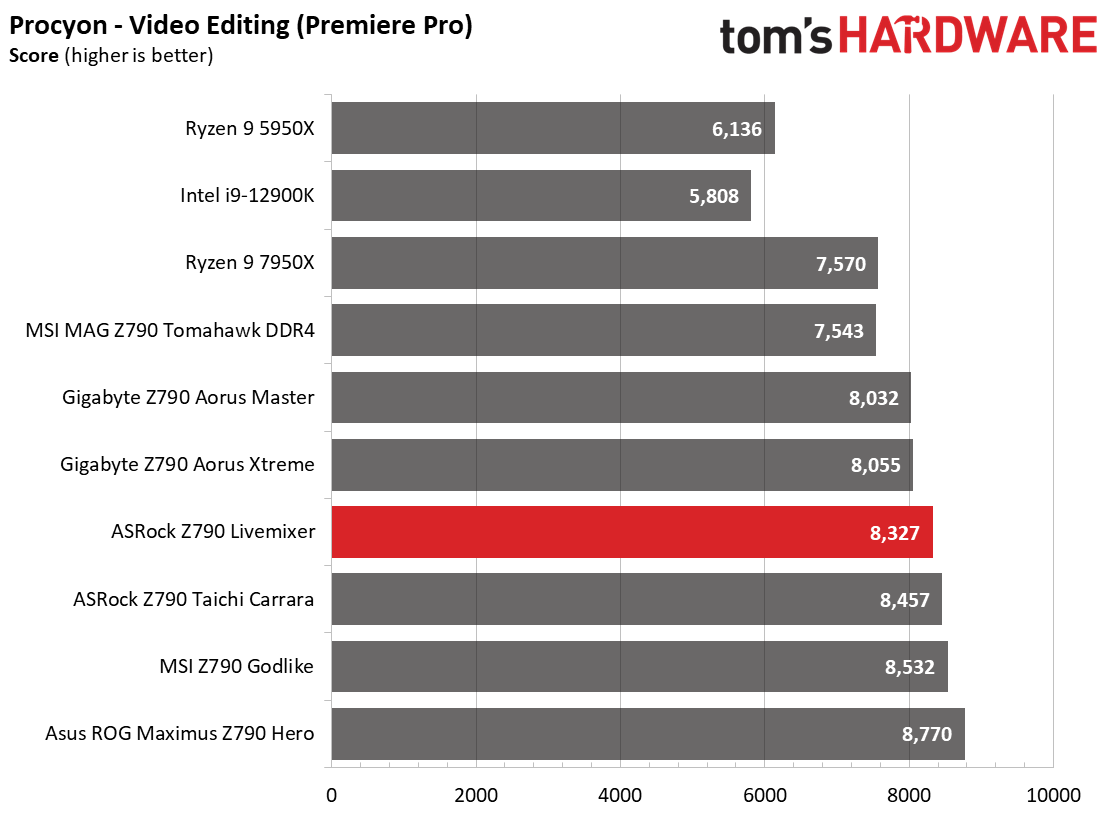
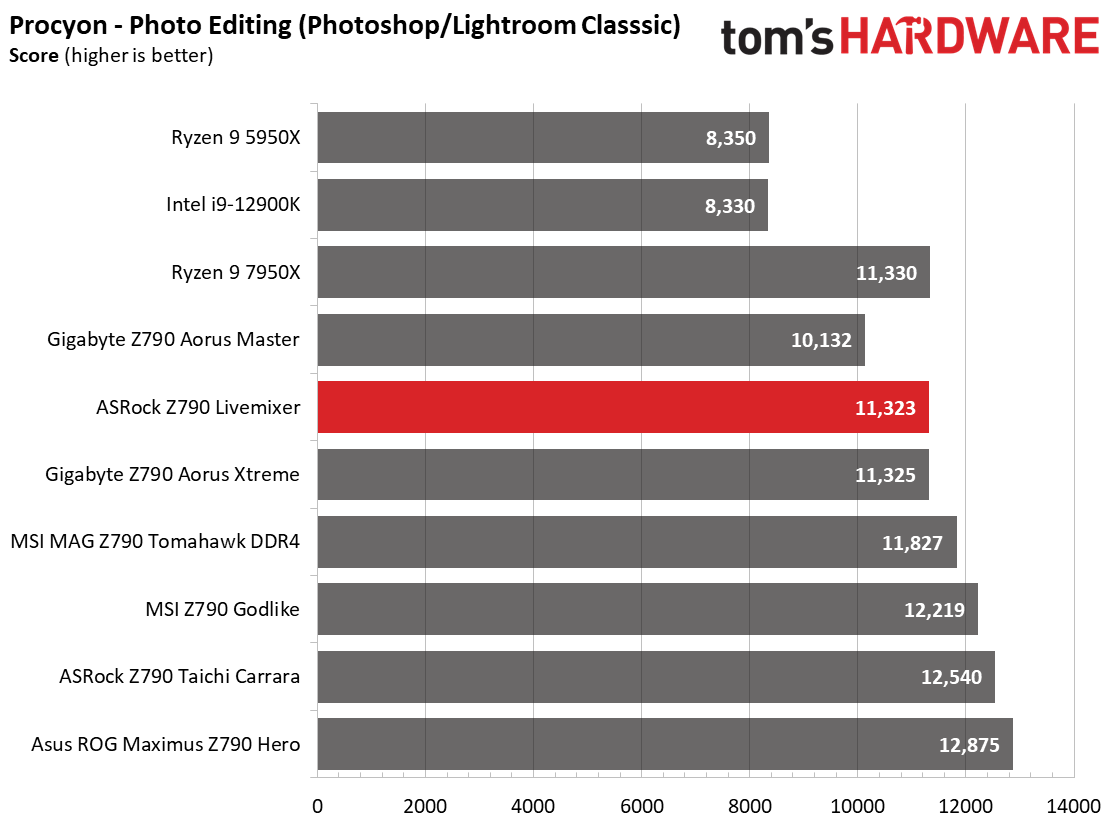
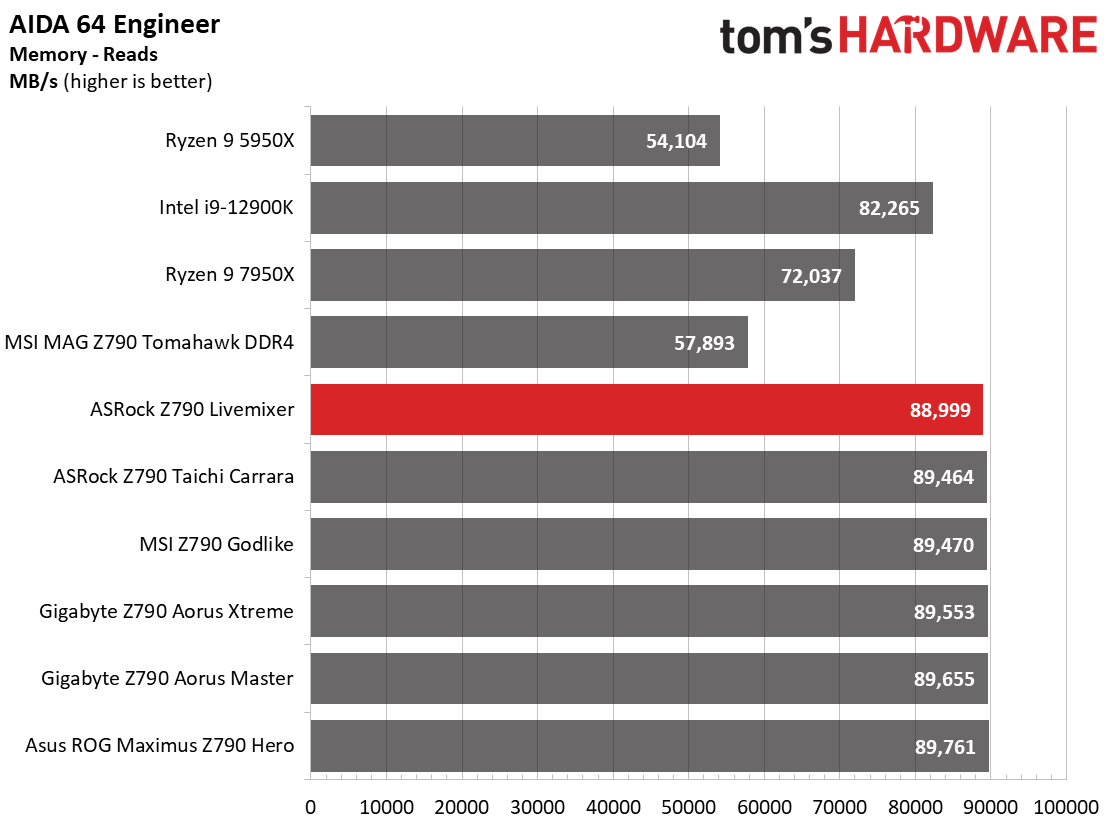
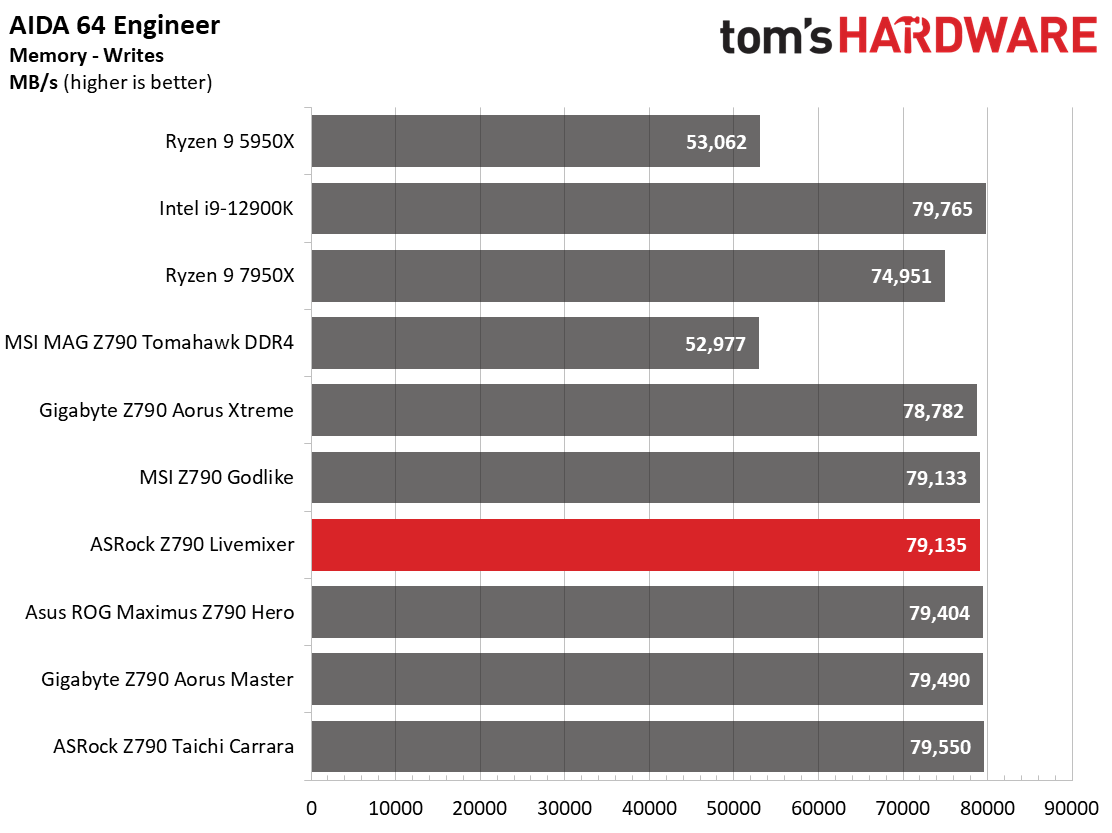
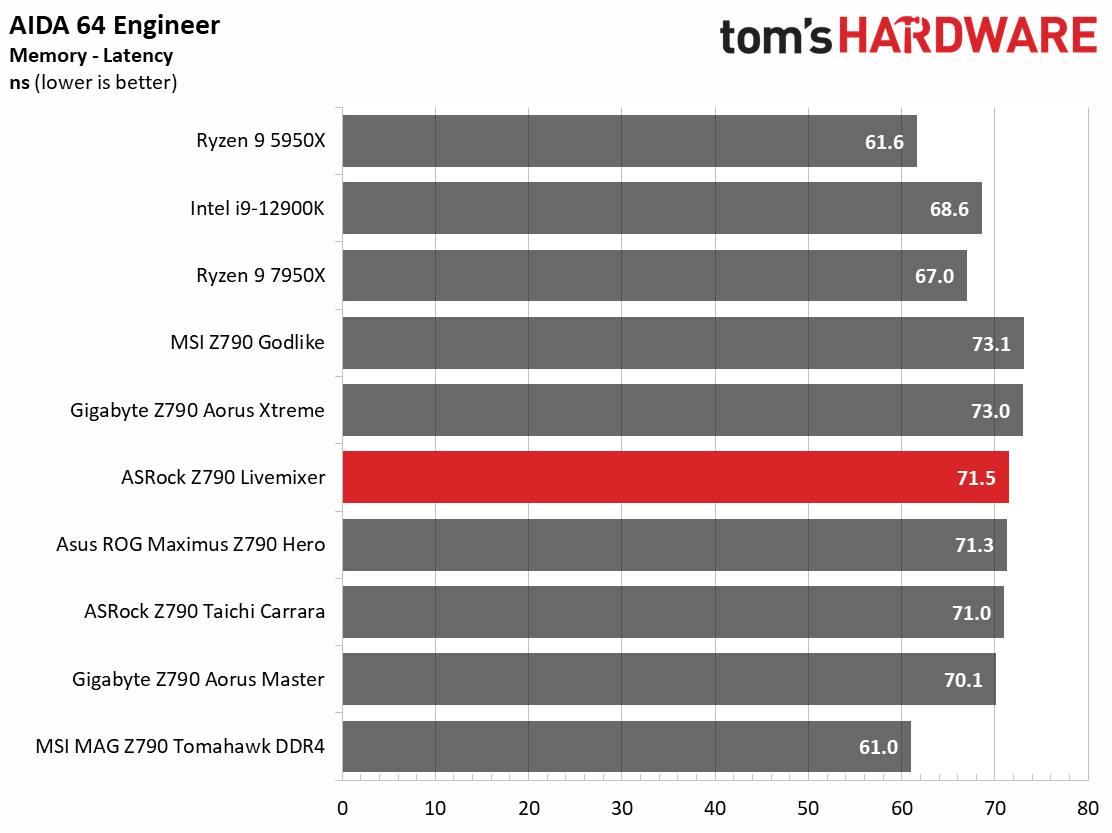
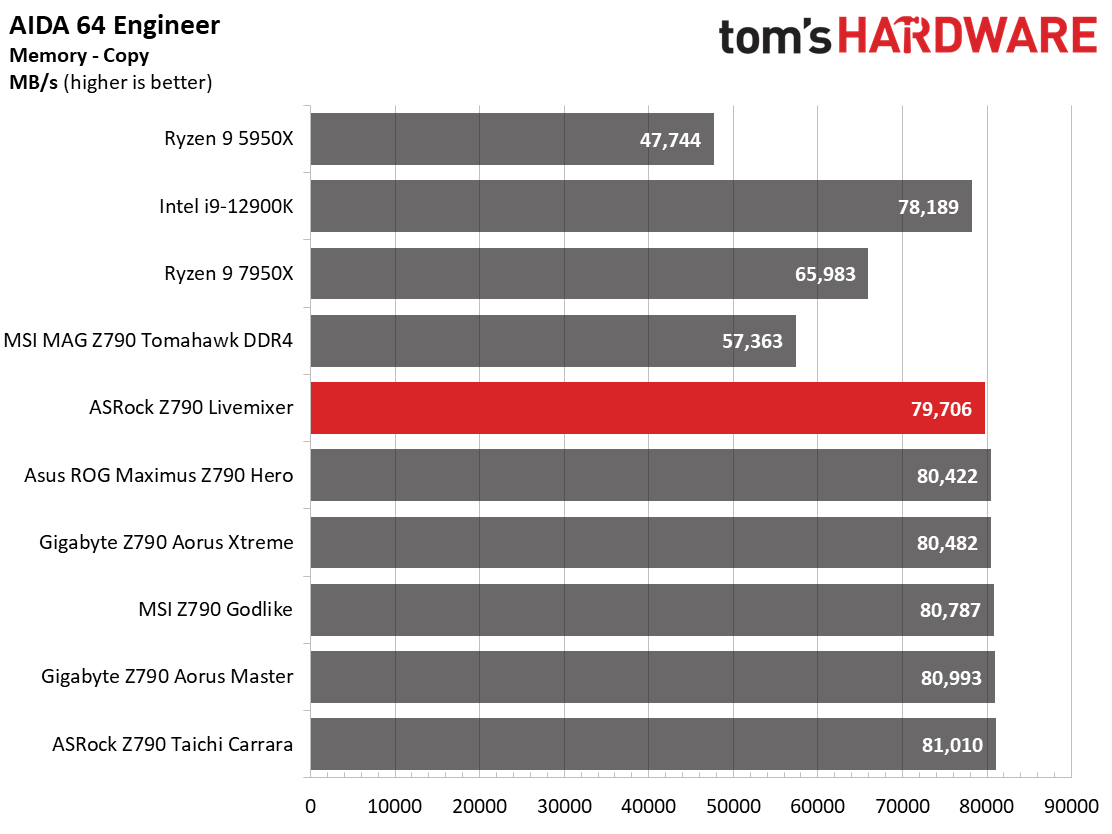
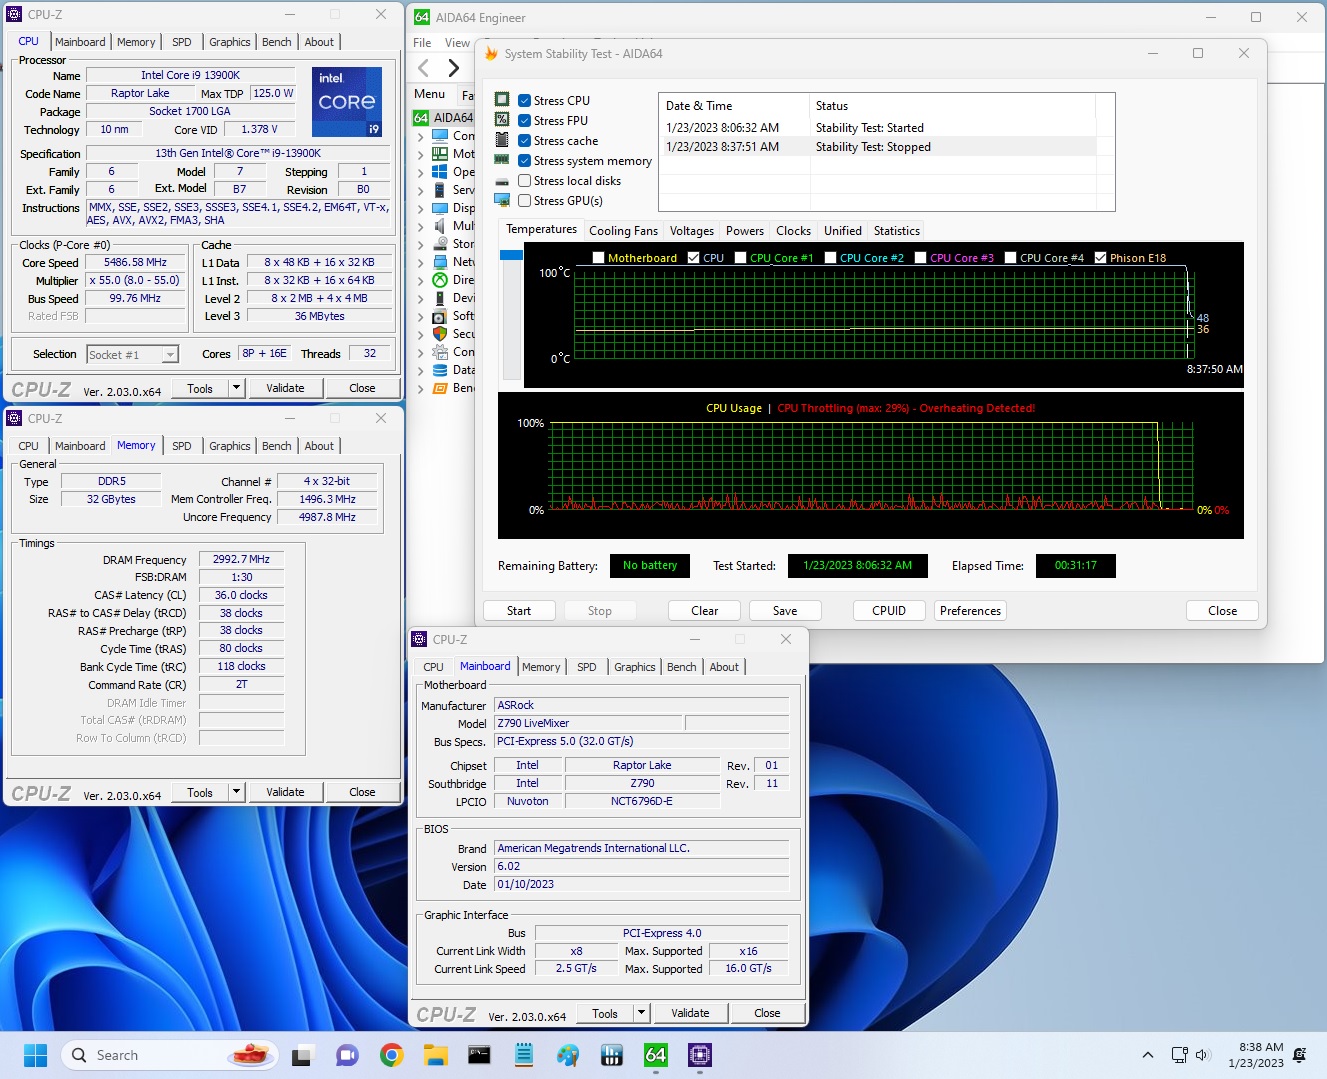
In our synthetic benchmarks, the Z790 Livemixer had average to below average results across the board. Anything that’s a longer-running, multi-threaded benchmark tends to take a hit more than any lightly threaded or single-threaded apps. Even with the BIOS set at the 240/280mm AIO setting (less than our cooling solution, a 360mm AIO), it still thermally throttled the CPU more than other boards.
Timed Applications
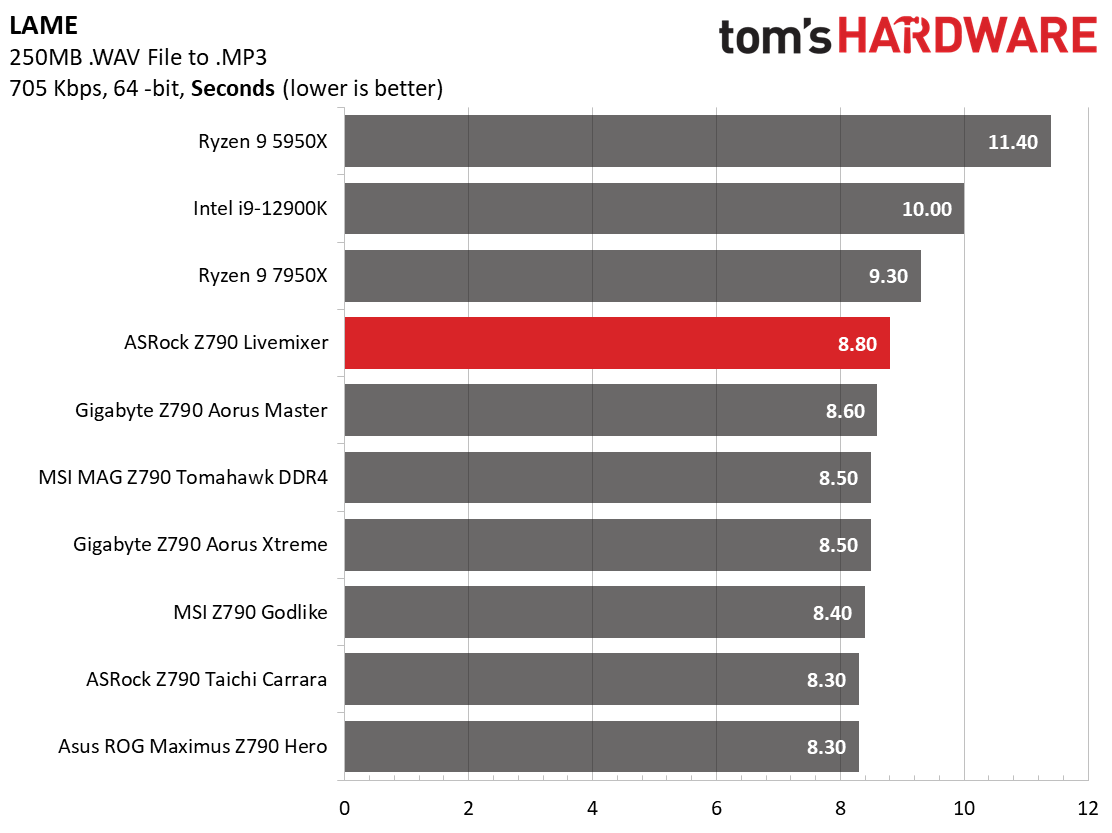
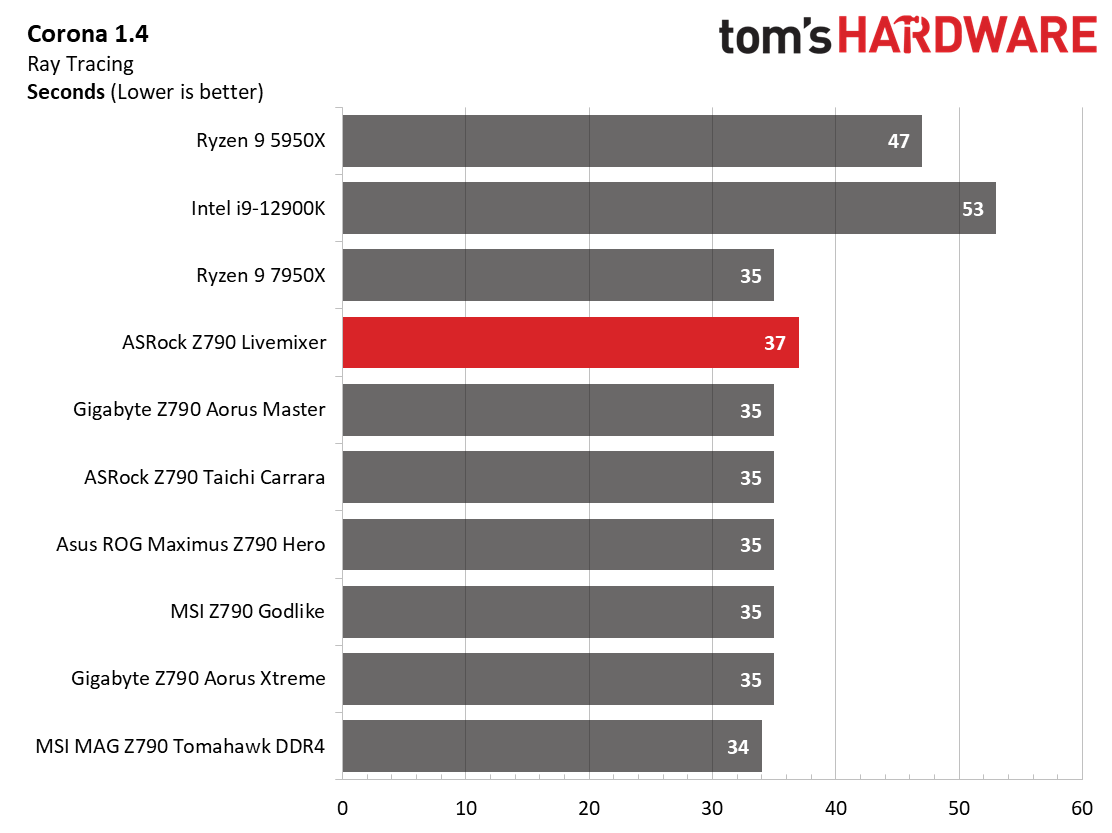
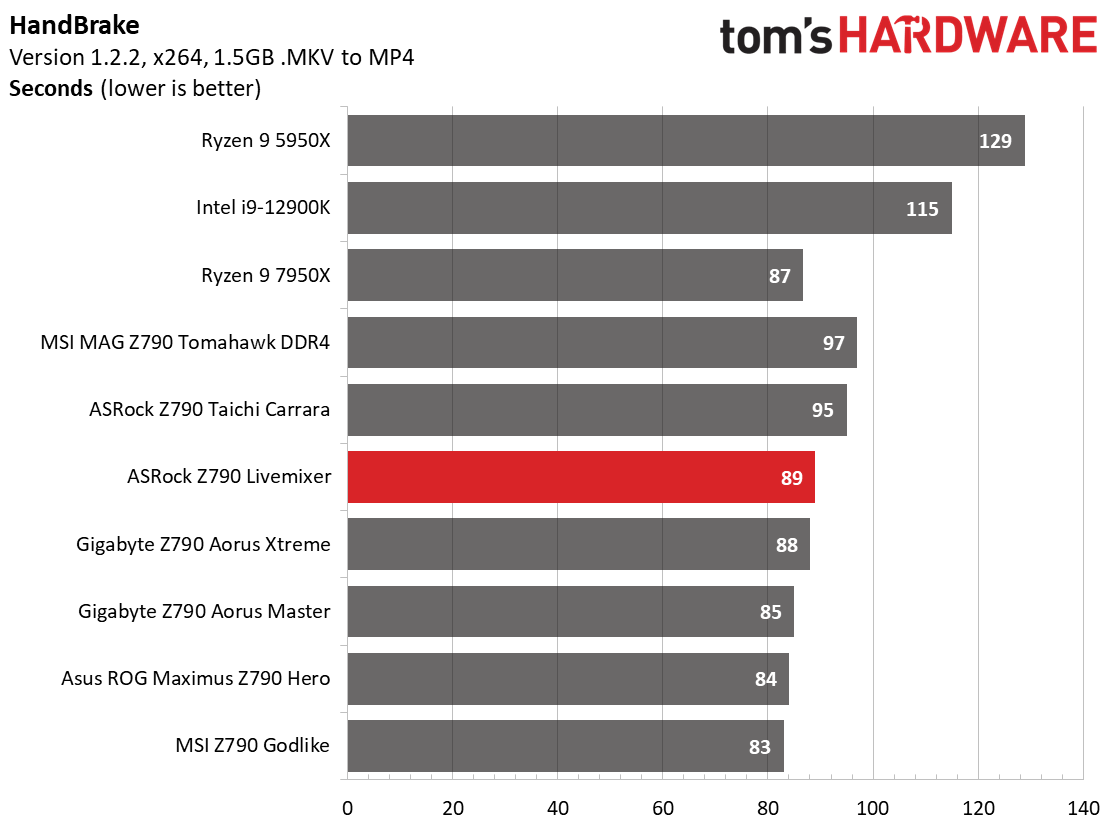
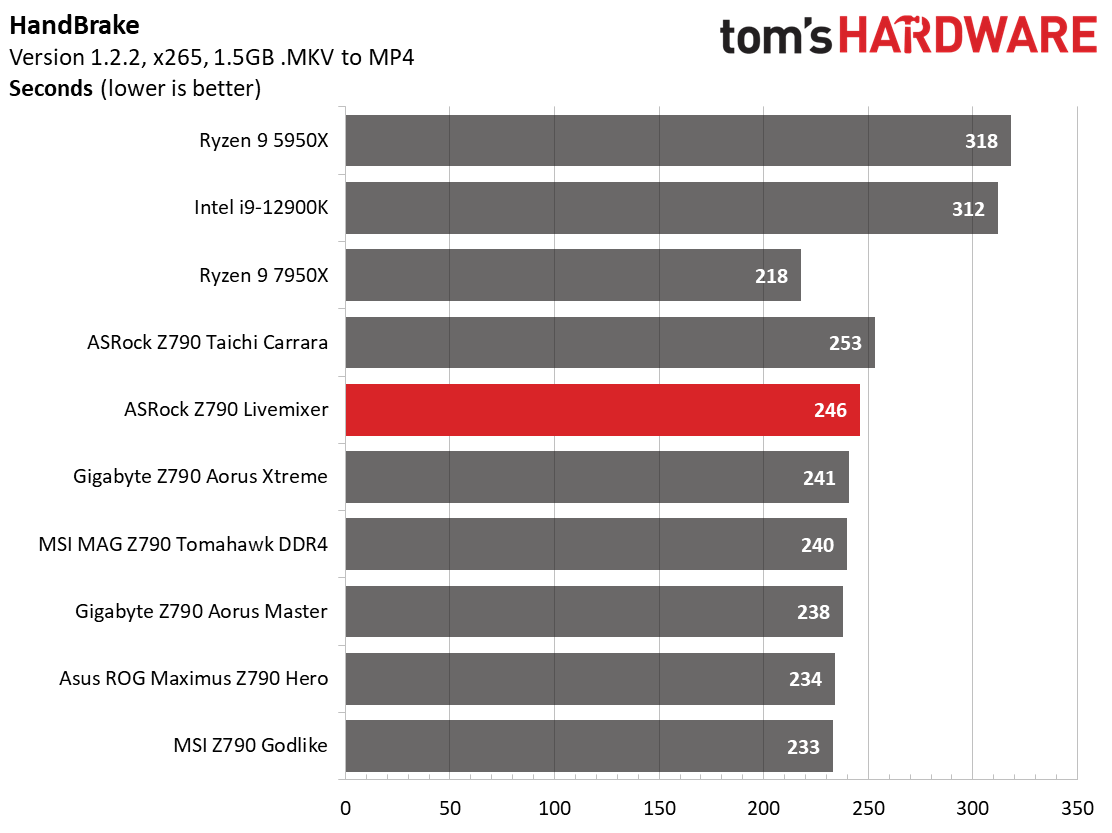
Starting with Handbrake, the Livemixer was the second slowest result, behind only the fully unlocked Taichi that thermally throttled the CPU even more. Here again, and like its Taichi sibling, with long-running heavy applications, the voltage used out of the box, despite our robust cooling solution puts a ceiling on performance. LAME encoding was also the slowest of the bunch, but not by much.
3D Games and 3DMark
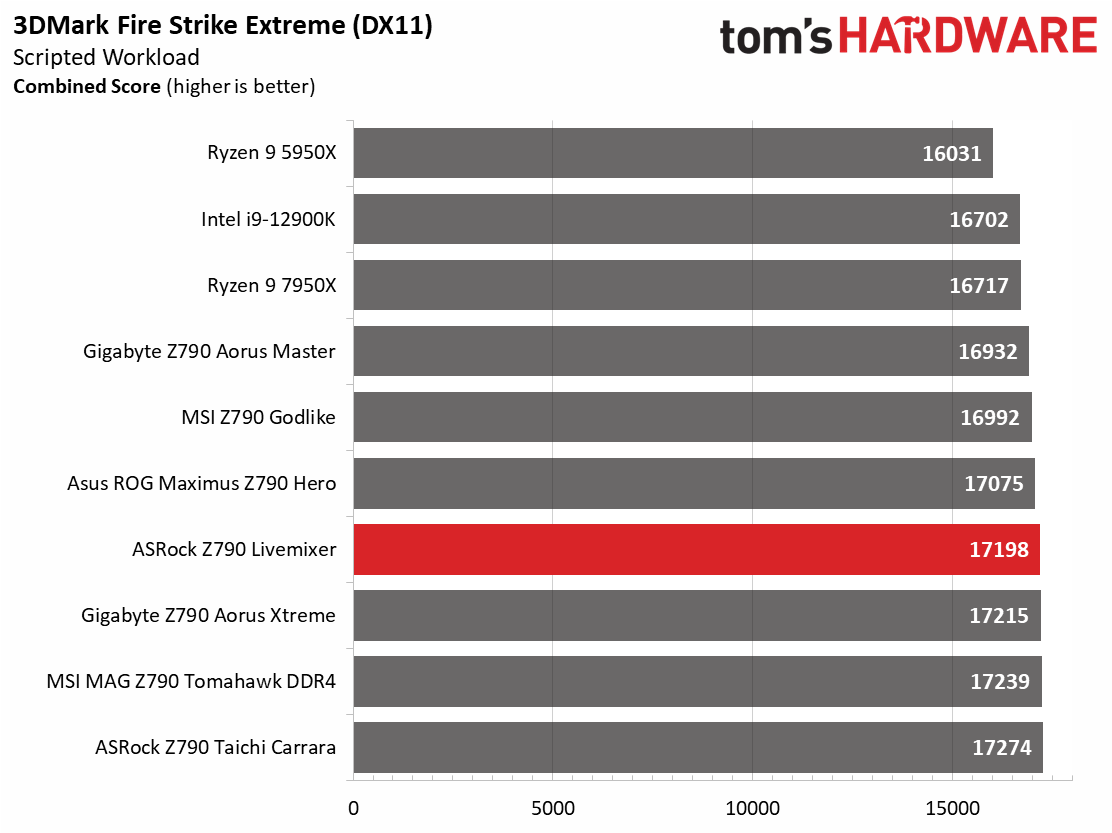
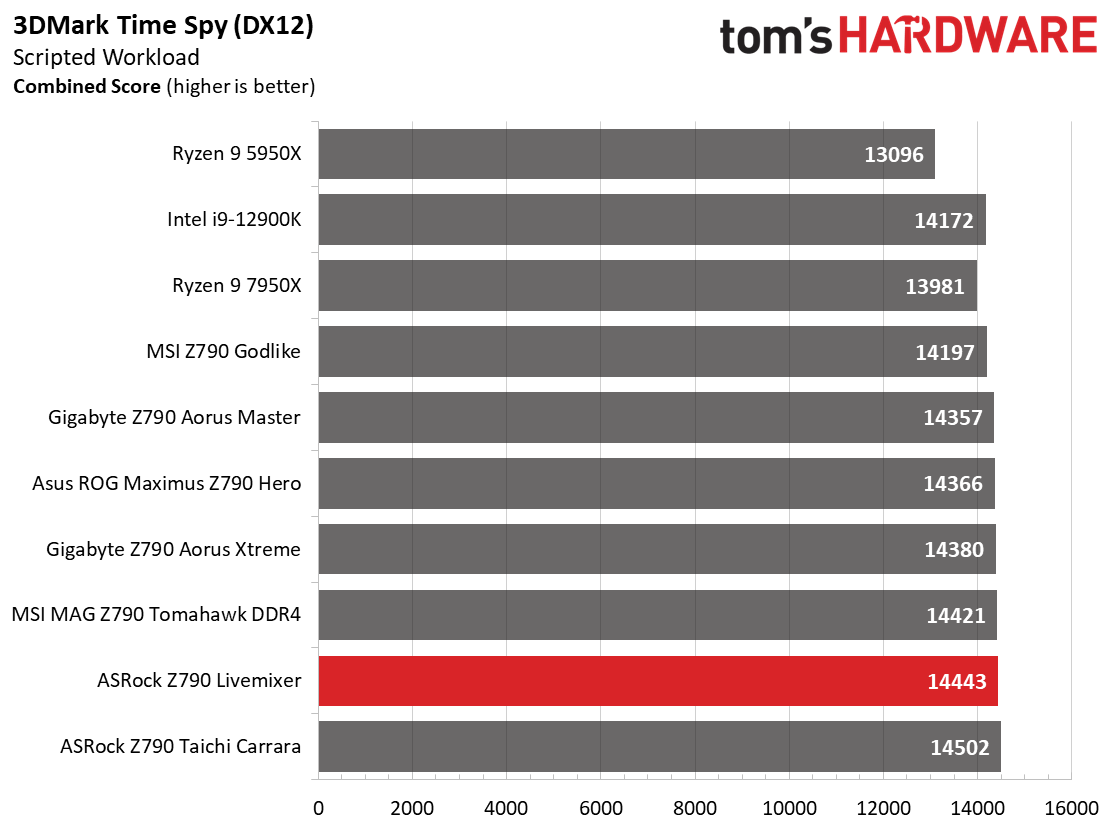
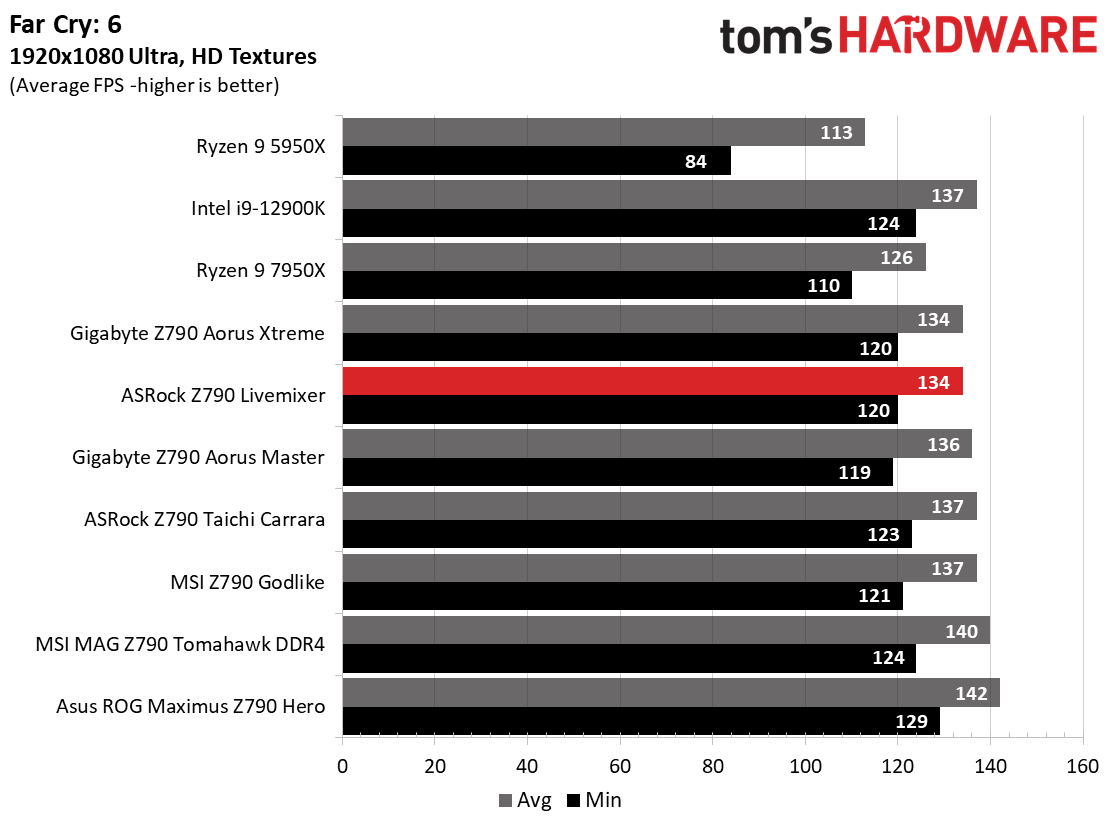
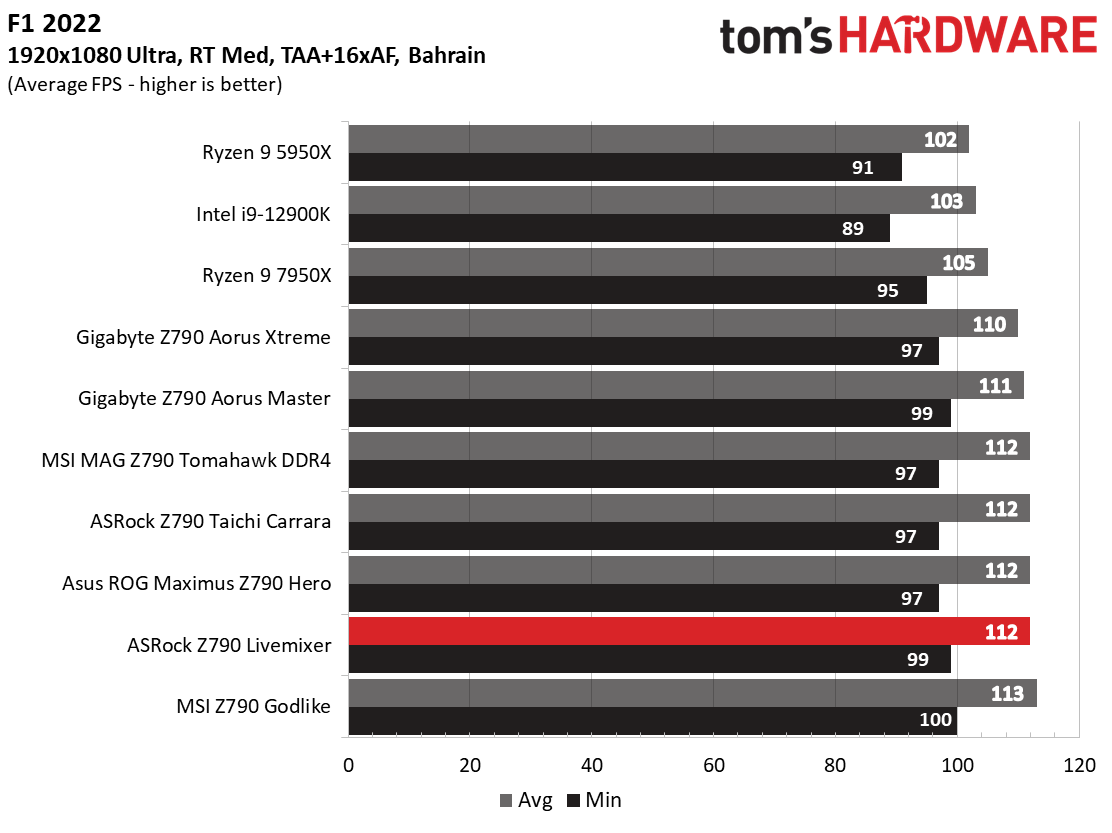
Starting with the launch of AMD’s Ryzen 7000 platform, we’ve updated one of our games, F1 21 to F1 22, while keeping Far Cry 6. We run the games at 1920x1080 resolution using the Ultra preset (details listed above). As the resolution goes up, the CPU tends to have less impact. The goal with these settings is to determine if there are differences in performance at the most commonly used (and CPU/system bound) resolution with settings most people use or strive for (Ultra). We expect the difference between boards in these tests to be minor, with most falling within the margin of error differences. We’ve also added a minimum FPS value, which can affect your gameplay and immersion experience.
Overall, the Z790 Livemixer is a competent gamer. The 3DMark scores mix it up with the other boards, and the game tests are also up there, especially in F1 22. The Livemixer was a couple of frames per second behind the others in Far Cry 6, but that’s still minimal. According to our tests, you wouldn’t notice the difference between this or any other board we’ve tested when gaming.
Overclocking
When overclocking, we aim to increase the power and add stress to the VRMs. We do so by increasing the clock speed and voltage until we’re at the thermal threshold for the processor during stress testing. However, where these CPUs are allowed to run with ‘boost’ speeds, those speeds are closer to the limit than ever before.
Get Tom's Hardware's best news and in-depth reviews, straight to your inbox.
With our Core i9-13900K, the approach was a bit different. To overclock our chip, we had to lower the voltage from what was recorded during stress tests. We increased the clock speeds of the “P” and “E” cores by 100 MHz and 200 MHz, respectively, over the turbo boost and limited by our cooling. We ended up with 5.6 GHz P core and 4.5 GHz E core clocks using about 1.34V (from DMM). Temperatures peak just under the throttling point with this configuration. And as we’ve noted elsewhere, this is the intended performance for Intel’s flagship CPU.
Overclocking on the Z790 Livemixer was a pain. With most boards, it’s easy to dial in the known voltage value for the clock speeds and go. But with this board, over the course of 2 hours (and a borked OS in the process), I could not get the system to pass a 30-minute stability test. Either the thermal throttling was too much, or the voltage wasn’t enough and it would reboot. You may have better luck with a lesser K-SKU i7 or i5 processor, which is honestly more this board’s speed.
On the memory side, we dropped our Kingston Fury Beast DDR5-6000 kit in the system, enabled XMP, and tested it without issue, as expected.
Power Consumption / VRM Temperatures
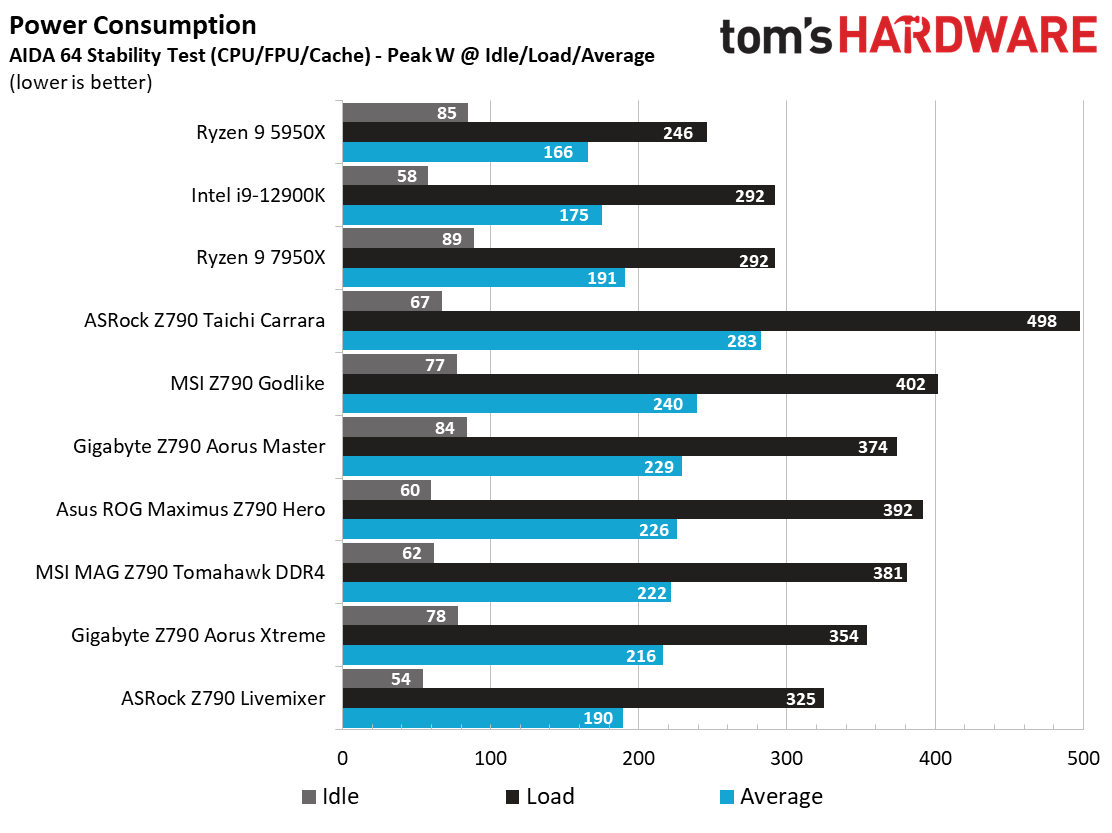
We used AIDA64’s System Stability Test with Stress CPU, FPU, Cache and Memory enabled for power testing, using the peak power consumption value. The wattage reading is from the wall via a Kill-A-Watt meter to capture the entire PC (minus the monitor). The only variable that changes is the motherboard; all other parts remain the same. Please note we moved to use only the stock power use/VRM temperature charts, as the goal of this section is to ensure the power delivery can handle the chip even when overclocked. Since we’re using less power to get more clocks, those datasets are more novel than useful. We’re also temperature limited on the processor, so adding more power isn’t possible without increased throttling.
Idle power consumption on our Z790 Livestream/i9-13900K combo peaked at fairly low 54 watts at the desktop. Load power peaked at only 325W at the wall, the lowest we’ve recorded with an i9-13900K.
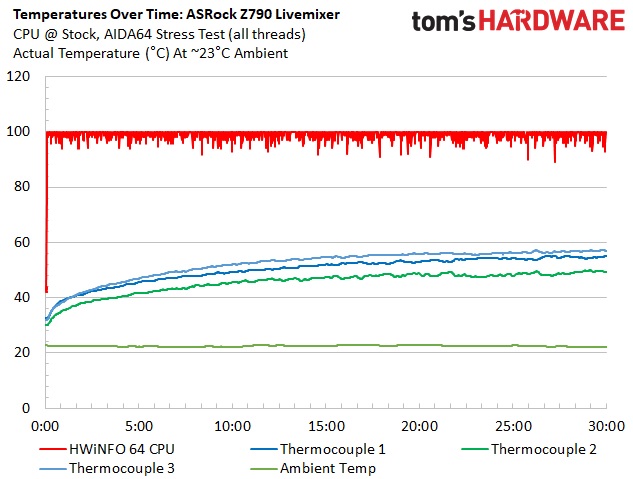
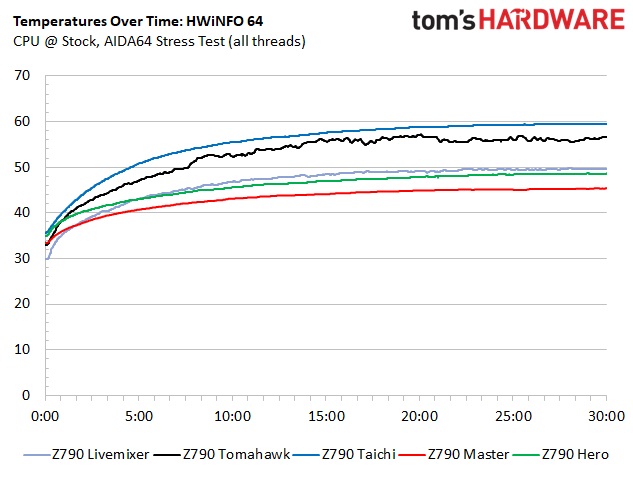
VRM temperatures on the Livemixer ran warm, but well within specification during our stress test. The system peaked at just under 60 degrees Celsius while using stock settings in the stress test. The VRM cooling solution works well on the 60A SPS MOSFETs.
Bottom Line
The ASRock Z790 Livemixer is one of the most unique motherboard designs we’ve seen. The purple graffiti theme and the bright RGB LEDs stand out among modern-day peers. And the board isn’t all about looks. The Livemixer is well-appointed, with the only major thing missing being integrated Wi-Fi. Still, it has five total (though four useable concurrently) M.2 sockets (one PCIe 5.0 x4), a whopping 14 USB ports on the rear IO to connect all your streaming peripherals, and a reasonable price for the platform at $252.99.
The board is not without its drawbacks, however. The audio codec is dated and hails from the budget side of the tracks. Although many will find this one acceptable, for a board designed for content creators, I would like to see a better codec used, such as one from the ALC1200 family (or newer) like some of the competition uses. I would also like to see EZ M.2 latches (both here and across all boards), but that’s a minor complaint. Performance was, at best, average, but many of the heavily multi-threaded and longer-running tests were slower due to the processor thermally throttling more than other boards. The gaming performance was spot on, though. So long as you don’t plan to run heavily multi-threaded operations, or you use something less thermally demanding than our Core i9, you’ll get all the performance you paid for with this board.
There’s some stiff competition around this $250 price point. MSI’s Pro Z790-A Wi-Fi is $269.99, the Gigabyte Z790 Aorus Elite AX is $259.99, and the Asus Prime is the least-expensive at $249.99. All those boards include Wi-Fi, which ASRock’s board lacks. If you need better audio, the MSI sports the latest generation codec (Realtek ALC4080). All of these are viable options in the space and, depending on your needs, may be better options.
The Z790 Livemixer, with its unique appearance, is a solid option to build your Raptor Lake-based system on. It has the most USB ports on the rear IO we’ve seen in a while, which is great for those who need lots of external connectivity, including the intended market, content creators and gamers. If you’re in the market for a mid-range board and like the unique look of the Livemixer, it’s a decent and visually unique option. However, other boards around the same price have a less polarizing appearance, better audio, and integrated Wi-Fi.
MORE: Best Motherboards
MORE: How To Choose A Motherboard
MORE: All Motherboard Content

Joe Shields is a staff writer at Tom’s Hardware. He reviews motherboards and PC components.
-
Exploding PSU I have a soft spot for pink and purple parts. While the graffiti isn't my thing, personally, this motherboard passes the vibe check in its looks department.Reply -
RichardtST "No quick release or latches for M.2 " - This is not a con. I see this as a PRO. I have had a ton of frustration and trouble trying to use custom NVME heatsinks with these annoying "quick, easy" latches. They are usually not compatible with anything but a bare drive.Reply -
greenreaper It's cute, I agree, but not the best features for the price. In the UK you can even get an equivalent feature set with WiFi and a better codec with amplifier on AMD's side with the ASUS AMD Ryzen ROG STRIX B650E-F GAMING WIFI, though I don't know if that's just because Scan is stuck with a lot of them.Reply -
creed6621 As pointed out the audio isn't great is an huge understatement . Upon going to their website and downloading the owners manual - the audio for 7.1 is accomplished from using the front and back microphone jack and the front and back line out jacks . You can't have 7.1 sound unless you give up the capability of plugging in your microphone . Which isn't that big of a deal with usb options available but the wiring for sound would look ridiculous and you might run into a bit of trouble separating the mic and line out from the front combination jack . Anyways - it would just look ridiculous - there is a reason for the back panel outputs . Just imagine a stereo system with the speaker connectors on the front of it . It wouldn't be very pretty for sure ... Oh my ! I feel so much dumber right now - Thank you Asrock - LoL !!Reply -
btmedic04 while it has the looks, it doesnt have the pedigree, my nf4 SLI-DR was a monster back in the day. please dont associate DFI Lanparty boards with As$rock :cautious:Reply -
ocer9999 Looking to add this one to my collection for sure. For audio I have my own solution for that reason doesnt bother me.Reply -
Forzkin There seems to be WIFI slot in a pic. Is it true? I see that as a plus because I can choose the Wifi device myself. Digital audio output connector is other thing why I like this board. It has SPDIF output so I get extra digital channel to my RME Raydat soundcard. Third thing I like is more USB connections than in any other board( not counting AMD version). They are layed out in nice manner. Fourth goodie is that extra PCI slot for PCIe audio card. I think this LiveMixer looks very good contender for Audio workstation for studio use. Btw: AMD version has not that extra PCIe. For such DAW use I would pair it with air cooled 13600K to keep power controlled and fans quiet. I'm on market for DAW engine and if you have some insider tip for DAW machine I would be happy to hear about it.Reply
