Corsair RM550x Power Supply Review
The lowest-capacity unit Corsair's RMx line outputs up to 550W and is 80 PLUS Gold-certified. It features fully modular cabling, offers great performance and is nearly silent throughout its operating range, too.
Why you can trust Tom's Hardware
Cross-Load Tests And Infrared Images
Our cross-load tests are described in detail here.
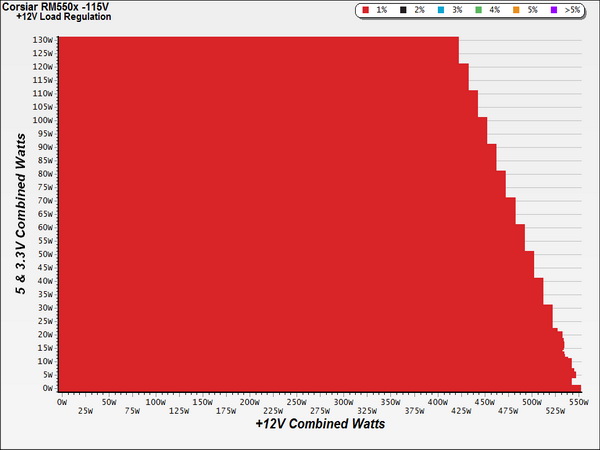
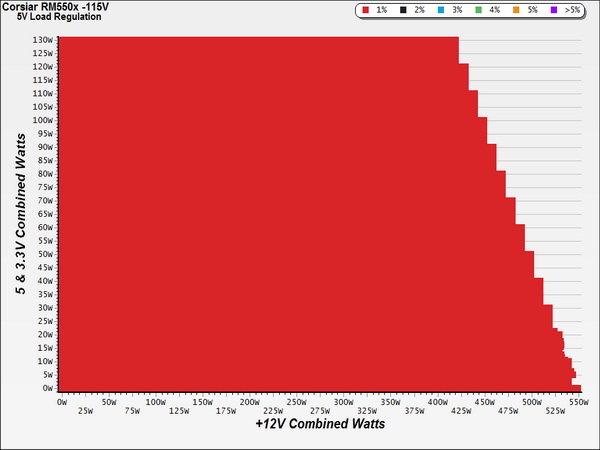
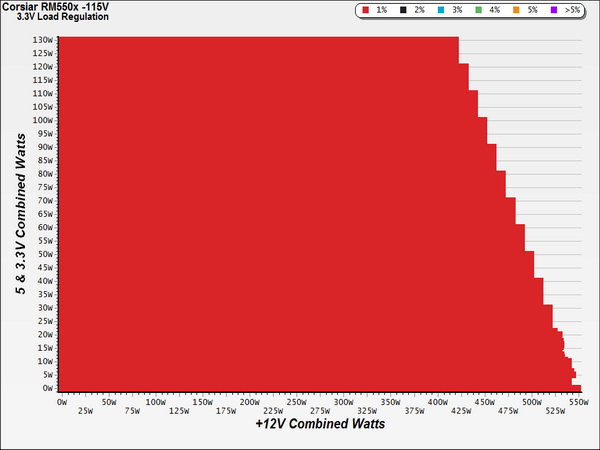
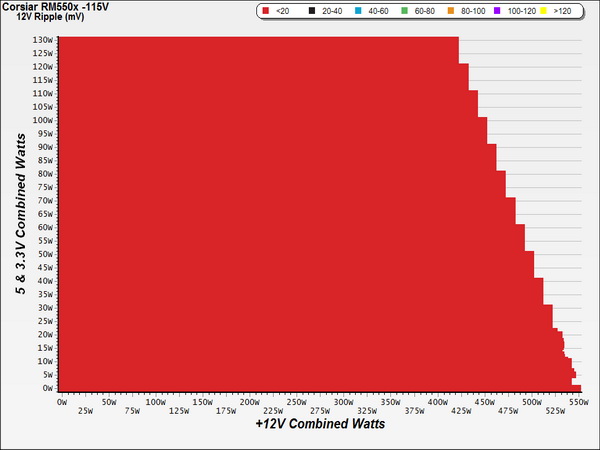
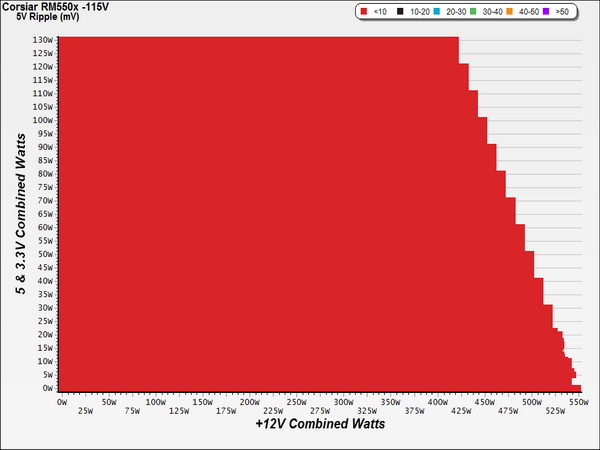
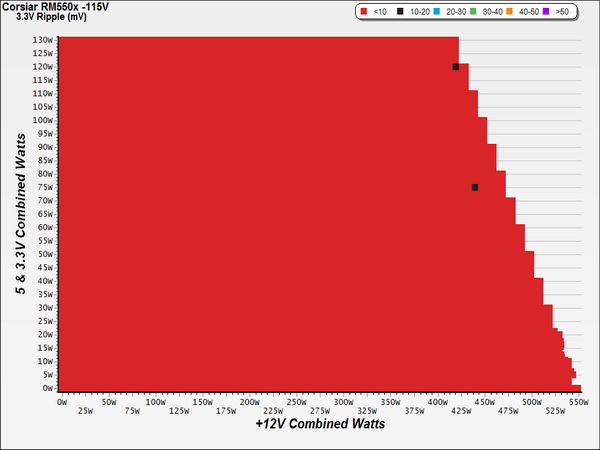
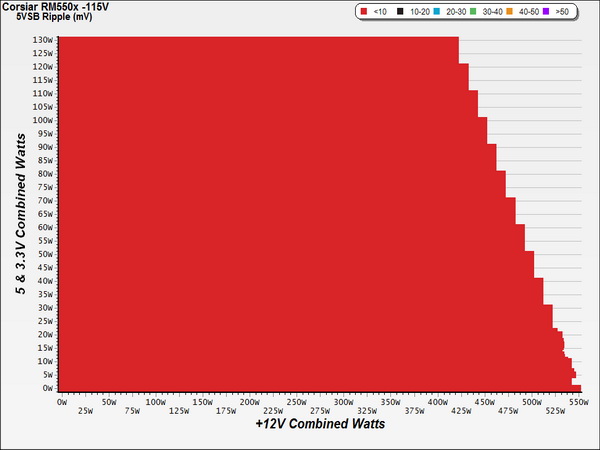
To generate the following charts, we set our loaders to auto mode through our custom-made software before trying more than 1500 possible load combinations with the +12V, 5V and 3.3V rails. The load regulation deviations in each of the charts below were calculated by taking the nominal values of the rails (12V, 5V and 3.3V) as point zero.
Load Regulation Charts
Efficiency Chart
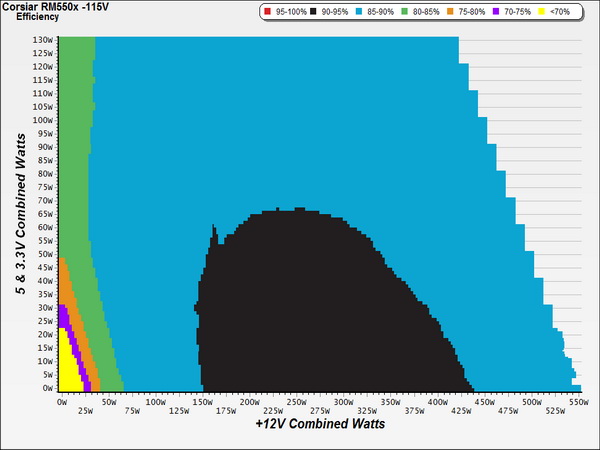
Efficiency isn't up to the levels that we expected in our cross-load tests based on what we already saw in our normal benchmarks. Don't get us wrong: these results are still pretty good for a Gold-rated PSU. However, it seems that applying more than 60W of combined load to the minor rails hits efficiency hard, yielding scores under 90%.
Ripple Charts
Infrared Images
Toward the end of the cross-load tests, we took some photos of the PSU with our modified FLIR E4 camera that delivers 320x240 IR resolution (76,800 pixels).
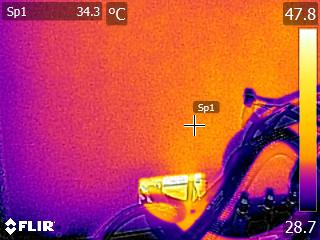
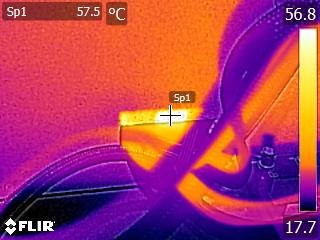
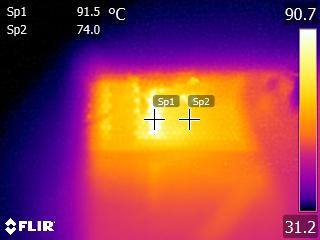
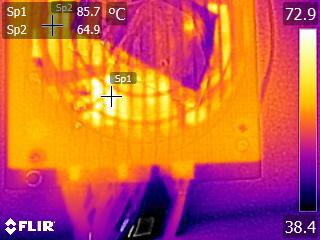
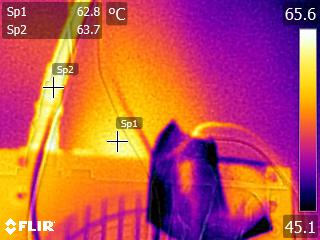
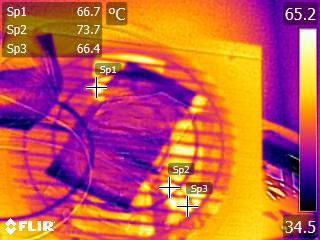
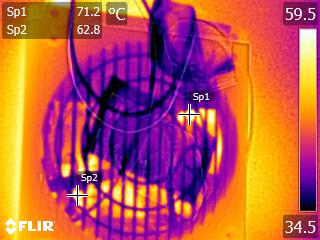
Semi-passive operation and low fan speeds have the effect of higher internal temperatures. Corsair doesn't seem to worry about this though, and you probably shouldn't either. After all, the operating temperatures inside a chassis with proper airflow will be much lower than what we measured under our hot box's harsh conditions.
Get Tom's Hardware's best news and in-depth reviews, straight to your inbox.
Current page: Cross-Load Tests And Infrared Images
Prev Page Efficiency, Temperature And Noise Next Page Transient Response Tests
Aris Mpitziopoulos is a contributing editor at Tom's Hardware, covering PSUs.
-
basroil From the performance it seems like CWT is finally something to consider... It's showing Leadex Gold/Seasonic levels of performance.Reply -
Dark Lord of Tech I love the RMX and RMI series , price just keeps me away from the purchase , very very solid.Reply
Knock a little off the price and these would fly out of warehouses. -
Dark Lord of Tech Yeah the 550w should be about 79.99 to 89.99 , no rebates.Reply
Then I would grab a few. -
JQB45 ReplyYeah the 550w should be about 79.99 to 89.99 , no rebates.
Then I would grab a few.
Corsair RMx 550W 80+ Gold Certified Fully-Modular ATX Power Supply
http://pcpartpicker.com/part/corsair-power-supply-cp9020090na
$79.99
$89.99 for the 650W version.
UPDATE:
Sorry thats with mail in rebates... -
Dark Lord of Tech I don't do rebates , takes to long , and maybe you get it maybe you don't , I'll wait for a newegg drop.Reply -
Nintendork We really need more platinum/titanium PSU's at 300-500w. Most PC's stays near idle and with the efficiency focused gpu's/cpu's they rarely exceed 100w unless you tax them.Reply -
turkey3_scratch Plus companies often don't even send you the rebates, sometimes they just say it was too late or some other bull crap like that. I agree with Blackbird. I've been waiting for a review of the 550 RMx, and what I get out of this review is that it trades blows with the 550 G2 that saying one or the other is better is just silly and extremely nit-picky. They are both incredible. Both offer a 7 year warranty, as only higher-wattage G2s offer the 10 year warranty. They are just so close, that when it comes to picking the better one, the cheaper one is better, and the G2 is cheaper.Reply
I've actually quit including rebates in my pcpartpicker lists. They are a pain and I don't think they reflect the true cost of an item. -
turkey3_scratch Reply17653281 said:We really need more platinum/titanium PSU's at 300-500w. Most PC's stays near idle and with the efficiency focused gpu's/cpu's they rarely exceed 100w unless you tax them.
I wish so, but unfortunately if this were to happen they would end up priced the same as any Platinnum/Titanium 650W unit. It's just the way it works. Quality low-wattage models are priced almost the same as the higher-wattage models. I would like to see something like a Titanium 250W model come out from Seasonic. Something like $40, fully modular. Will never happen, though.
