PNY CS1311 SSD Review
Why you can trust Tom's Hardware
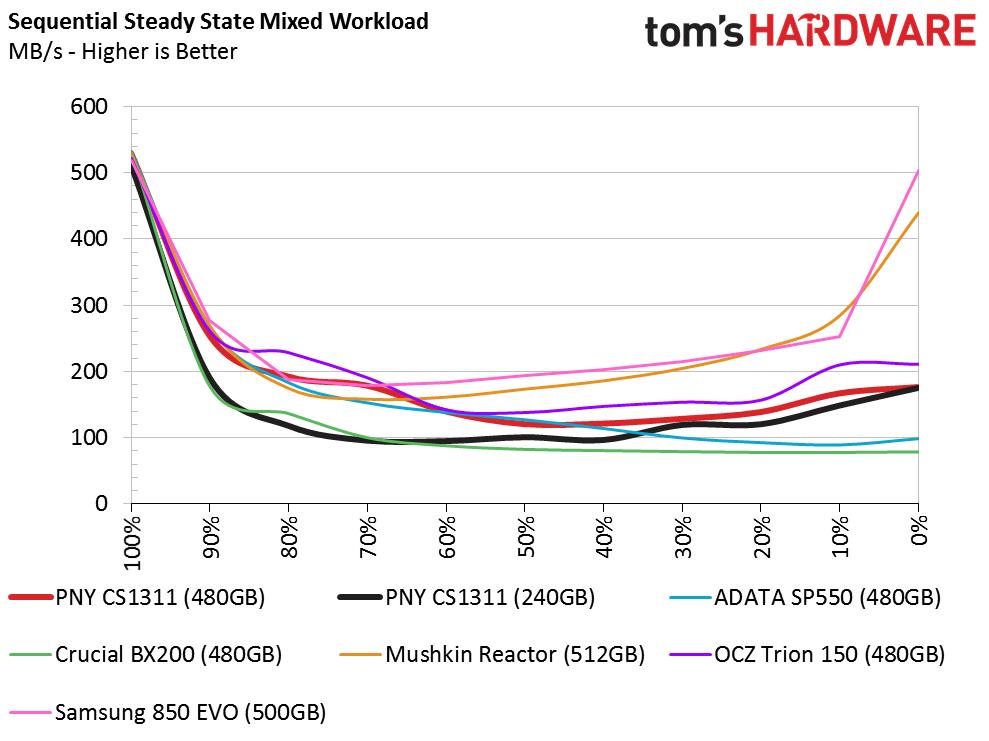
Mixed Workload And Steady State
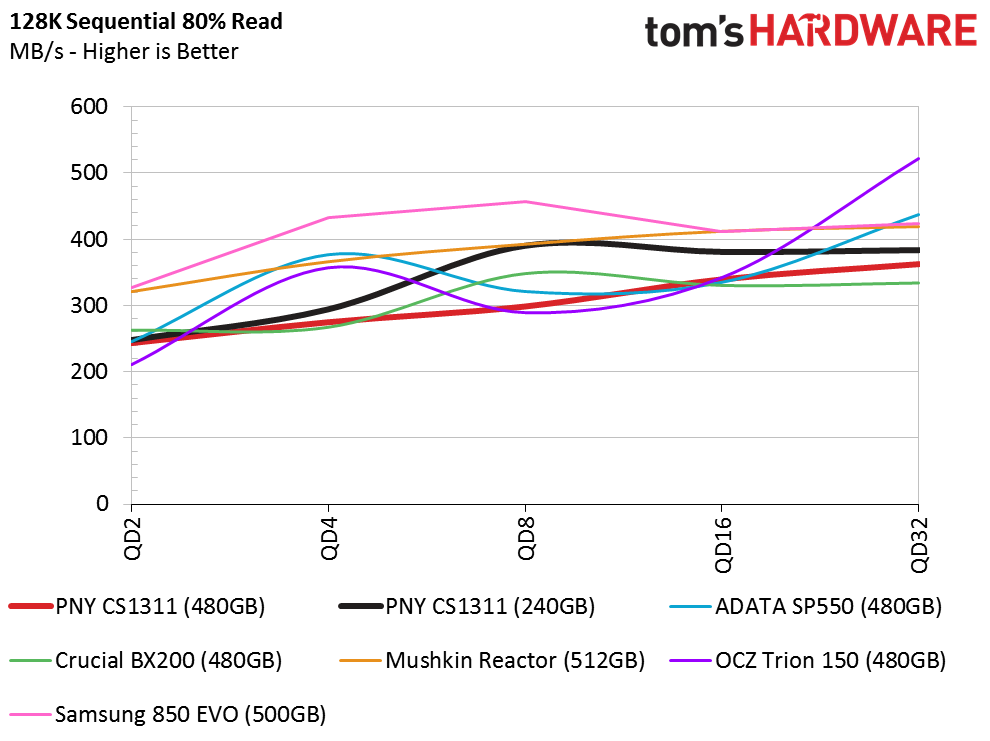
80 Percent Sequential Mixed Workload
Our mixed workload testing is described in detail here, and our steady state tests are described here.
We were surprised to see the smaller CS1311 performing slightly better than the higher-capacity model in our sequential mixed workload test. The 240GB CS1311 seems to flush its buffer more frequently than the larger model. And in some workloads, greater performance after the flush makes the smaller drive faster than the large one. In reality, this would probably only happen in rare corner cases though, seemingly at random.
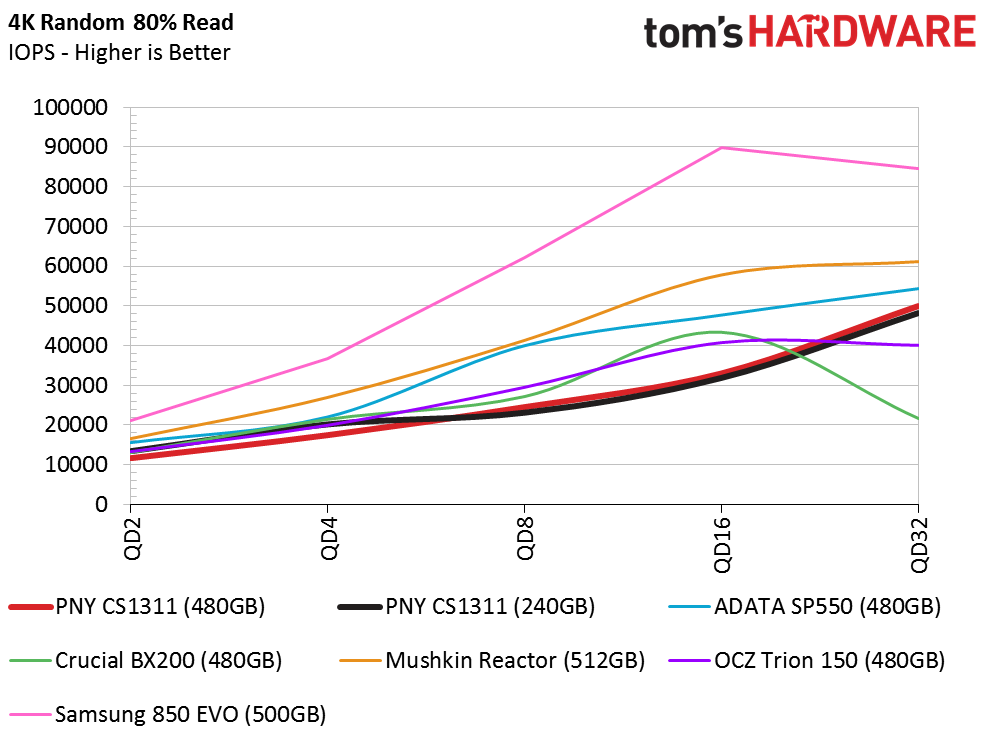
80 Percent Random Mixed Workload
The random mixed workload test shows us exactly what we expected to see based on our previous random transfer results. Both CS1311s find themselves at the bottom of this chart, even when there aren't many outstanding commands. There is only a slight speed-up from a queue depth of two to eight. We see the drives accelerate after that, but by then it's too late. Most desktop workloads aren't intense enough to see commands stack up.
Sequential Steady State
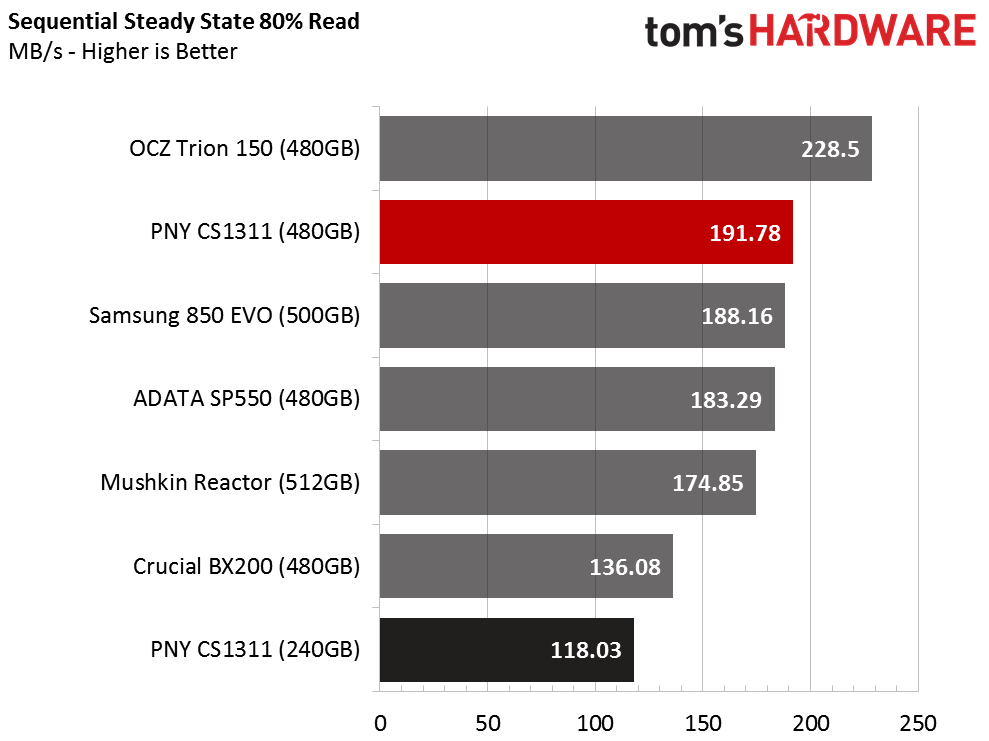
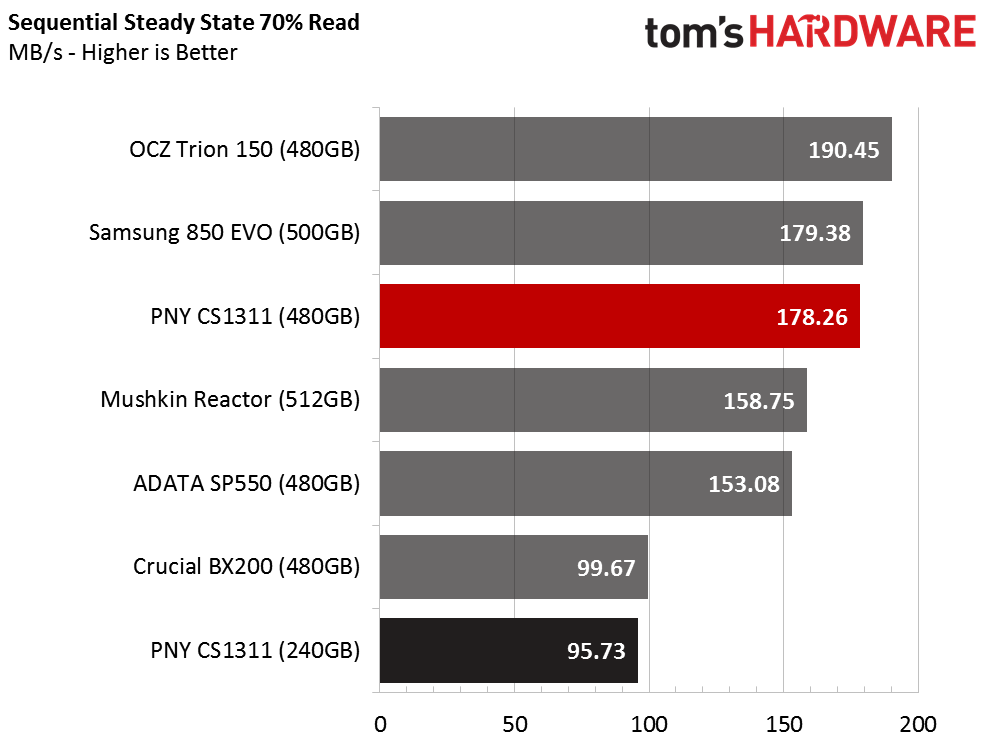
The sequential steady state tests expose a larger gap between the CS1311 SSDs than we've seen in previous benchmarks. The extra CE channels help the 480GB model. Then again, when we put smaller SSDs against larger ones, the lower-capacity drives almost always succumb. To keep our analysis balanced, we're only focusing on similar capacities. The 240GB CS1311 is only there because we received it at the same time and actually want to see how it fares.
In consumer desktop (80 percent reads) and workstation (70 percent reads) steady state workloads, the 480GB CS1311 does well against other low-cost SSDs. Performance drops off dramatically after 70 percent reads until the direct-to-die write algorithm helps increase performance over the two drives with Silicon Motion's SM2256 controller.
Random Write Steady State
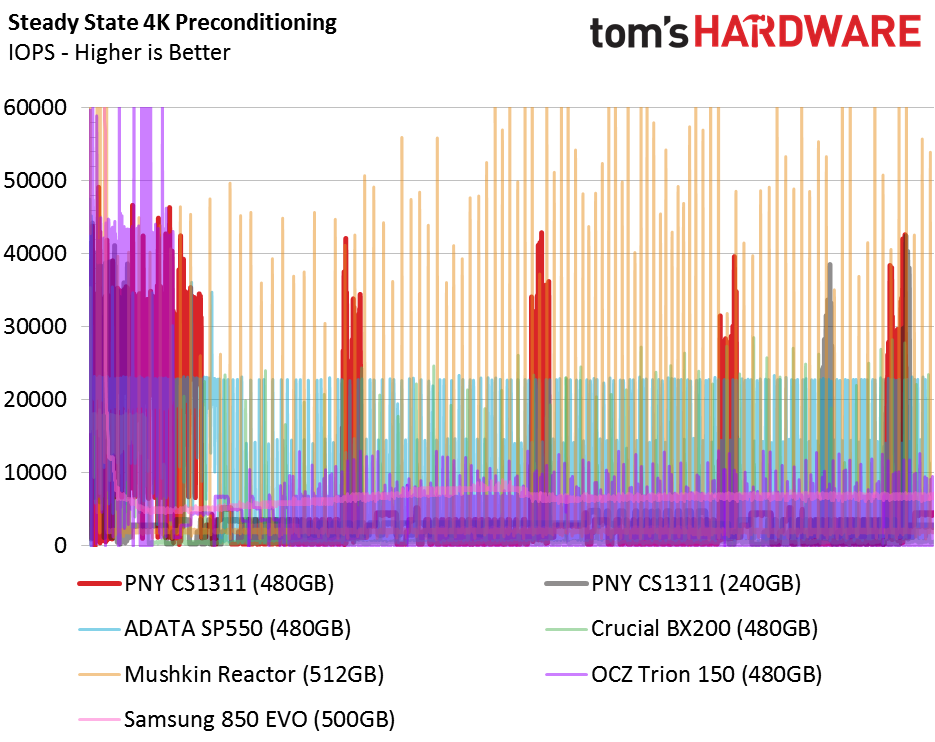
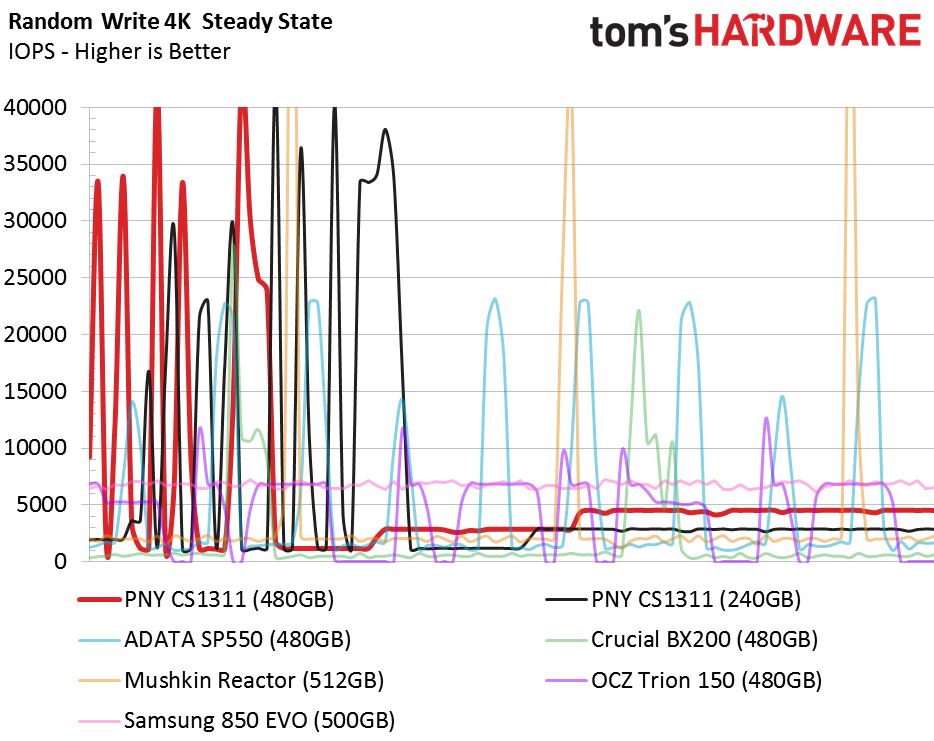
The preconditioning test shows us behavior we've never seen from an S10-based SSD armed with TLC flash. Something is different with the emulated SLC buffer that we didn't observe from the MyDigitalSSD or Patriot drives. The random steady state chart shows the final 100 seconds of our metric, where we see the buffered writes that peak to 42,000 4KB IOPS. Then, random write performance drops to a very low level before inching back up to 4500 IOPS.
Get Tom's Hardware's best news and in-depth reviews, straight to your inbox.
Current page: Mixed Workload And Steady State
Prev Page Four-Corner Performance Testing Next Page Real-World Software Performance
Chris Ramseyer was a senior contributing editor for Tom's Hardware. He tested and reviewed consumer storage.
-
cknobman Another one bites the dust.Reply
Sorry but I cannot see much of a reason to go with anything besides the Samsung right now.
-
2Be_or_Not2Be Thanks, Chris, for showing why we shouldn't buy this "one-step-back" SSD.Reply
It reminds me of when Honda introduced their new (new at the time) Insight hybrid. If you don't beat, match, or at least get very, very close to the market leader's (Prius) performance, you're not going to do very well with that model.
These "new" SSD models that have serious shortcomings aren't even worth purchasing for the price-savings over the EVO. -
3ogdy Yaaaaaaaaaaaaaaaaaaaaaaaaaaaaaaaaaaawn.Reply
There are so many players and products on the market in the SSD space right now that releasing more makes no sense unless there's anything special about it. They're all capped at SATA 6Gbps and performance sacrifices aren't worth the price difference ($7?!). I remember back in the day when SSDs were interesting. Now announcing a new SSD is like announcing a brand new higher-clocked Pentium IV CPU.
That's without even considering the already boring pricing on these things. Samsung's been selling the 500GB EVO for around $150 for way too long. Thankfully, they've come up with V-NAND, otherwise SSDs feel like '90s products already. At least 10 years on the market and no progress (thank you, SATA). Wake me up when 500GB drives are sold for less than $100 and then, maybe then, we could get this whole turtoise of an industry just a frucking bit forward. Until then, SSDs are not worth reviewing, except for a new case design they could feature. Meh. -
jojesa Most users wont see the difference in performance. I have installed both SSDs on the same Dell Latitude model and they bootup time, apps loading and shut down time looks exactly the same. I cannot tell the differences.Reply -
zodiacfml Please don't praise the Samsung too much as we don't want them monopolizing the SSD market. I think they are squeezing the prices down to prevent competitors from growing.Reply -
Jack_565 I would buy this just for the outward appearance of the SSD, if it goes on sale then i might consider one.Reply
Makes me wonder why cosmetic SSD Skins/Cases aren't a thing, ignoring voided warranties. -
mapesdhs Again nothing to compete usefully with the 850 EVO, though at least in the UK pricing for 850 EVOs has been going up a lot since xmas, especially the 250GB which reached a low of 53 UKP over the holiday season, but now is back right up to over 70 UKP. The 500GB has been more stable, and better value, but IMO a "good" SSD like the 850 EVO 500GB is not dropping below 100 UKP here because it doesn't need to. This happened before with the Samsung 830 a few years ago, people were happy to pay a lot more than the 125 UKP price offered by one UK seller for a couple of weeks (they sold over a thousand units), so pricing for 256GB models in general went up for several months.Reply
What happened to the competition SanDisk said they were going to bring to the market? I'm sure toms reported a couple of years ago that SanDisk was planning an 8TB model reasonably soon.
