Samsung SM951-NVMe RAID Review
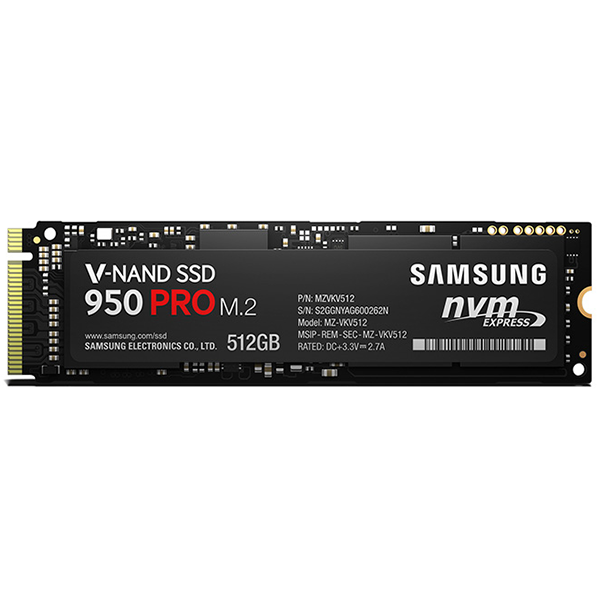
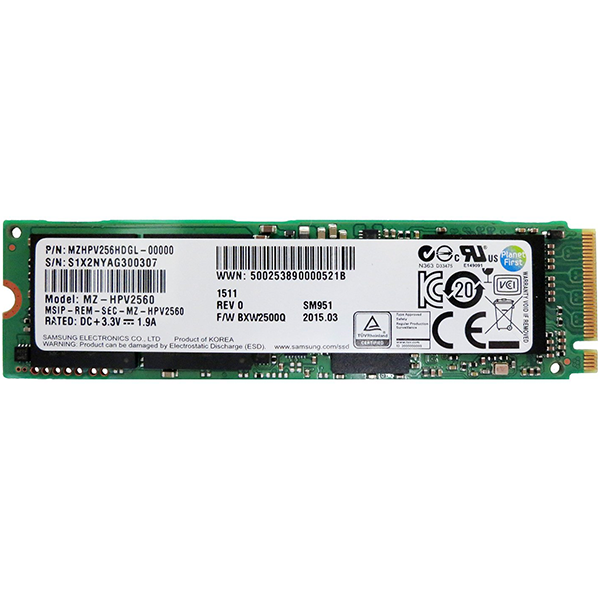
The Samsung 950 Pro is available now and it's a hot seller, but the SM951-NVMe still packs a better value for shoppers looking to save. Today, we look at three Samsung PCIe solutions in both single-drive and RAID 0 configurations.
Why you can trust Tom's Hardware
Performance Testing
Today we're running three pairs of drives through our benchmark suite. The single-drive results come from an ASRock Z97 Extreme6 motherboard with an Ultra M.2 connection directly to the CPU. The RAID results are from an ASRock Z170 Extreme7+ with M.2 connectors routing through the PCH.
Sequential Read Performance
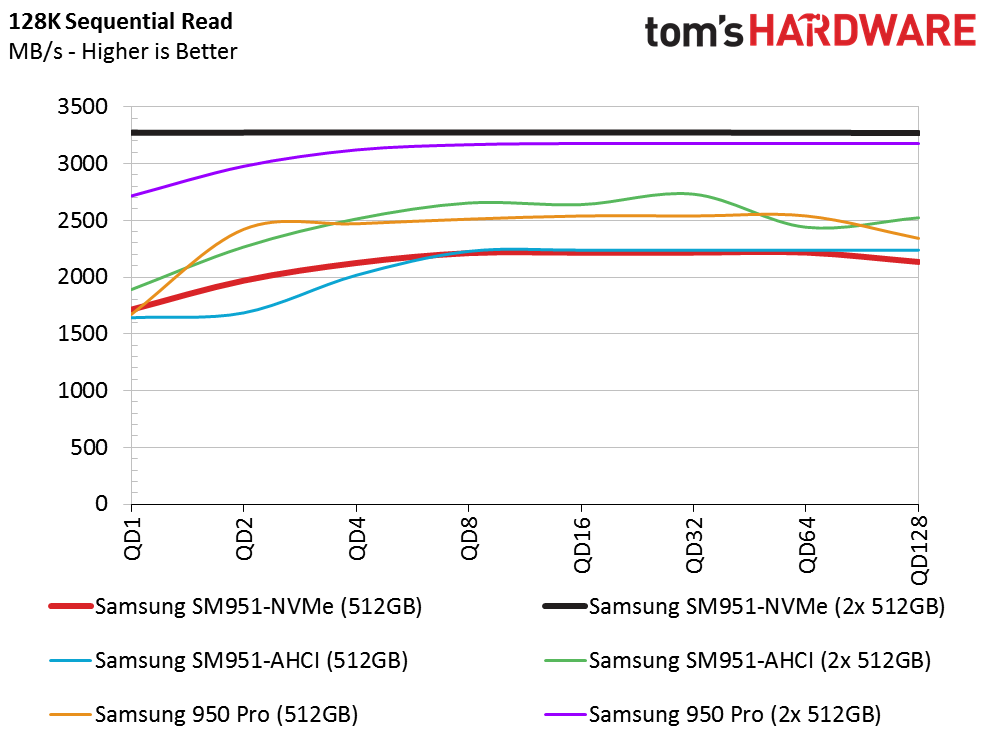
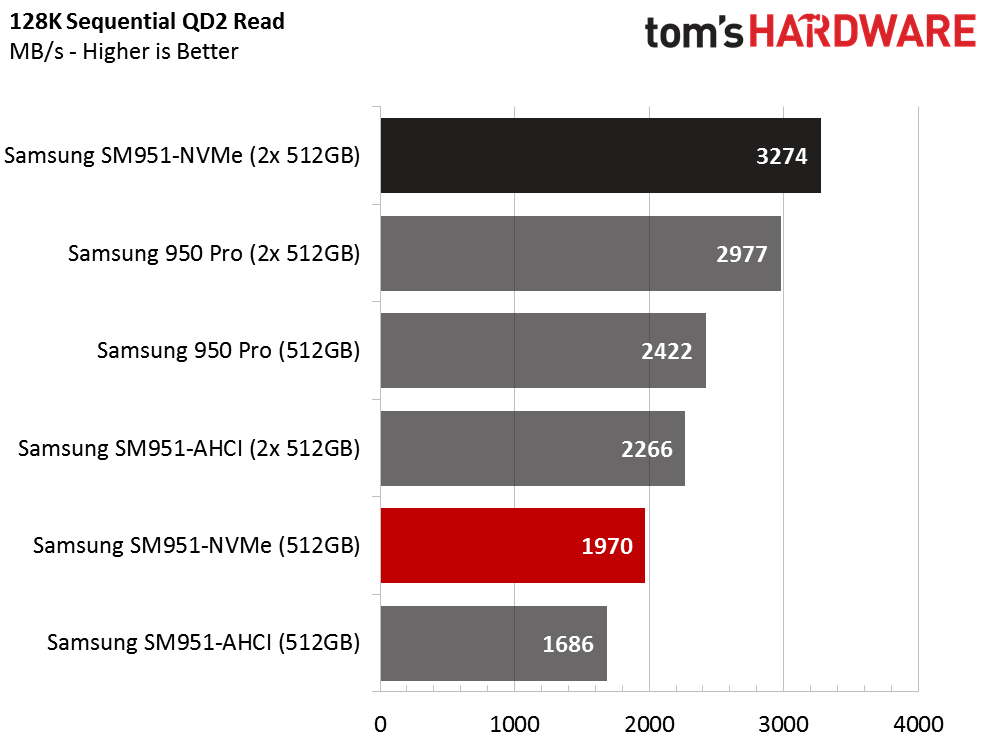
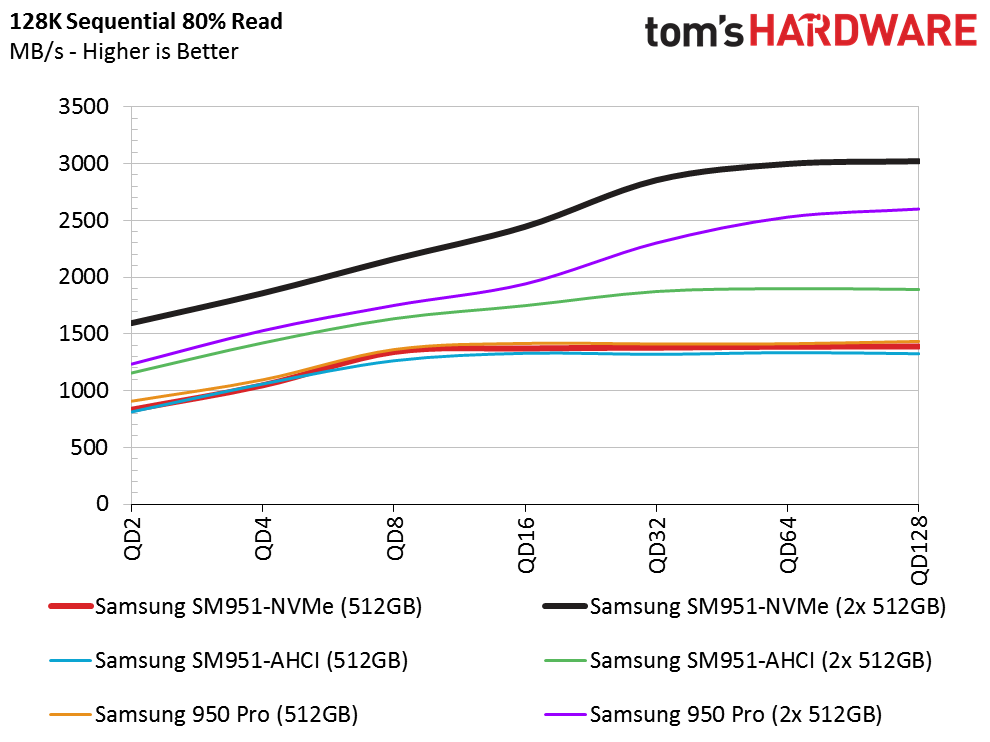
We're highlighting the SM951-NVMe 512GB and its RAID 0 performance in our charts. Notice that the SM951-AHCI RAID array fails to hit the same performance levels as the two NVMe-based arrays, even in the sequential read test. The NVMe protocol incurs less latency overhead with each request, allowing drives to achieve better results.
In addition, the SM951-NVMe RAID 0 array is slightly faster than the two 950 Pros in RAID 0, even though the 950 Pro is a little faster as a single drive.
Sequential Write Performance
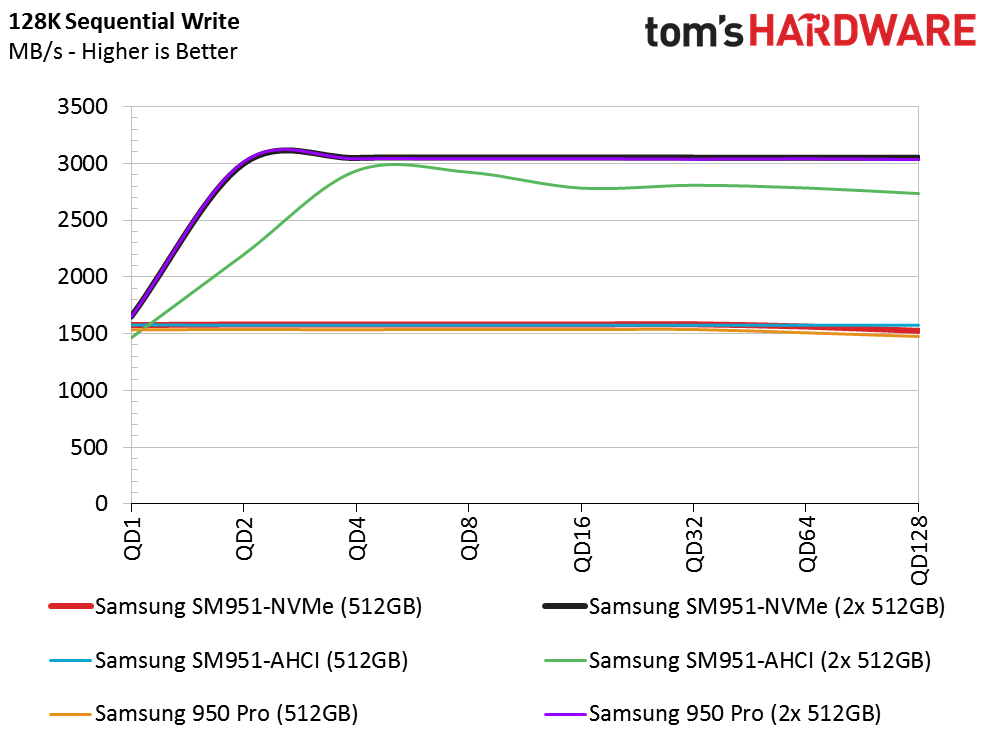
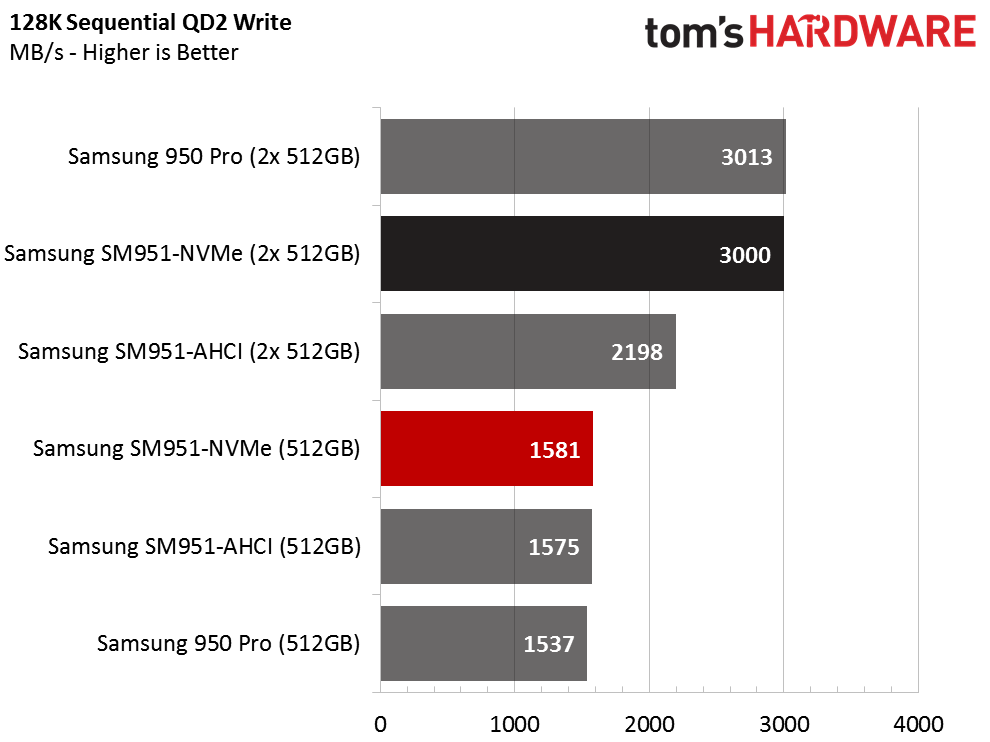
All three of the RAID 0 arrays scale really well, and the two NVMe-attached SSDs deliver nearly identical performance.
Samsung specs the drives with four workers and not simply a queue depth of four. Performance does increase for all products under the enterprise-like workload, but we still test with a focus on desktop performance. Using our methods, all three drives deliver nearly identical sequential write performance.
Random Read Performance
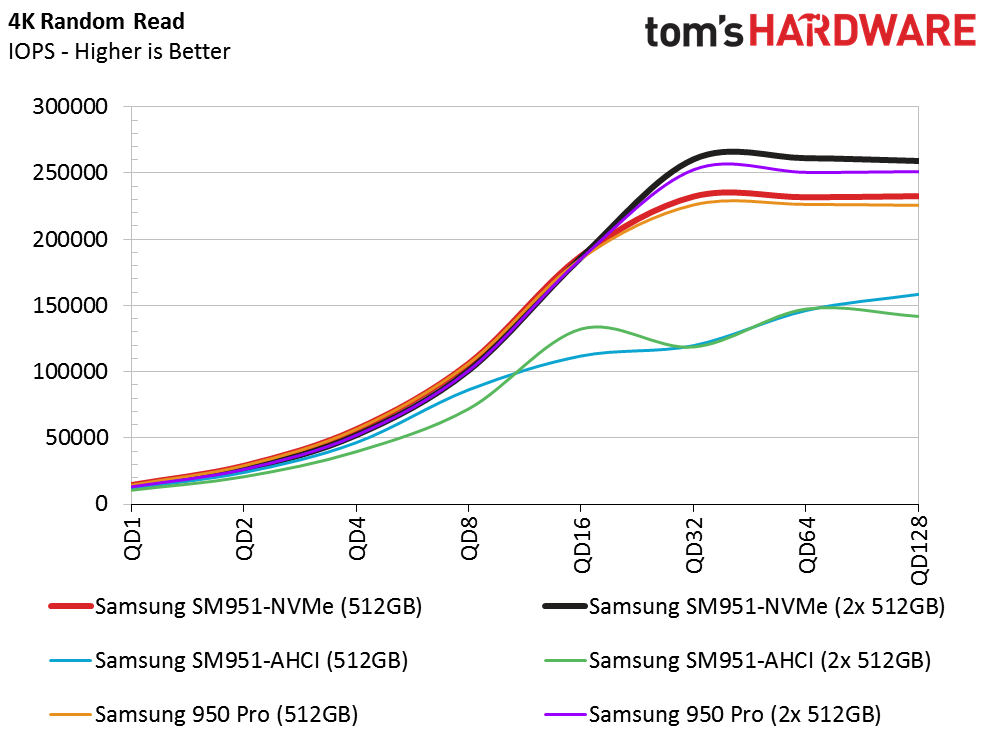
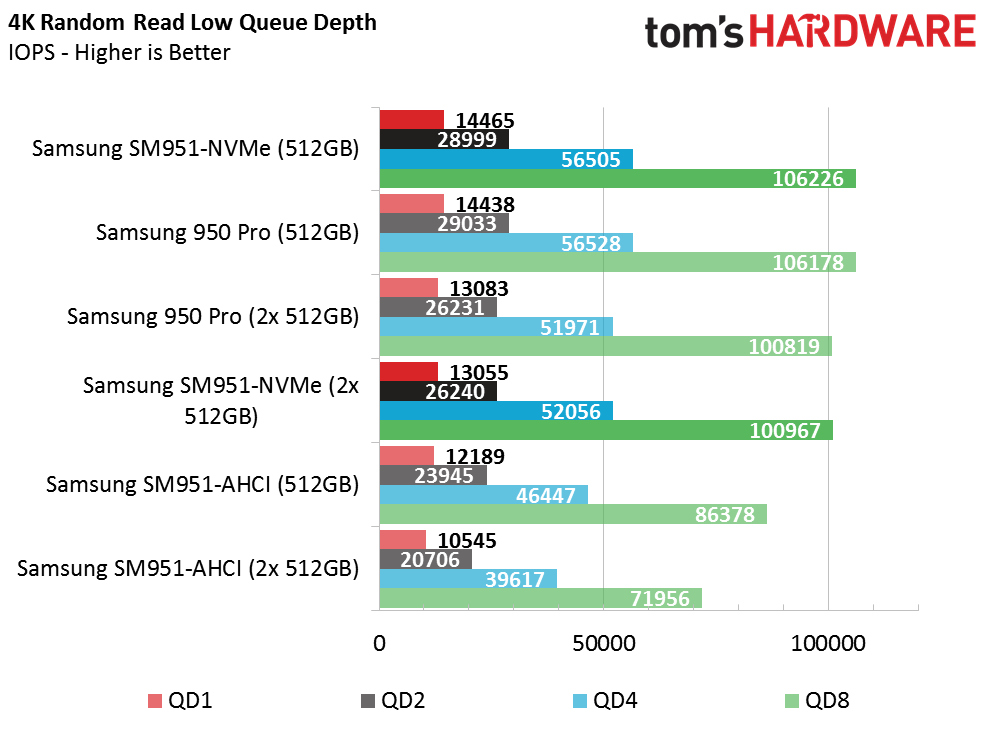
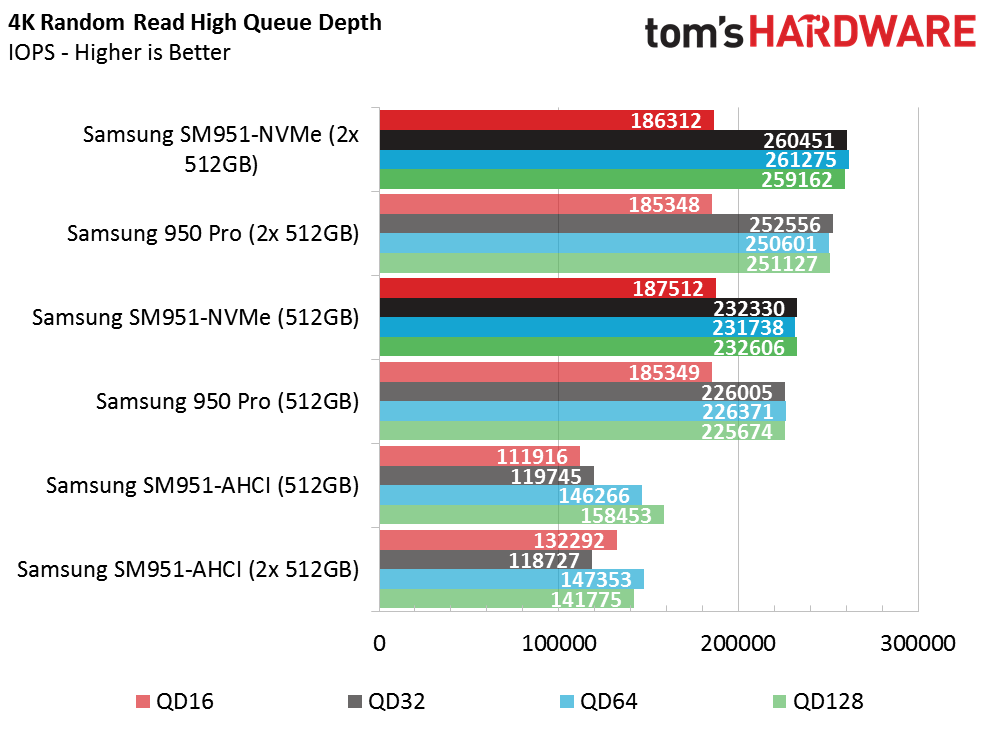
Up until a queue depth 32, the NVMe drives and their RAID arrays achieve roughly the same performance. Even under heavy desktop workloads, you won't get a bump in random reads using these SSDs in RAID 0. The NVMe drives also demonstrate only a slight advantage over the AHCI-attached SM951.
Random Write Performance
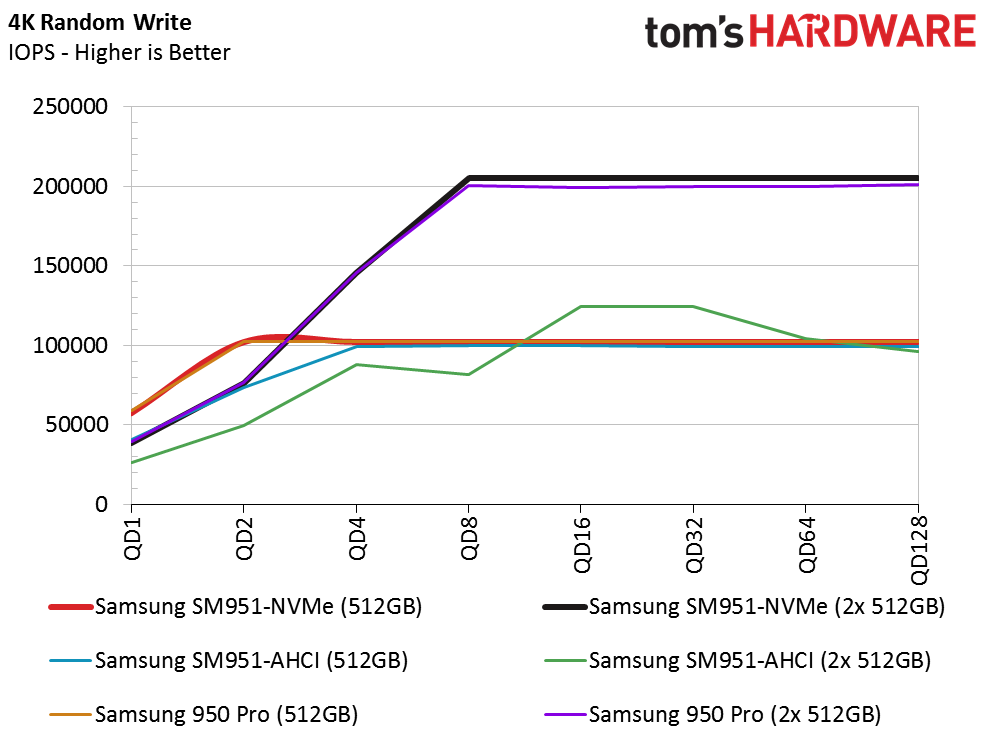
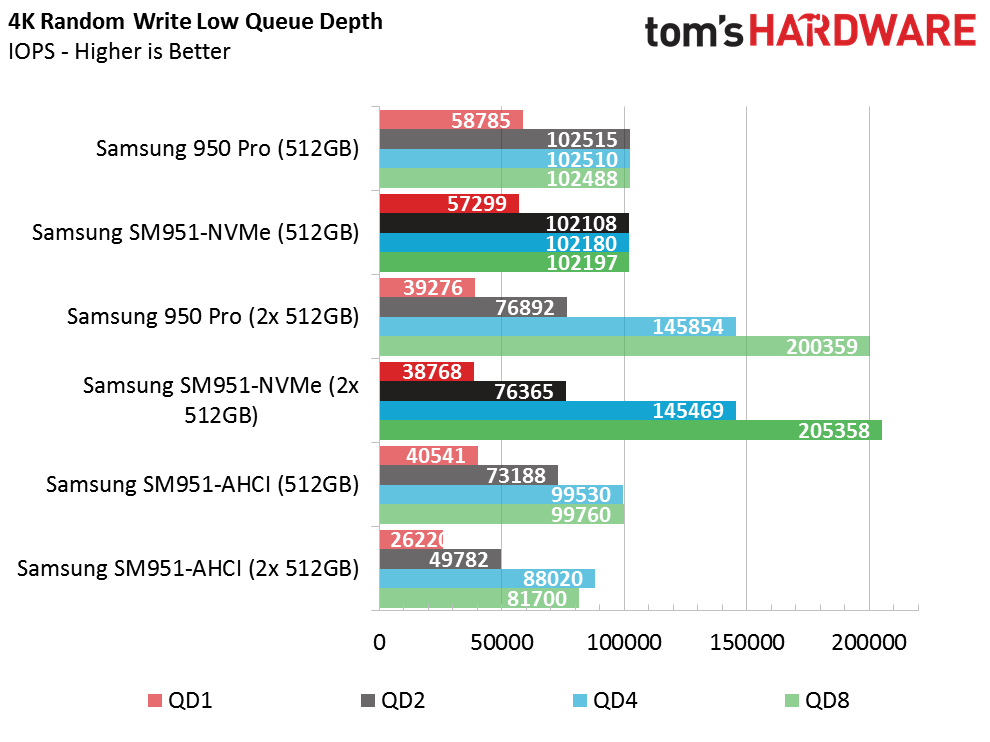
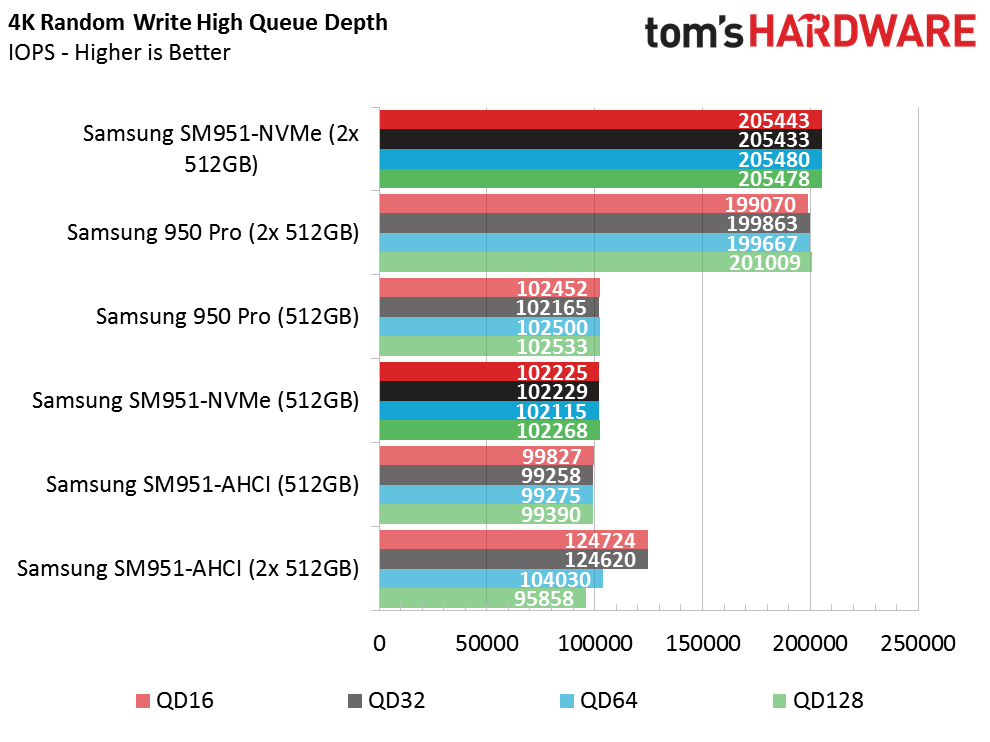
Random write testing favors the RAID array after a queue depth of two. It's more common to see commands stacking up while writing random data than reading it. Heavy multitasking does exploit the array's benefits, but it takes a demanding workload to get there. Professionals running CAD and CAM software will appreciate a RAID 0 array's extra performance.
Get Tom's Hardware's best news and in-depth reviews, straight to your inbox.
At low queue depths, the RAID arrays actually degrade random write performance across the board.
Sequential 80 Percent Read
Mixed workloads demonstrate how much separation there is between individual drives and pairs in RAID 0. Mixing workloads is a more realistic way to measure performance anyway because your computer rarely reads or writes data exclusively.
This is also where the SM951-NVMe pulls away from Samsung's 950 Pro in a two-drive RAID 0 array. Until recently, we assumed that V-NAND was superior to Samsung's planar flash in every way. That may not be the case, though.
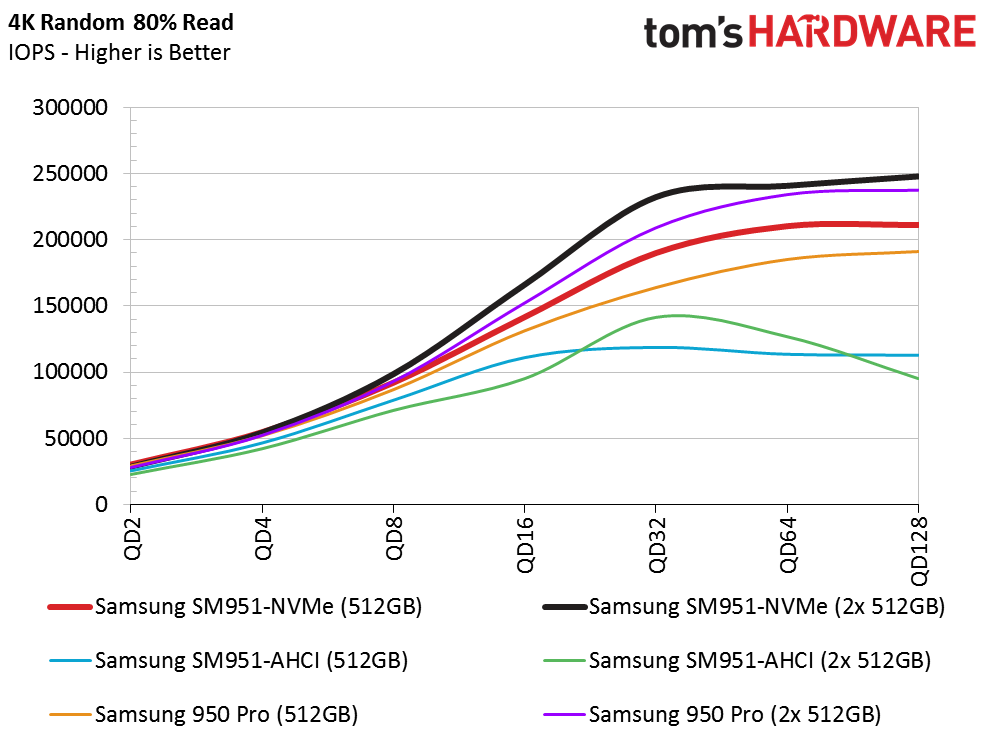
Random 80 Percent Read
The mixed random data test also shows the SM951-NVMe overshadowing Samsung's 950 Pro in RAID 0. The single-drive SM951-NVMe is also faster than the single 512GB 950 Pro. The differentiation doesn't show up until we hit higher queue depths though, so enthusiasts won't see the delta in day to day tasks.
Sequential Steady State

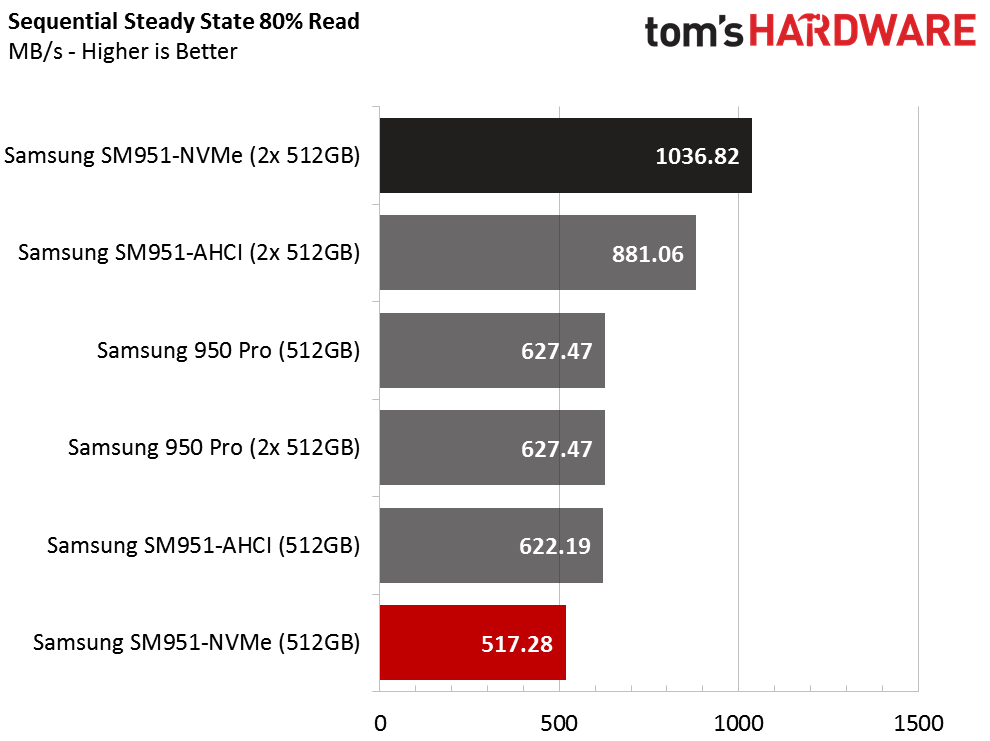
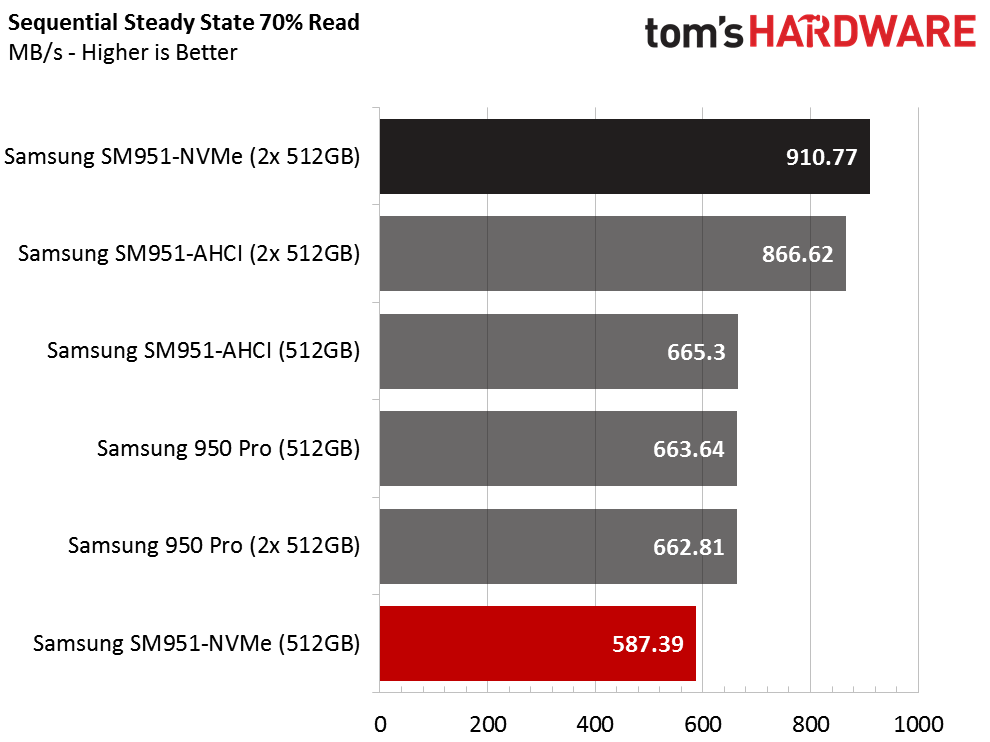
It's difficult to see the striped 950 Pros on this chart because the orange lines are buried in the group at the bottom. The SM951-NVMe in RAID 0 is superior under steady state conditions.
Even though the SM951-NVMe is faster, it isn't automatically better for steady state workloads. The 950 Pro has a higher terabytes written (TBW) rating for endurance. Really, neither drive is designed for extremely heavy use for extended periods of time in steady state.
Random Steady State
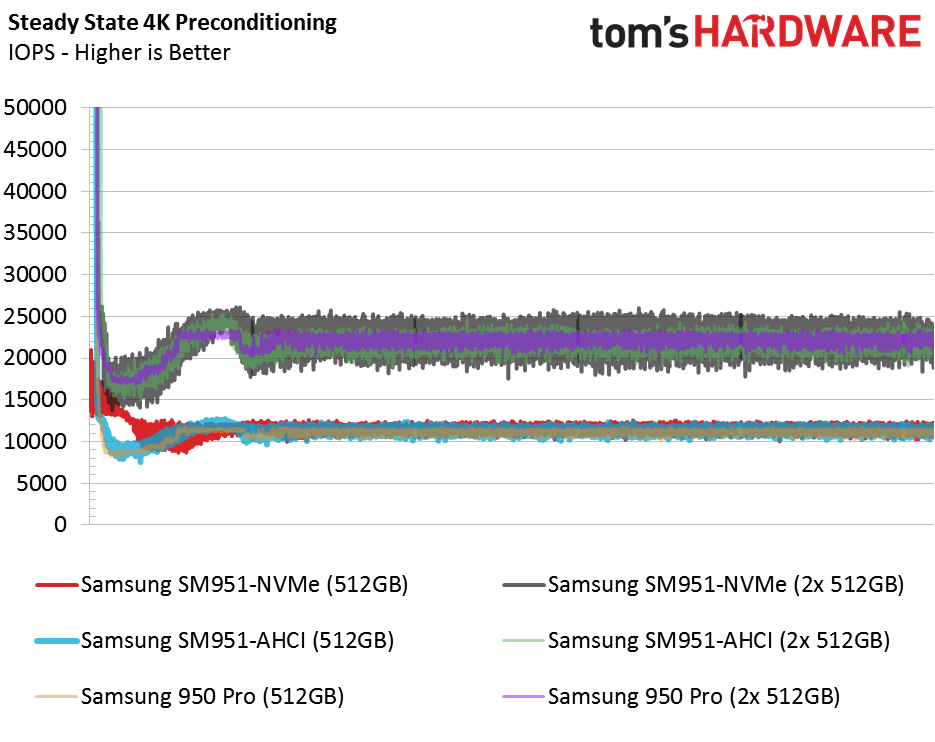
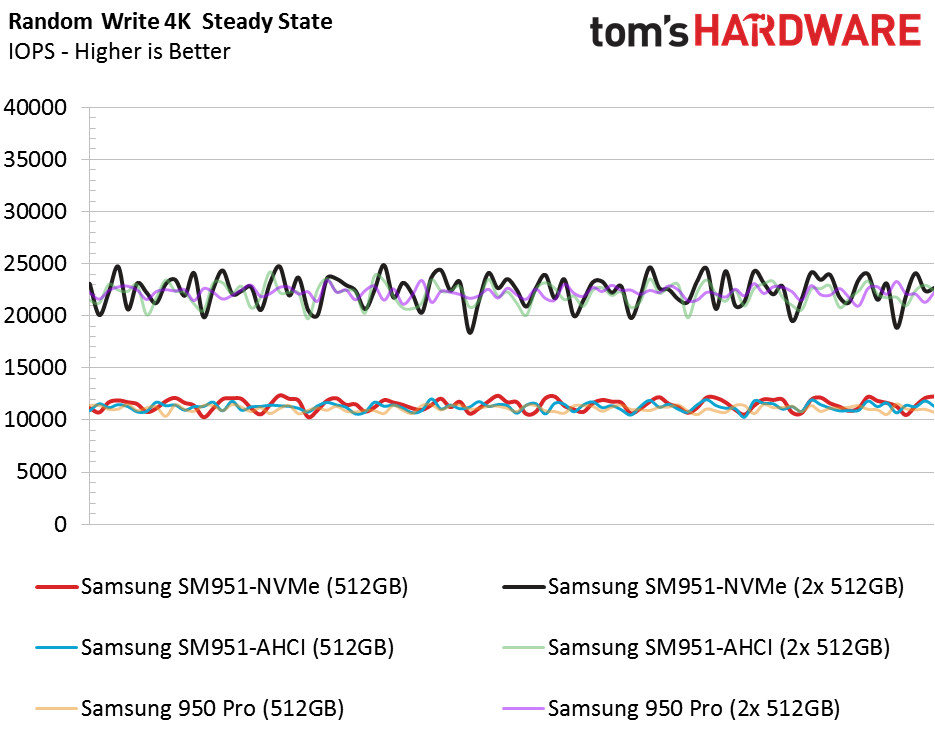
The single-drive and RAID pairs are separated into groups in random steady state. This test pushes the controller more than it does the NAND or firmware. Because all three models use the same controller, the comparable performance outcome isn't surprising.
Current page: Performance Testing
Prev Page Specifications, Pricing, Warranty And Accessories Next Page Real-World Software Performance Testing
Chris Ramseyer was a senior contributing editor for Tom's Hardware. He tested and reviewed consumer storage.
-
CaedenV Conclusion: Putting this in your gaming PC is a waste of money... but having this RAID setup in a WSUS or SQL Server for a school or medium sized business would make things fly at unbelievable speeds!Reply
Man I can't wait to have NVMe capabilities, but the real world performance advantage is not that great compared to my current setup. Hopefully in a few years when truly fast DDR4 gets cheap, and we have truly 4K capable single-GPU solutions that don't cost $500+ then it will be time to do a massive overhaul. -
abbadon_34 ReplyConclusion: Putting this in your gaming PC is a waste of money... but having this RAID setup in a WSUS or SQL Server for a school or medium sized business would make things fly at unbelievable speeds!
Man I can't wait to have NVMe capabilities, but the real world performance advantage is not that great compared to my current setup. Hopefully in a few years when truly fast DDR4 gets cheap, and we have truly 4K capable single-GPU solutions that don't cost $500+ then it will be time to do a massive overhaul.
/me drools at the thought -
Non-Euclidean So I wasted my money. Sue me.Reply
What I want to know is did Samsung finally manage to put the label on right side up? From the second page of the article it looks like they did. About time.
The Random Steady State graph is mislabeled. It should be "This is your brain on NVMe"
And the conclusion is a bit off also. The 950 Pro is going for 326 at NewEgg and has been in that ballpark for a while. -
xenol ReplyConclusion: Putting this in your gaming PC is a waste of money... but having this RAID setup in a WSUS or SQL Server for a school or medium sized business would make things fly at unbelievable speeds!
Unless those inquiries are huge, I'm not even sure about that. The AHCI access time isn't too far off from NVMe in RAID.
Man I can't wait to have NVMe capabilities, but the real world performance advantage is not that great compared to my current setup. Hopefully in a few years when truly fast DDR4 gets cheap, and we have truly 4K capable single-GPU solutions that don't cost $500+ then it will be time to do a massive overhaul.
Access time is what kills these kinds of things. -
2Be_or_Not2Be RAID-5 isn't the only path to fault tolerance; RAID-1 (simple mirroring) also gives you fault-tolerance with only two drives. Of course, capacity is only the size of 1 drive.Reply
It can give you a bit higher read performance, too, though mainly at higher queue depths. -
dgingeri How is the SM951 a better deal? On Amazon, the SM951 is $10-25 more expensive, depending on capacity. I don't see how this is "better value."Reply -
CRamseyer At the time of writing the SM951-NVMe 512GB was lower than the 950 Pro. I still show the 512GB model with a lower price but the gap is much less now.Reply -
dgingeri I'm showing the 512GB 950 pro at $327 on Amazon as the lowest price I could find. I found the 512GB SM951 for $325. That's not much discount considering the warranty coverage and durability.Reply
