How to Use Windows Debugger to Fix Crashes
The WinDbg (Windows Debugger) tool has been around and helping users diagnose their BSODs and individual program crashes since the days of Windows 7 and Windows Server 2008 R2. But learning WinDbg requires climbing a learning curve, and it takes a little while to figure out how things work. Ditto for learning to drive its command-heavy interface. However, Microsoft has offered an alternate version based on UWP that is more automated and much, much easier to learn and use.
UWP WinDbg will help you with all of the different dump file types that Windows creates to capture error information, and it makes visualizing and examining their contents simple and straightforward. Before I explain where and how to grab WinDbg Preview, let me explain a bit more about what it does, starting with dump files.
An Anatomy of Memory Dump File Types
You can read more deeply on this topic in the MS Docs item “Overview of memory dump file options for Windows.” According to that reference, Windows can create any of these memory dump file types when a provoking error occurs (quoted verbatim):
Article continues below- Complete memory dump: captures the entire contents of system memory when a stop error (BSOD) occurs. It includes data from processes running when the dump was collected. To use the complete memory dump option, your paging file must be configured on the boot volume to be 1MB larger than physical RAM installed (on my PC, for example, with 16 GB or 16,384 MB, that means 16,385 MB). I seldom bother with this kind of dump file because it takes up copious space on the boot/system drive, and my desktop doesn’t do that much paging activity anyway. Conventional wisdom is that you can set this up if you need a complete memory dump should Microsoft or a third-party vendor ask you for you. Otherwise, they consume too much space.
- Kernel memory dump: records only kernel memory, which is memory that’s allocated to the OS kernel and the hardware abstraction layer (HAL), and to kernel-mode drivers and other kernel-mode programs. As MS itself says “this dump file is the most useful.”
- Small memory dump (64 KB): Captures minimal information about an error. For stop errors, for example, it grabs the stop message plus its parameters and associated data. It also grabs a list of loaded drivers, the processor content block for the processor that stopped, information and kernel context for both the stopped process (EPROCESS) and the stopped execution thread (ETHREAD). Finally, it also grabs the kernel-mode call stack for the thread that stopped. By default small memory dump files reside in the %SystemRoot%\Minidump folder.
- Automatic memory dump: contains the same info as a kernel memory dump, but is created when Windows manages page file size (that is, paging file is set to System managed size). Windows can monkey with the paging file size if a crash occurs and the paging file can’t capture all the information needed to obtain a complete kernel memory dump snapshot. See this Docs item for more details: Automatic Memory Dump.
The 10,000-foot view of what WinDbg and WinDbg Preview do is to open Windows files that end in the dumpfile .dmp extension. Both tools will let you explore those files in considerable depth. WinDbg Preview is preferable because it makes the job of exploration much easier. But first, here’s how to grab and install a copy of WinDbg Preview.
Download and Install WinDbg Preview
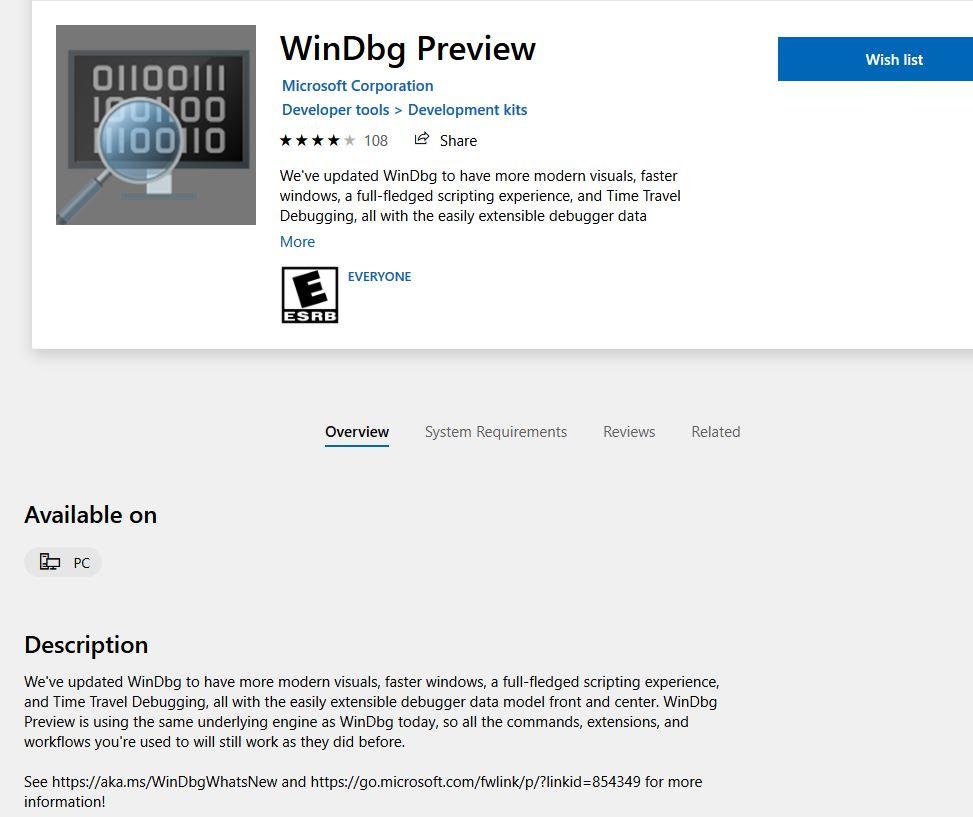
Like most UWP programs, WinDbg Preview is available from the Windows Store. Thus, you can search for “WinDbg Preview” inside the store, or simply follow this link. Either way you’ll see the following information come up inside the Windows Store on your PC as shown below.
To download the program, click the Download button. Once it finishes downloading, an Install button will appear. Click the Install button to get it installed on your PC. Once that happens you can fire off the program through the Start menu by typing “WinDbg Preview.” This brings up the info shown in the lead-in graphic for this story. Click that icon, and the program will load.
Finding .DMP Files on Your PC
You may be surprised at how many .dmp files reside on your Windows 10 or 11 PC. You can use Explorer to suss them out for you. I prefer Voidtools Everything, a free and very fast file indexing and search tool.
Get Tom's Hardware's best news and in-depth reviews, straight to your inbox.
When I used Voidtools Everything, the app came up instantly with 82 such files on my C: drive; it took Explorer nearly 3 minutes to come up with the same list. Once you have such a list, you can get ready to plug a specific .dmp file into WinDbg Preview by right-clicking a filename while holding down the left Shift key. This adds the line “Copy as path” to the context menu, which is what you want to do so you can tell WinDbg Preview exactly where to find the .dmp file you want to examine more closely.
For the purposes of this story, I picked a dump file from File Explorer out of simple curiosity. I chose the file named explorer.exe.9736.dmp with a complete path specification of "C:\ProgramData\Norton\LocalDumps\explorer.exe.9736.dmp" (the quotes are automatically included when you make the context menu selection Copy as path).
Plugging a DMP File into WinDbg Preview
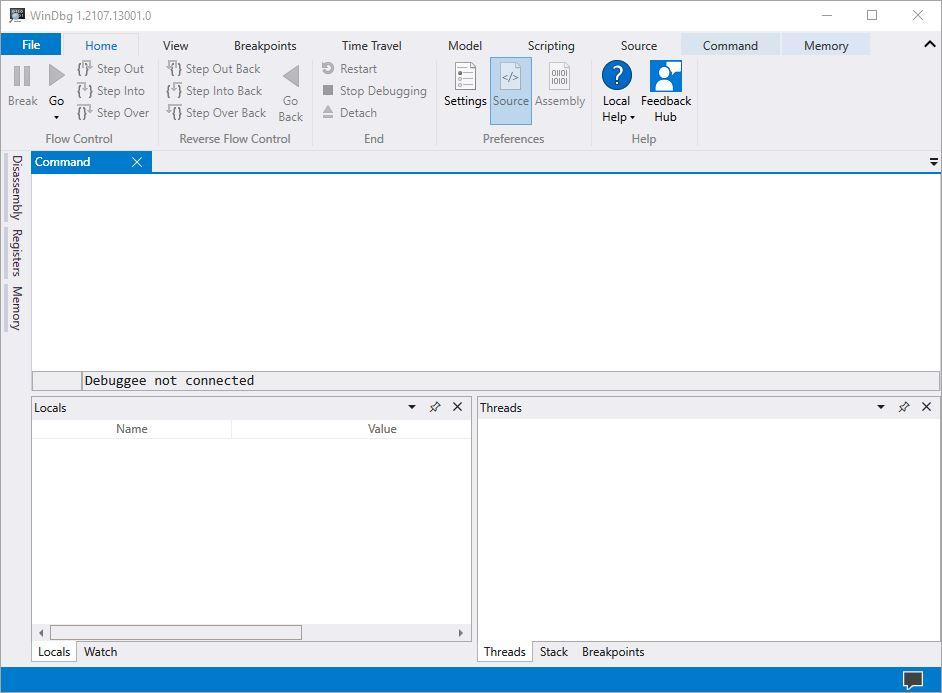
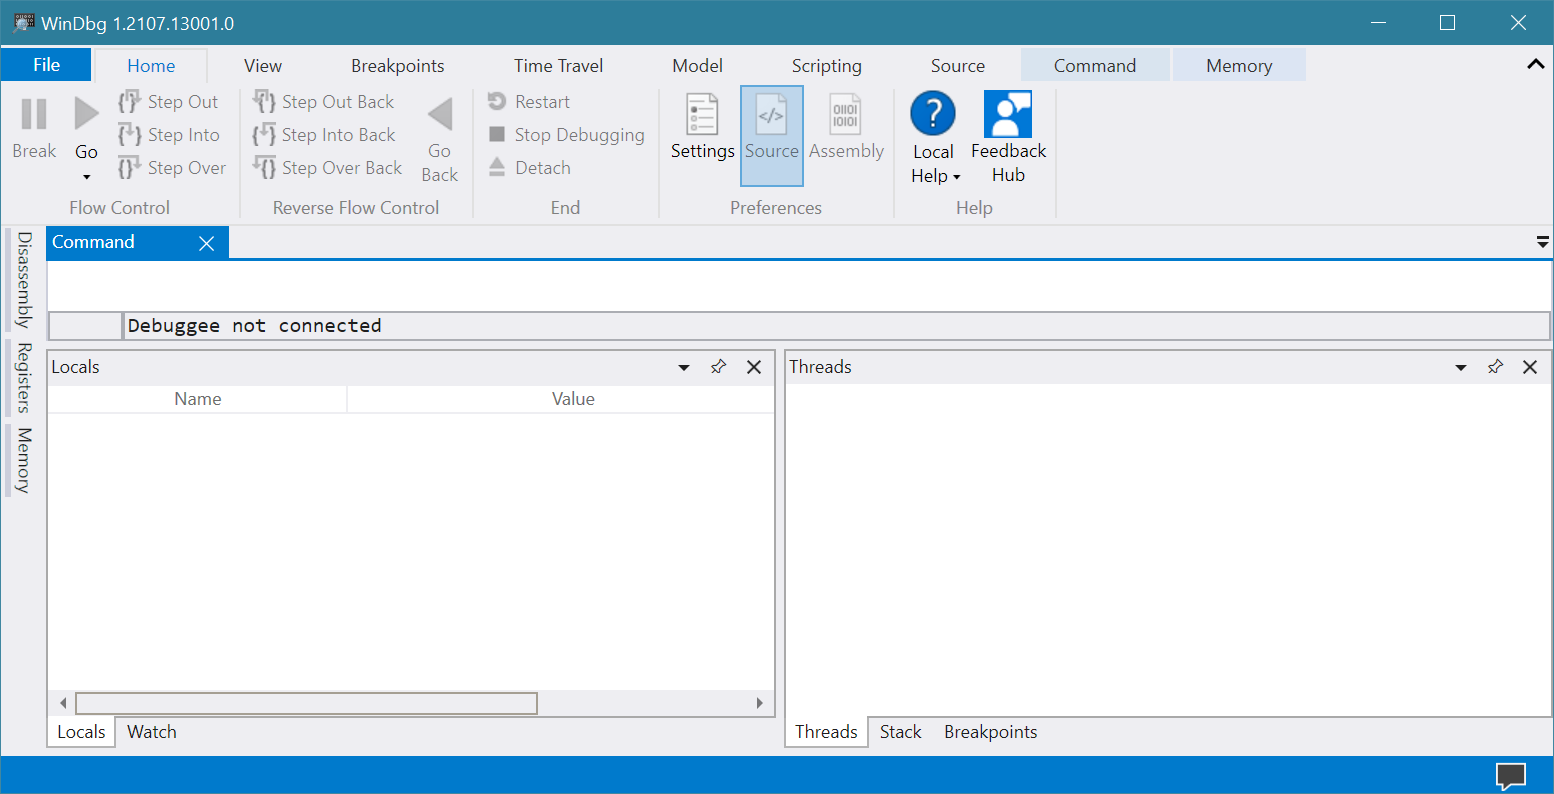
Open the program and you’ll see a generic layout appear.
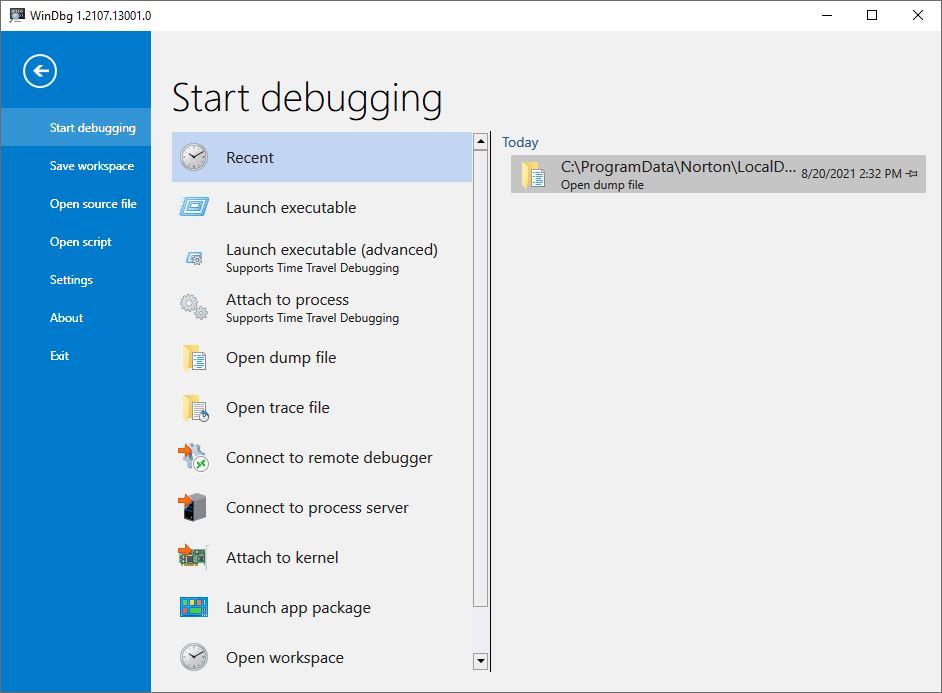
So far, there’s really nothing to see or do just yet. Next, click the File menu at the upper left (already highlighted in blue). This produces the File options menus, as shown below. Here, you’ll select the item that reads “Open dump file” (fourth from the top, under the Start debugging heading).
If you grabbed the full path specification as I explained in the previous section you can paste it into the File name box and it will take you right there. If so, remove the quotation mark characters (“) at the head and tail of the string as shown. Or, you can navigate to some dump file of your choosing. Pick such a file and it will show up in the File name: field.
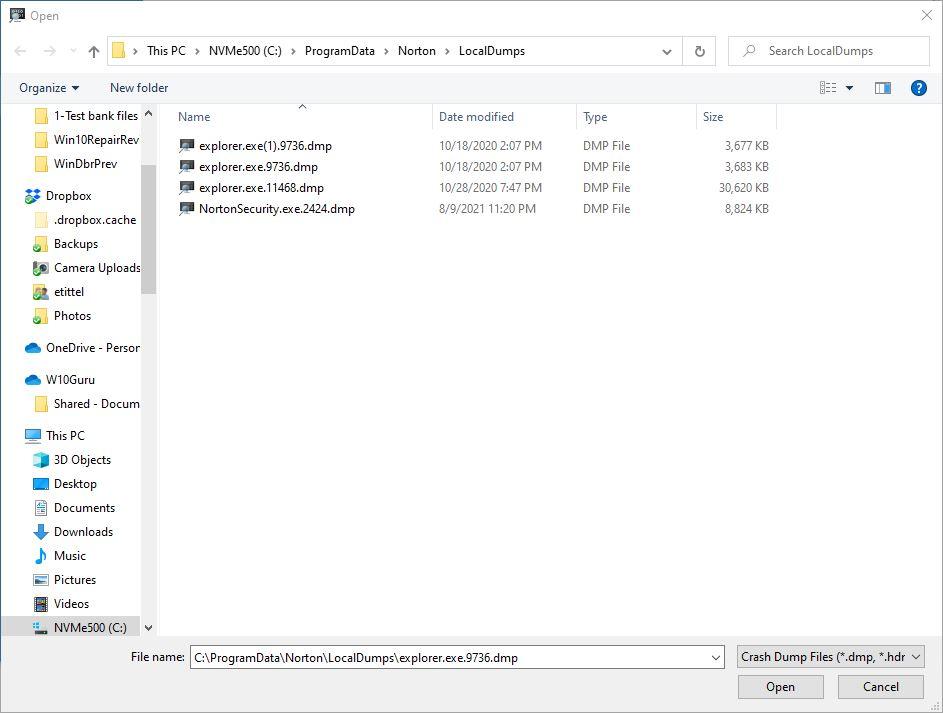
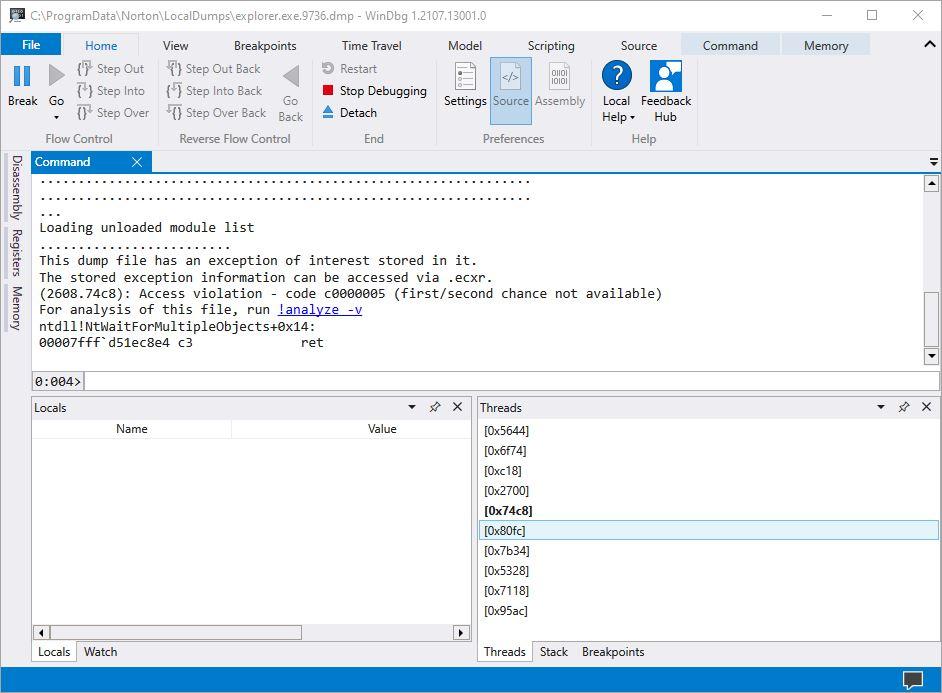
Click the Open button, and WinDbg Preview will load the file and all of the supporting DLL and symbol files it needs to make sense of its contents. This can take a while, along the lines of 1-2 minutes. Next, a display like the one shown below appears. This is where the magic happens, where you must click the link at the center of the middle pane labeled !analyze -v. (Note: I’d used the old WinDbg tool and tried entering the command myself manually, but it didn’t work. The link, however, works fine. Click it!)
The analysis process also takes a while, and will show countless progress bars as the program loads and links to various symbol tables (pdb files), dlls and so forth. Once it’s finished you see text results in the center pane, and a list of related threads in the lower-right pane.
Decoding the Exception Analysis
The text at the head of the center pane has a line in it that reads “This dump file has an exception of interest stored in it.” That’s your clue that analysis might turn up something interesting. Once you click the !analyze v option, the program will conduct an analysis and write its results into that same center pane.
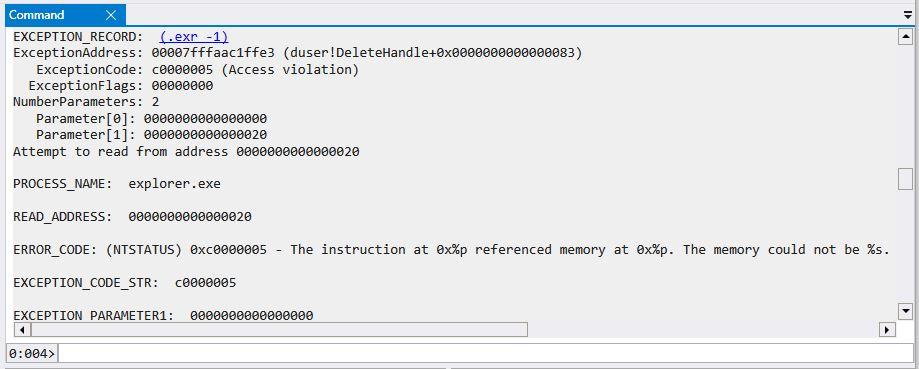
I will now reproduce a key section from that center pane to illustrate what WinDbg Preview found. It occurs in the EXCEPTION RECORD info for the explorer.exe process.
This information tells us that Explorer.exe tried to access an invalid or inaccessible memory location. Thus, we’re looking at some kind of programming or data access error in the application itself. This does not indicate user- or system-caused problems, so all one can do is to accept the error, and hope that MS gets around to fixing whatever caused it.
Note: when you finish using WinDbg Preview, click on File, then Exit. If you don’t exit the program it will make you pick up where you left off the next time you open it. Good housekeeping!
Mozilla/Firefox Crash Report
Next, I loaded up a file from the Firefox “Crash Reports” folder to see what it could tell me. It’s more or less certain to include information about a Firefox problem. This time, the initial inspection reports that “The dump file has a breakpoint exception stored in it.”
The !analyze -v function doesn’t have much interesting to say. Likewise for clicking on the Exception record itself (!.exr -1). Lesson learned here: not all .dmp files have useful things to say to PC users. This one is bound to be sensible only to Firefox developers. I do wonder why, though, a production browser has any working breakpoints left inside.
Partition Wizard DMP File
I found a mystery .dmp file at the root level of my C: drive, named pw10-debug.dmp. As soon as I opened it up and ran the analysis I saw partitionwizard.exe appear as the faulting process. It shows a memory access error almost identical to the one from explorer.exe earlier on. Very helpful in showing me that this is old news, and something I don’t need to keep around any longer.
Do Your Own Explorations
Once you get WinDbg Preview running on your PC you can point it at any .dmp files you might find. It should at least let you figure out where a .dmp file came from, and whether or not there’s any cause for concern. WinDbg Preview just got promoted to the top of my list of error analysis tools. Count on me to start including information gleaned using the tool in my upcoming and ongoing series of BSOD stories. Stay tuned!
Ed Tittel is a long-time IT writer, researcher and consultant, and occasional contributor to Tom’s Hardware. A Windows Insider MVP since 2018, he likes to cover OS-related driver, troubleshooting, and security topics.
