The distribution of contrast on the W251U's display is very even. Mean contrast is 179 candelas/square meter, while the contrast range is a wonderfully small 160 to 189 candelas/square meter (range 29). You can't see any of the yellow color shown in the l
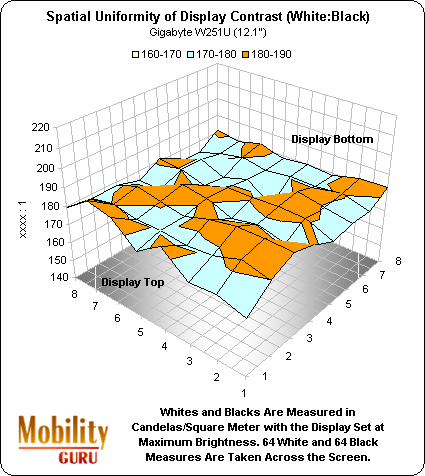
The distribution of contrast on the W251U’s display is very even. Mean contrast is 179 candelas/square meter, while the contrast range is a wonderfully small 160 to 189 candelas/square meter (range 29). You can’t see any of the yellow color shown in the l
The mean contrast on the W551N's display approaches very good at 191 candelas/square meter. Minimum contrast is 182 candelas/square meter, while maximum contrast is 209 candelas/square meter. The contrast range is a bit lower than the W251N's already exce
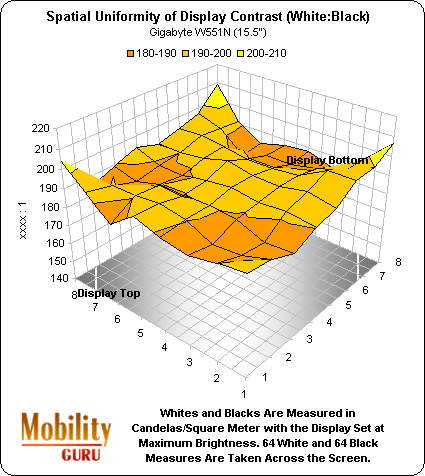
The mean contrast on the W551N’s display approaches very good at 191 candelas/square meter. Minimum contrast is 182 candelas/square meter, while maximum contrast is 209 candelas/square meter. The contrast range is a bit lower than the W251N’s already exce
TOPICS