6-Way 2-Bay NAS Round Up
We test the hottest new 2-Bay NAS to compare features and performance. These entry-level products allow you to access your data from around the world and secure your data with redundant disks.
SMB Performance Testing
Why you can trust Tom's Hardware
Testing Notes
All six of the systems work with traditional SMB/CIFS file transfers. SMB is the easiest NAS protocol because it simplifies file access to where you can simply type in "\\name_of_nas\folder_name" in file explorer to access the data on the system. We test and highlight the performance of SMB encrypted folders and iSCSI volumes on applicable models, but not all of the systems support the features.
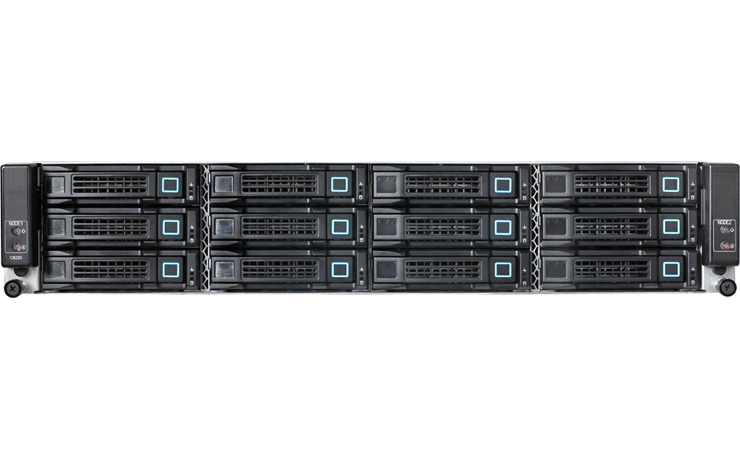
Our test system is a modified Quanta MESOS CB220 Cluster-In-A-Box multi-node server. We upgraded the system with two Intel E5-2670 V1 processors and 128GB of system memory per node. An Intel X520 network interface card with two 10GbE ports resides in each node, as well. The system allows us to deploy four test nodes that execute custom software scripts in industry standard test software to measure our base performance metrics.
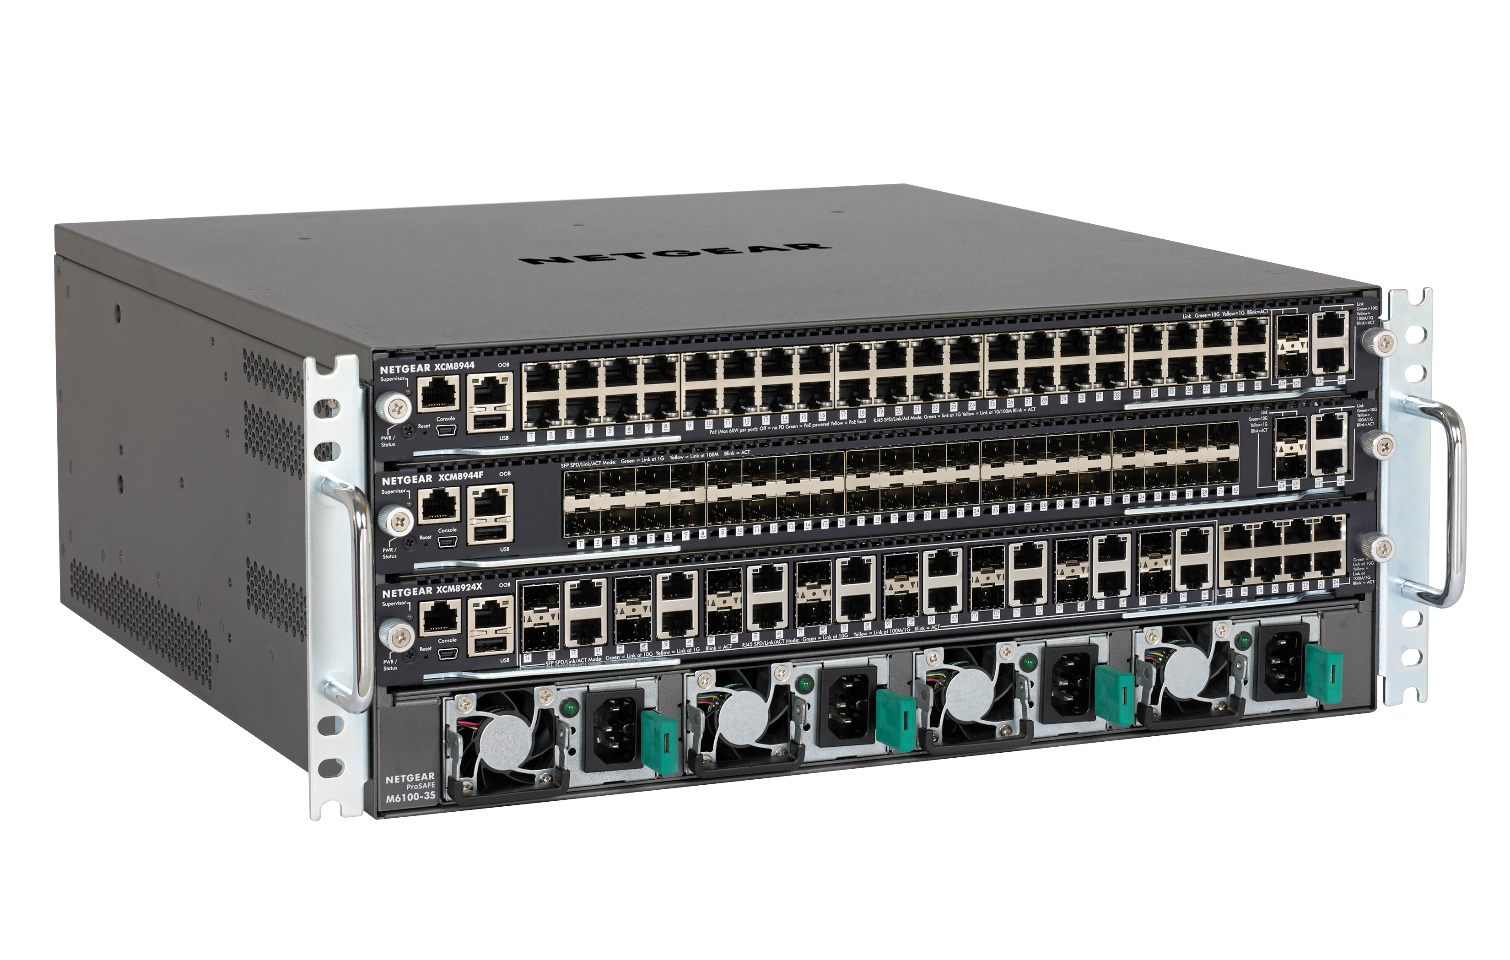
The test system and devices under test connect via a Netgear M6100 fully-modular switch, which provides ample 10GbE and 1GbE ports to sustain our large testing environment. This round of NAS testing is the second time we've used this switch. We discovered an issue with our previous switch and some NAS products that significantly reduced file transfer performance. The Netgear M6100 doesn't give us the same performance issues, and it allows us to expand our test environment while still running a dedicated network.
Sequential Read Performance
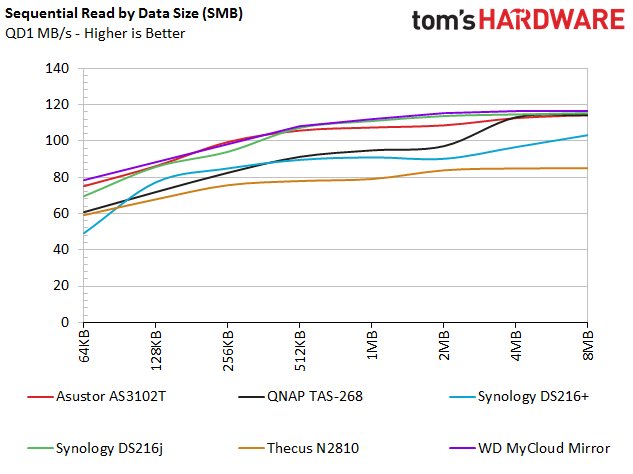
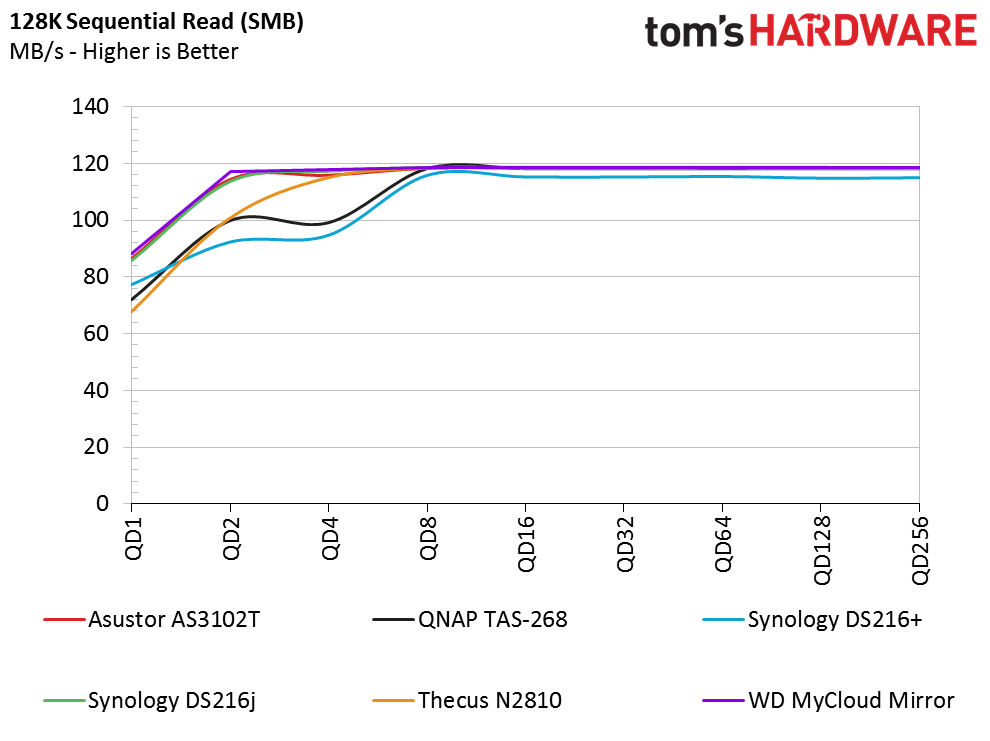
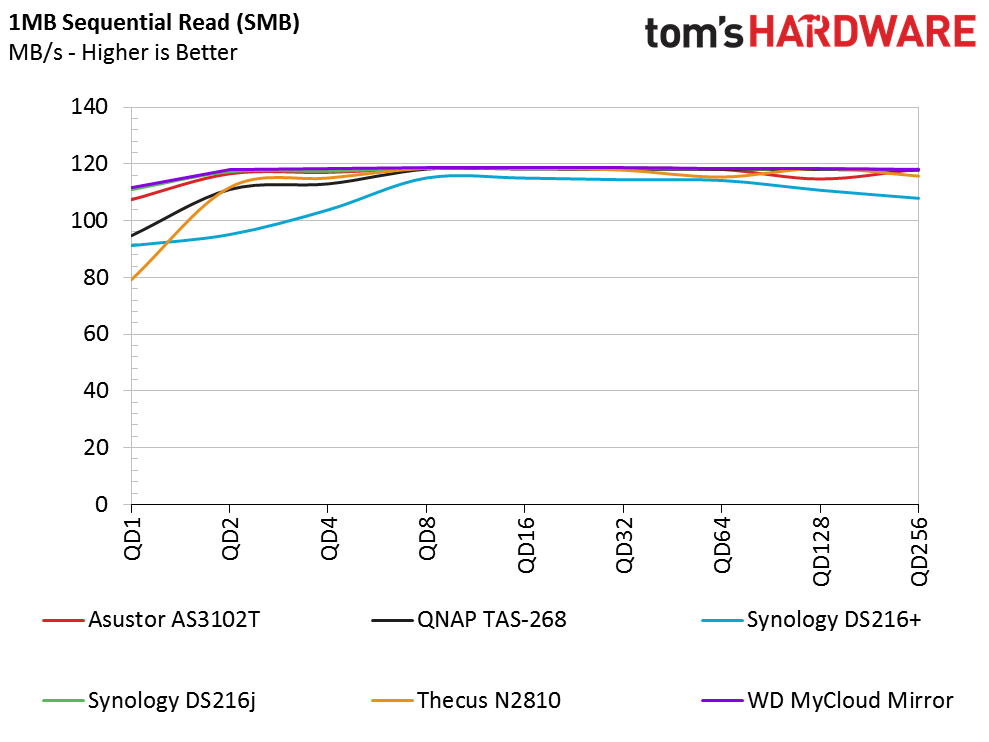
The sequential read tests reveal two distinct performance tiers. You would expect this segmentation with the different processors in these systems, but the dividing line is not that clear.
For this class of product, we are looking for high performance at low queue depths. Most users will use these systems for file transfers in single-user environments, so most of the transfers will take place one at a time (sequentially). Typically, when you copy and paste files from your desktop into a NAS folder, it occurs at a queue depth of one. The queue depth increases to 2 if you start two separate transfers simultaneously, and so on.
We expected the Intel-based systems to dominate nearly all of the tests, but that isn't the case. The Asustor AS3102T, Synology DS216j, and Western Digital My Cloud Mirror provide the best performance at low queue depths with 128BK data blocks. Of the three, only the AS3102T uses an Intel processor.
This behavior highlights that firmware and software play just as large of a role in performance as the hardware does, particularly during light workloads.
Sequential Write Performance
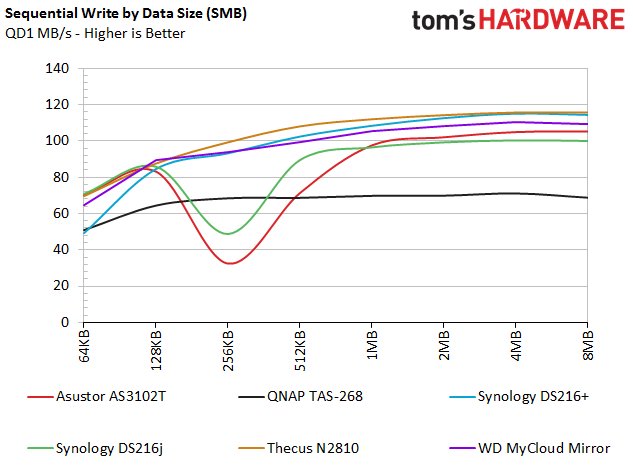
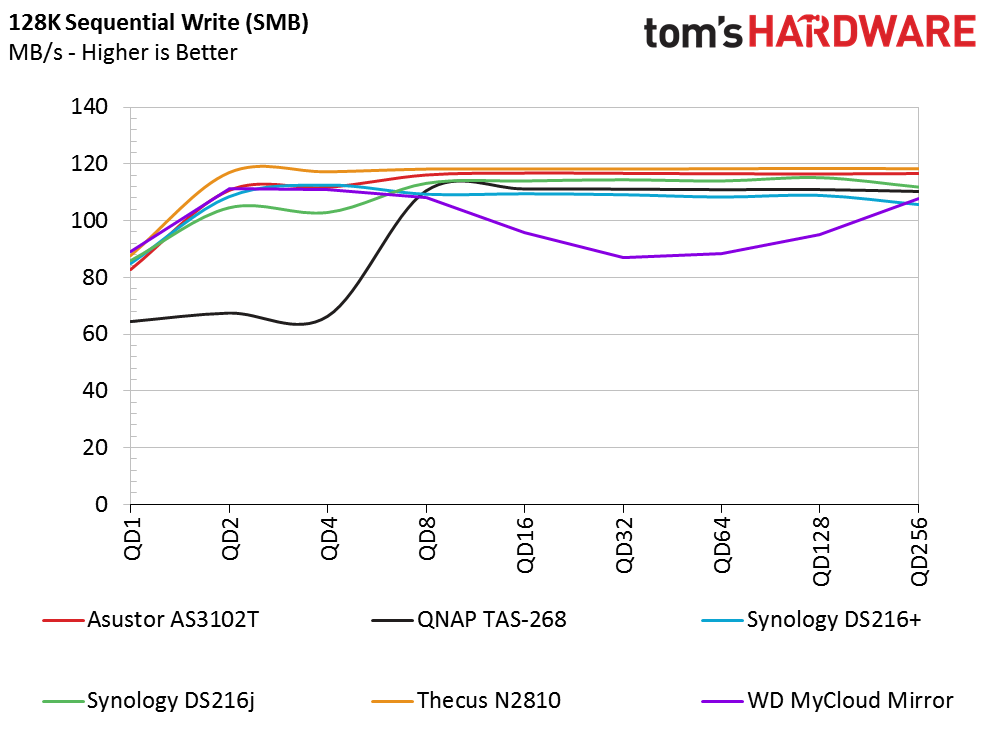
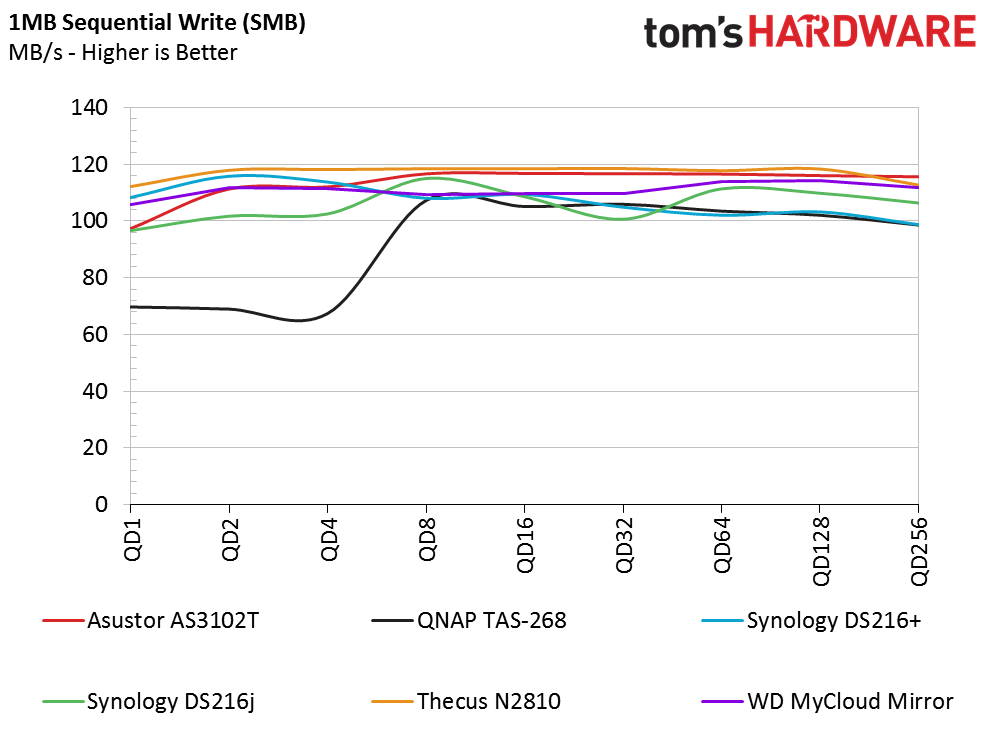
The manufacturers release new firmware at a fairly consistent rate to update the products, increase performance, add features, and smooth performance inconsistencies. Many of the systems use DRAM as a cache buffer, which helps to smooth performance, because hard disk drives, by nature, are inconsistent.
The sequential write tests expose some performance abnormalities. All of the products, except the QNAP TAS-268, provide similar performance while writing 128KB sequential data. At higher queue depths, the TAS-268 matches the performance of the other products, but it lags behind the other NAS during light workloads.
Sequential Mixed Workload Performance
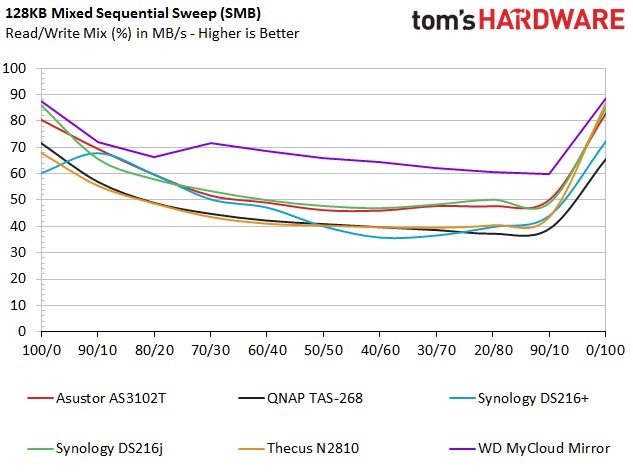
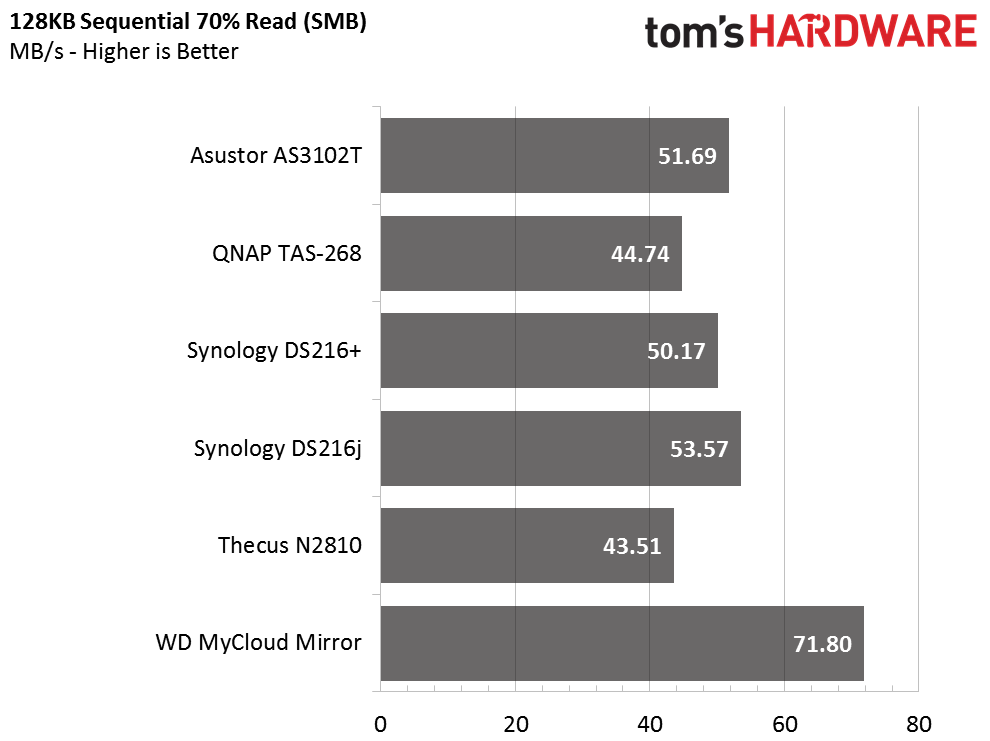
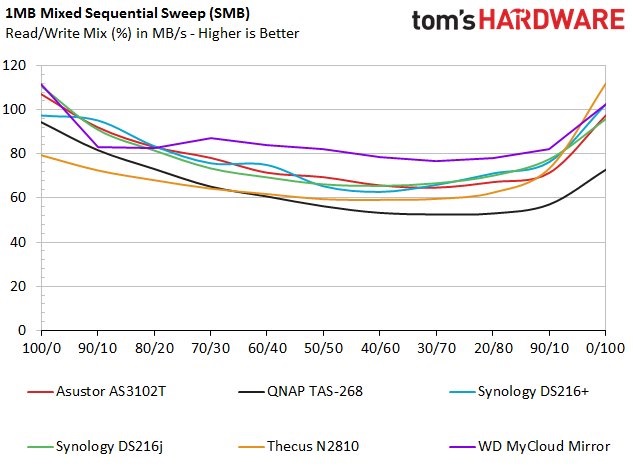
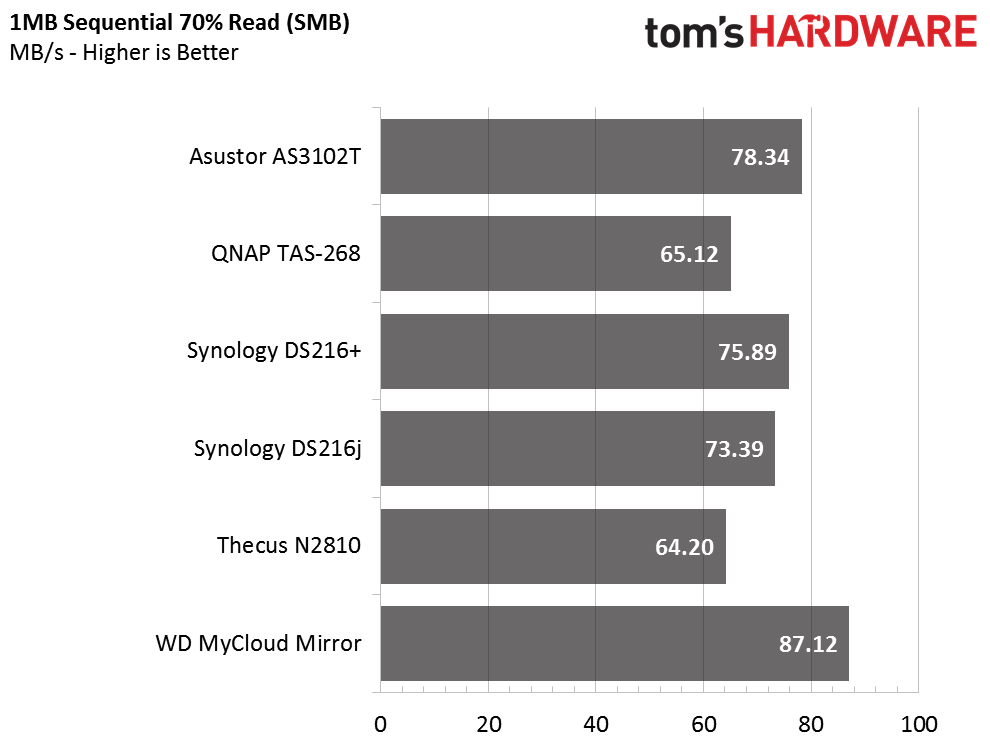
The sequential sweeps test cycles through mixed workloads in 10-percent increments. We begin with 100-percent reads (on the right of the chart) and add more right data until we reach the left side of the chart with 100-percent writes. We highlight the 70-percent read test with additional charts because this is the standard mixture for measuring workstation storage performance.
The Western Digital My Cloud Mirror performs very well in these tests while the other products follow the traditional "bathtub curve."
Random Read Performance
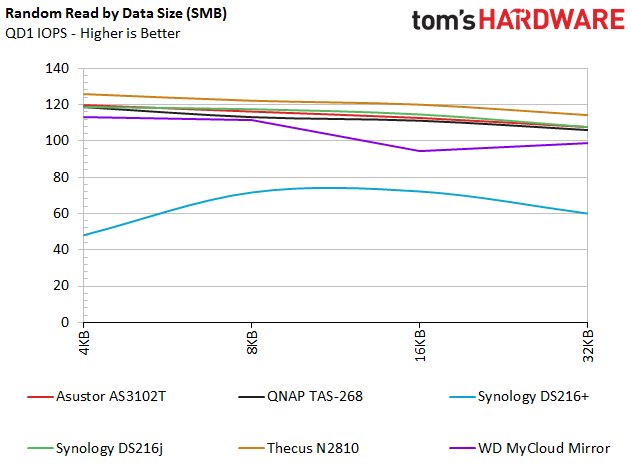
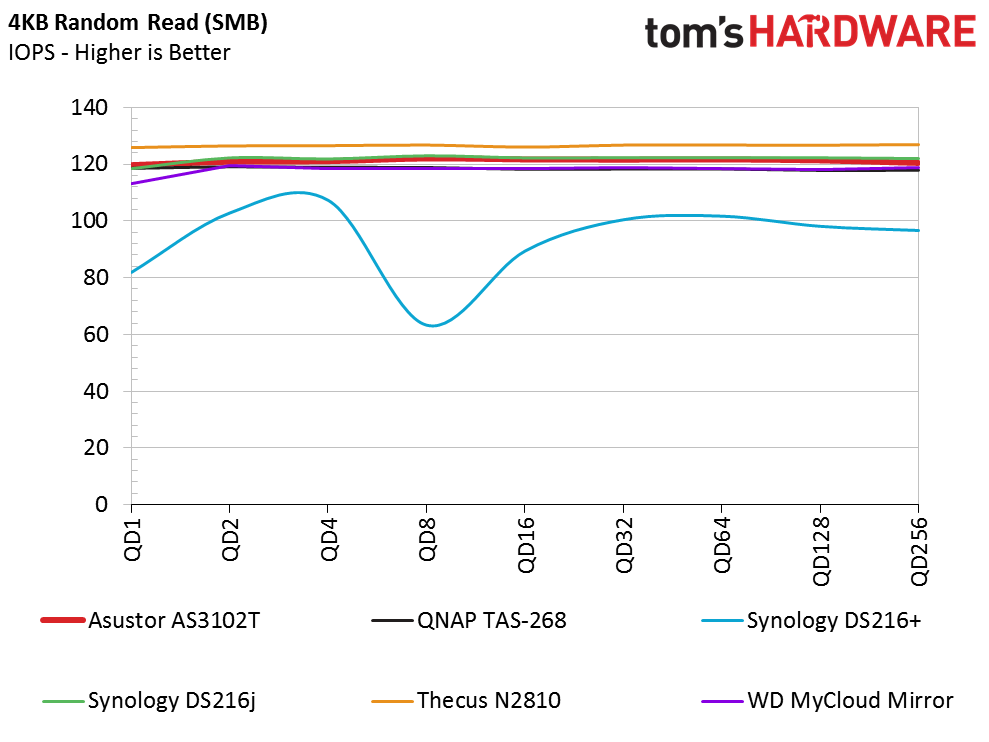
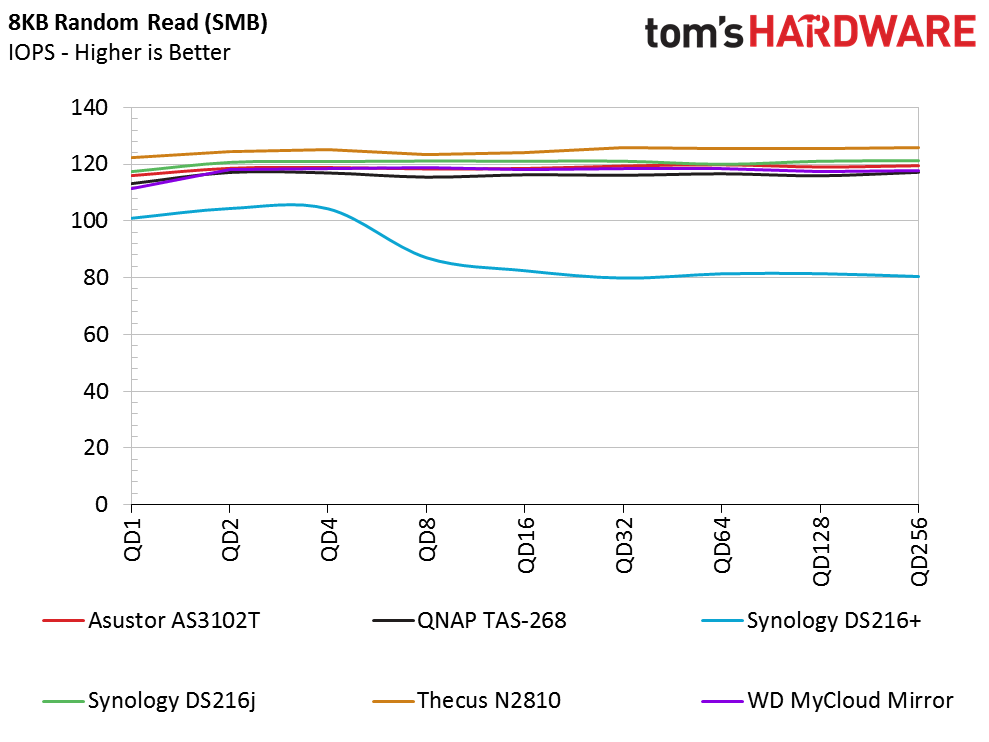
The Thecus N2810 performs slightly better with random read data across the range of queue depths. The Synology DS216+ trails the other products in these SMB tests. We spent a considerable amount of time retesting the DS216+ in an attempt to smooth out the issue. Each system requires eight days to complete the full test suite, and we retested the DS216+ with four different software releases, but could not isolate the issue.
The other NAS appliances converge together and provide nearly identical random read performance.
Random Write Performance
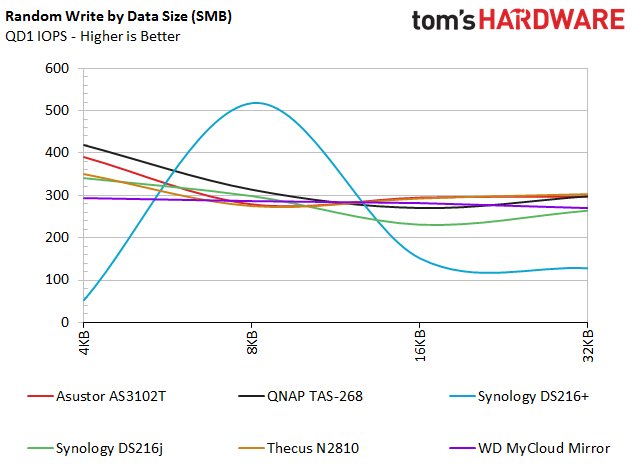
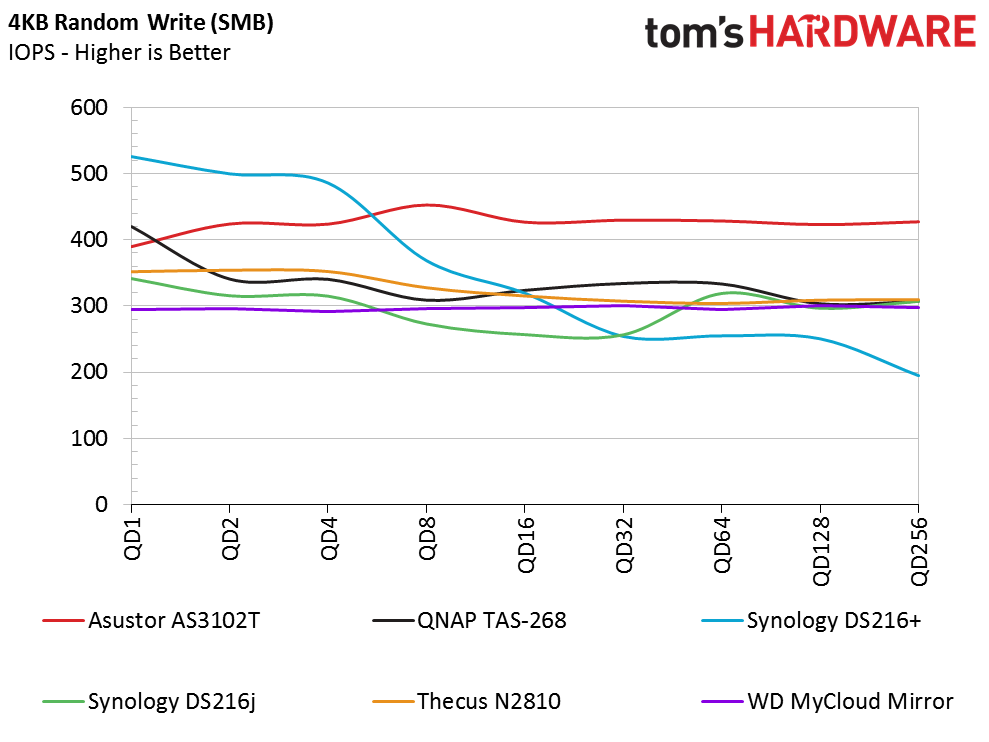
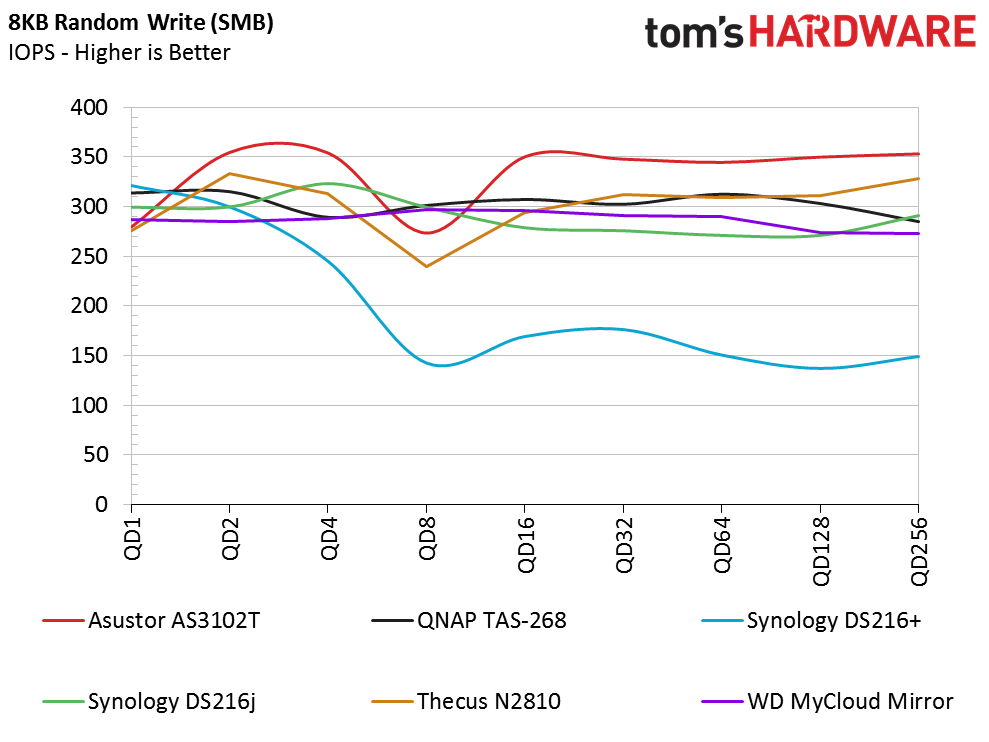
The random write test spreads the test pool out and gives us more separation. Most of the products are very consistent and waver only slightly as the queue depth increases, but the Synology DS216+ is, for lack of a better term, all over the place. This pattern reveals high performance as the cache algorithm buffers the incoming data and then low performance as the NAS flushes the buffer to the drives.
Random Mixed Performance
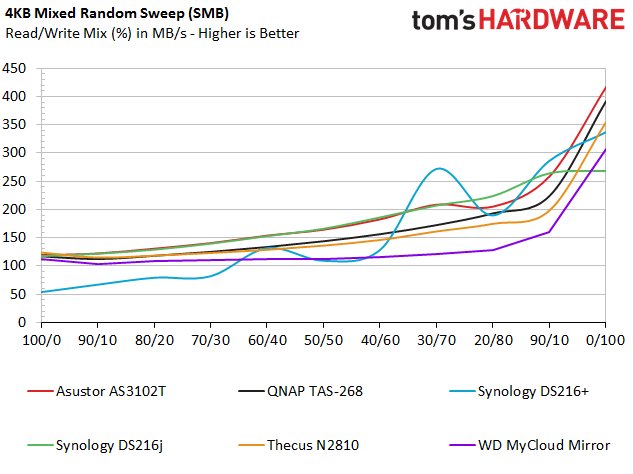
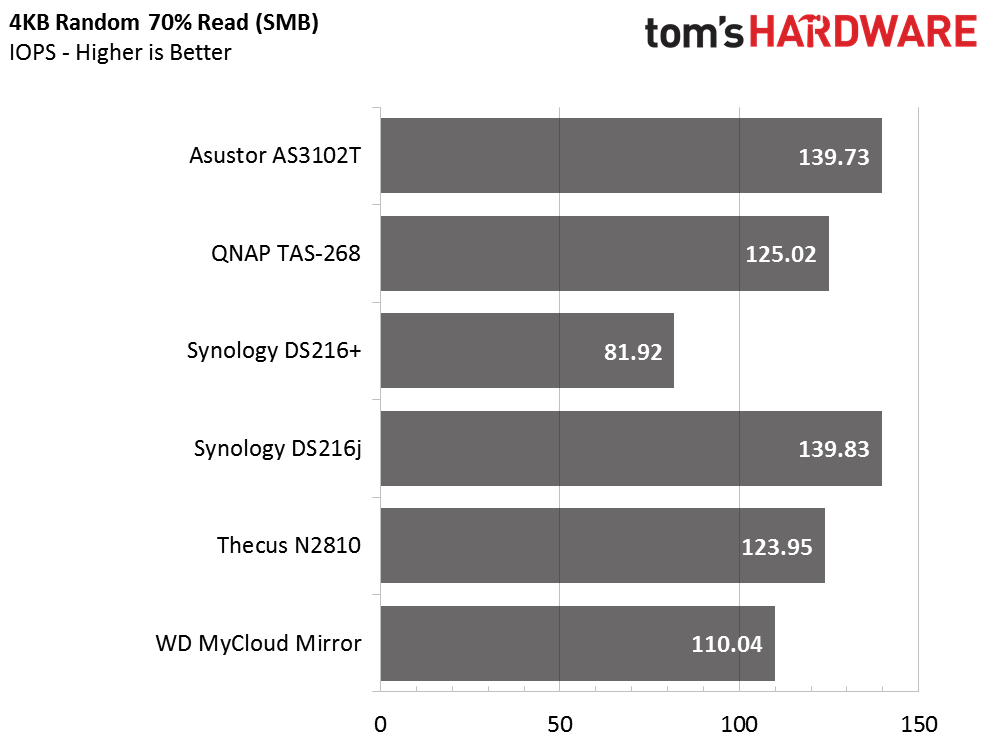
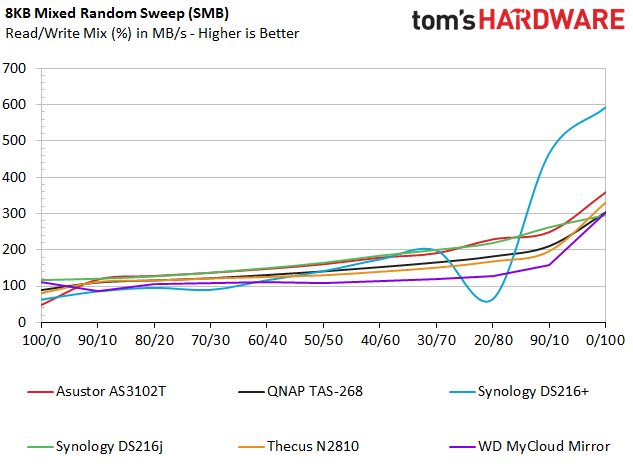
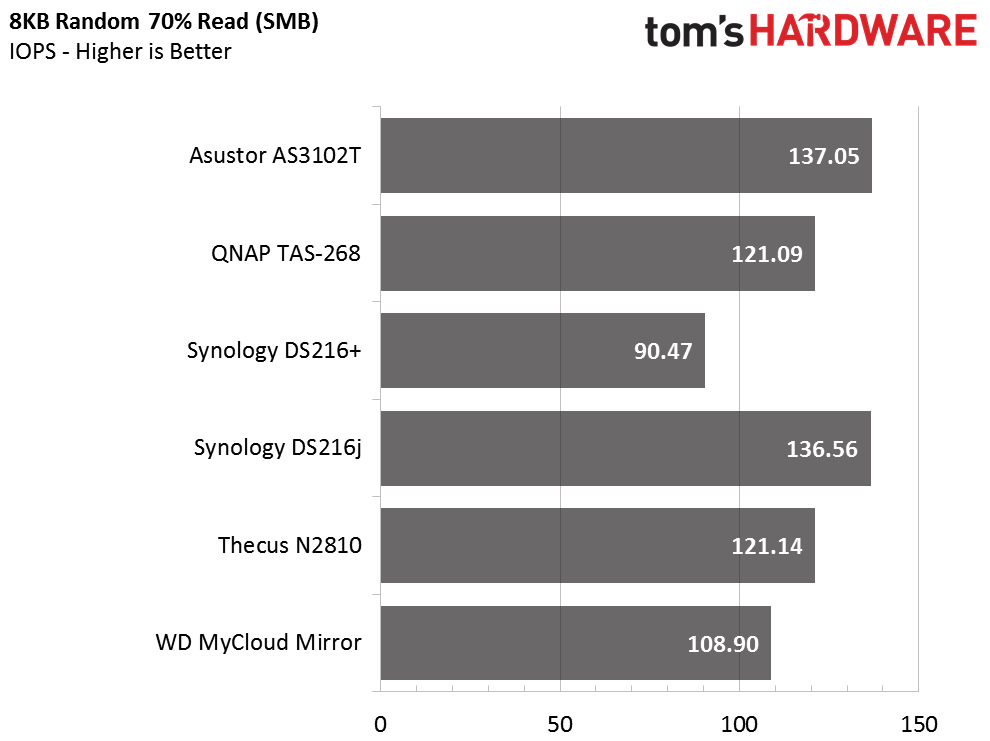
The mixed random test shows how the cache allows the systems to absorb the incoming data at a higher rate than they can read it back to the host system. Again, we highlight the 70-percent read workload with additional charts to characterize workstation performance. 4KB transactions simulate running Windows-based software over the network, and 8KB data highlights VMware performance trends.
Standard Server Workloads
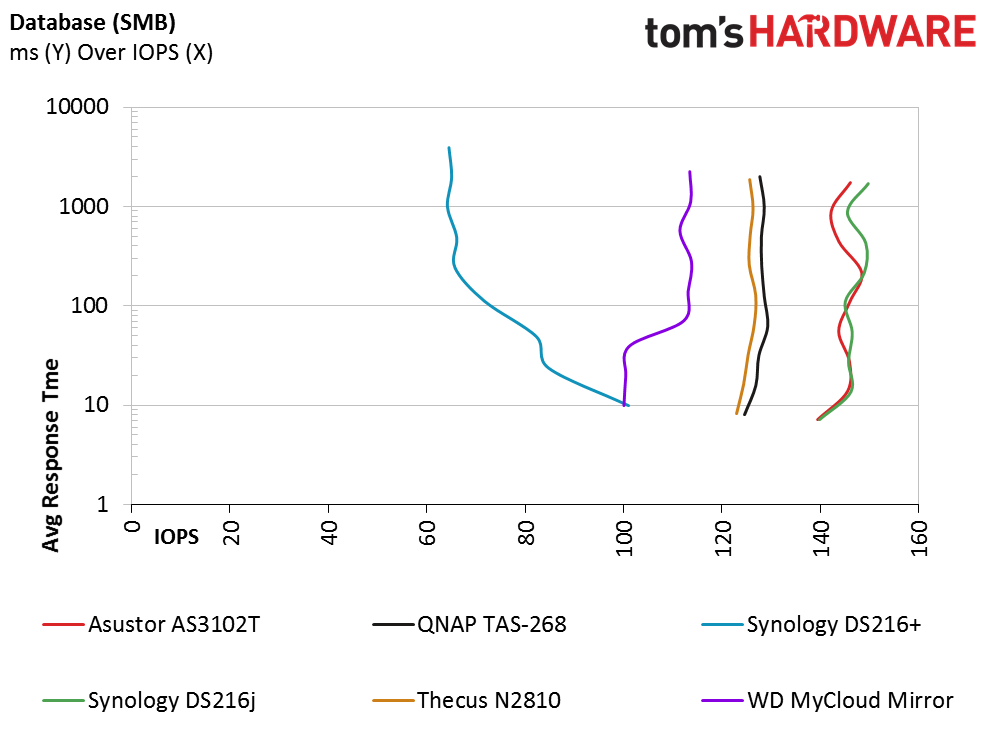
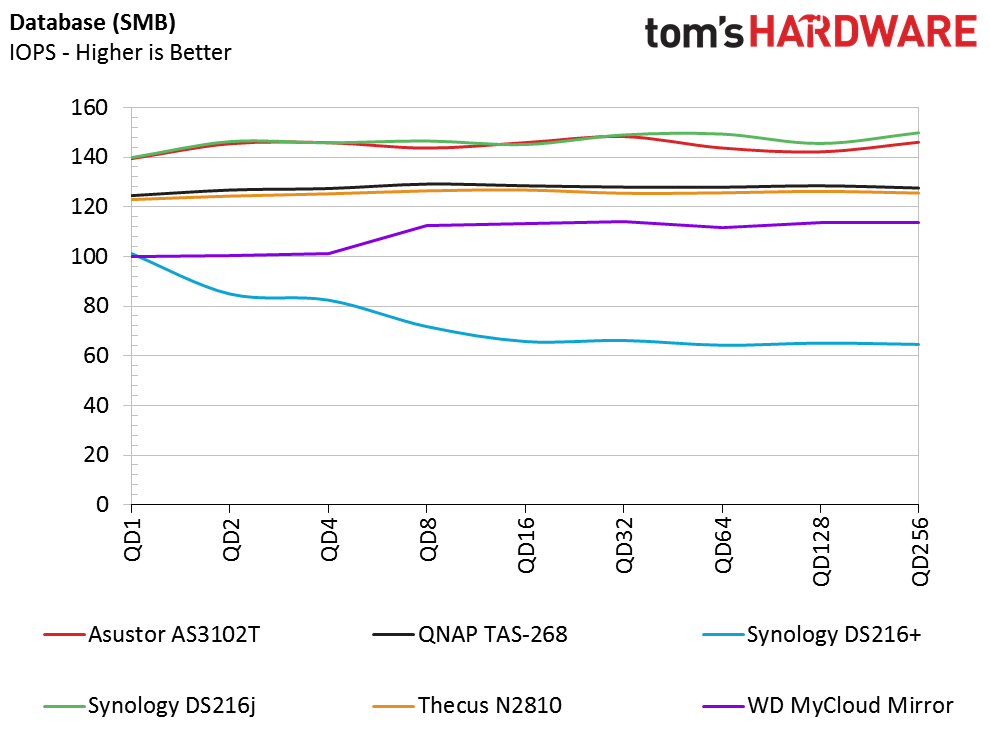
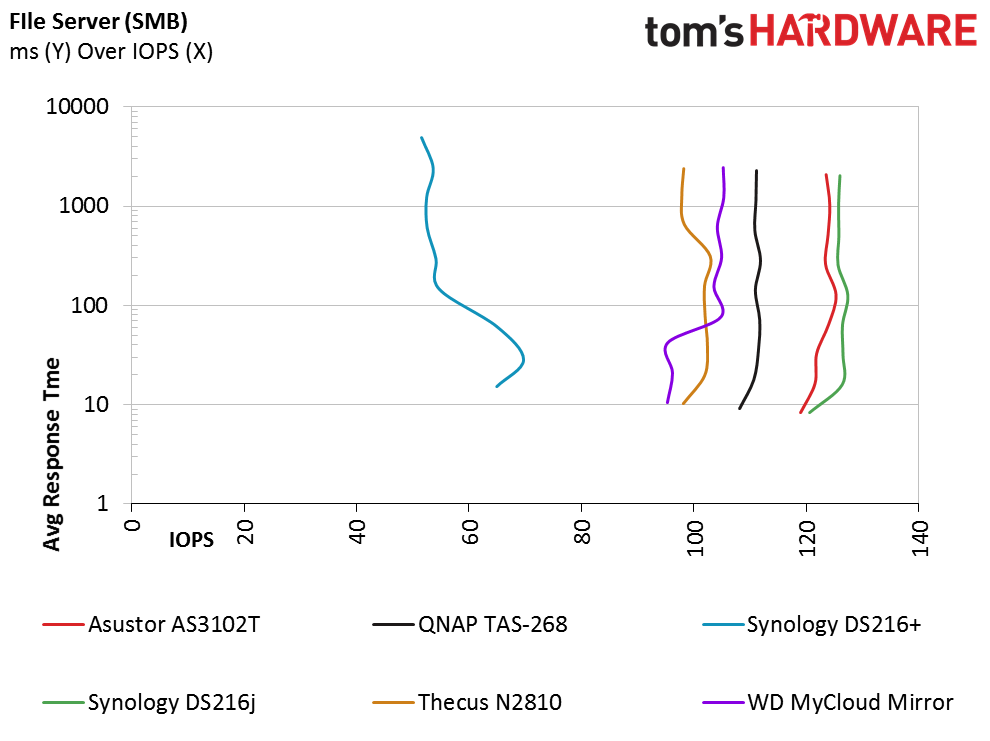
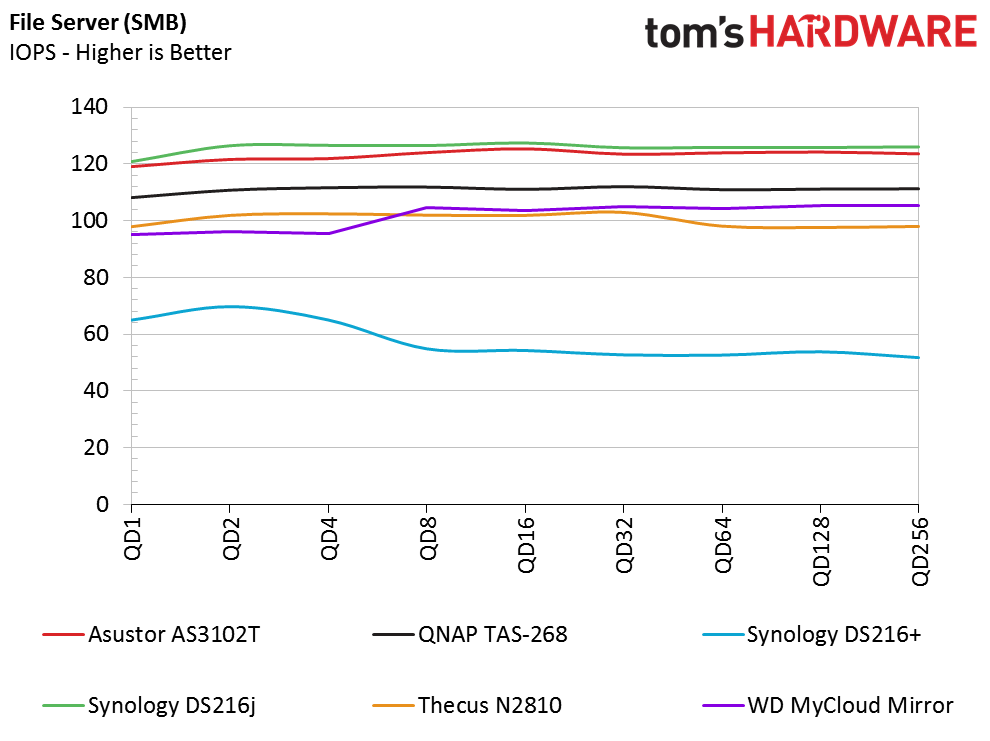
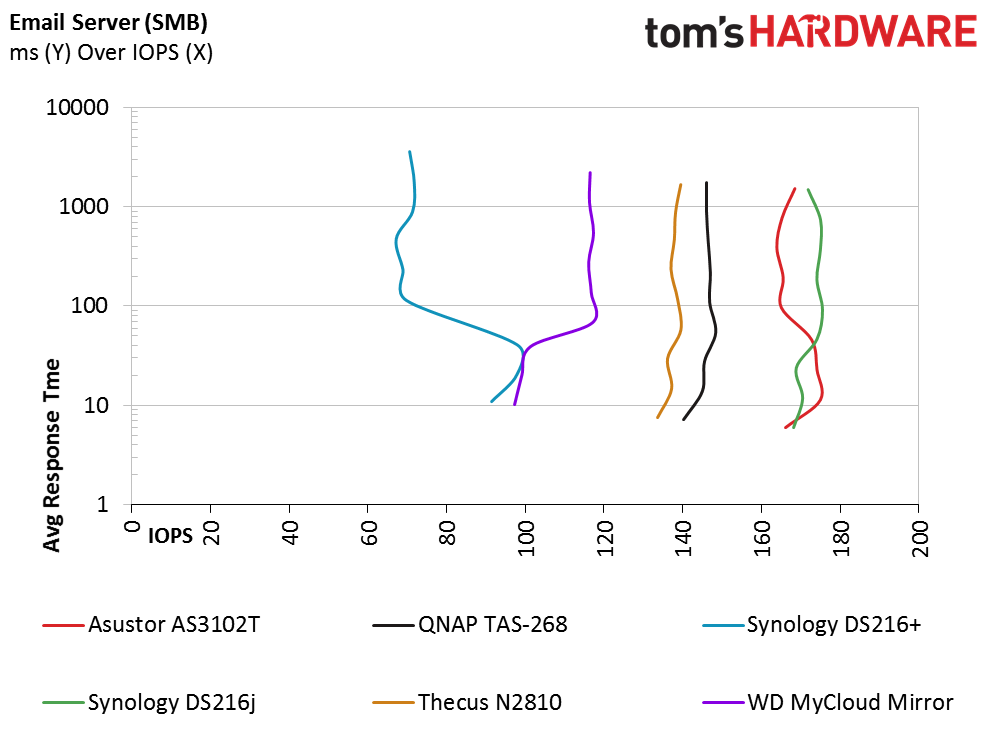
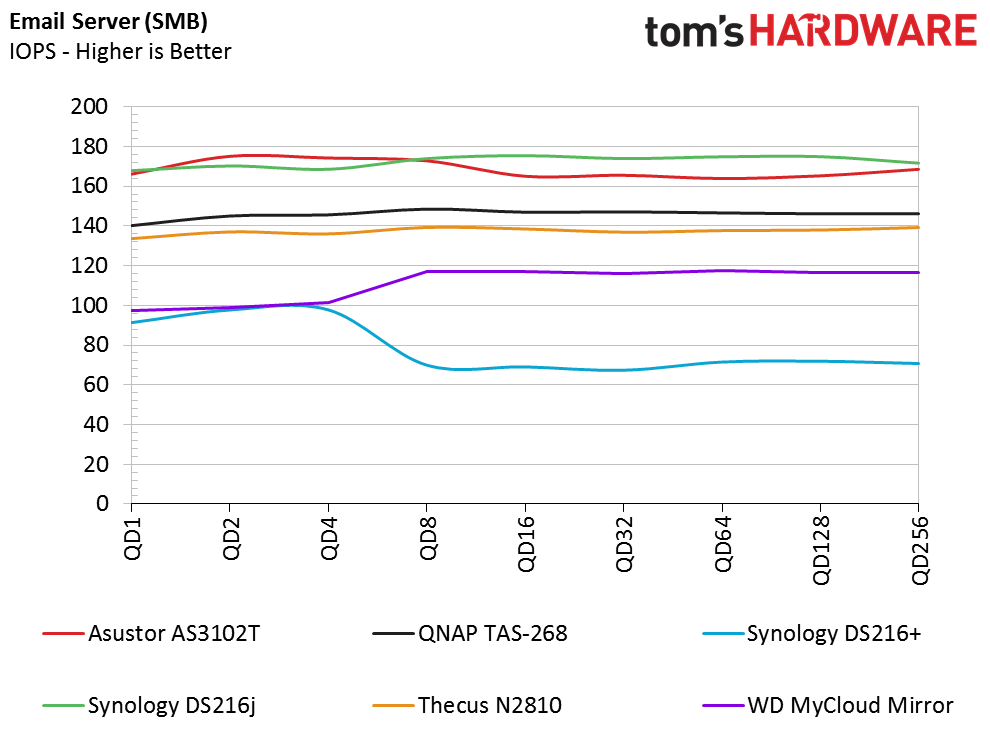
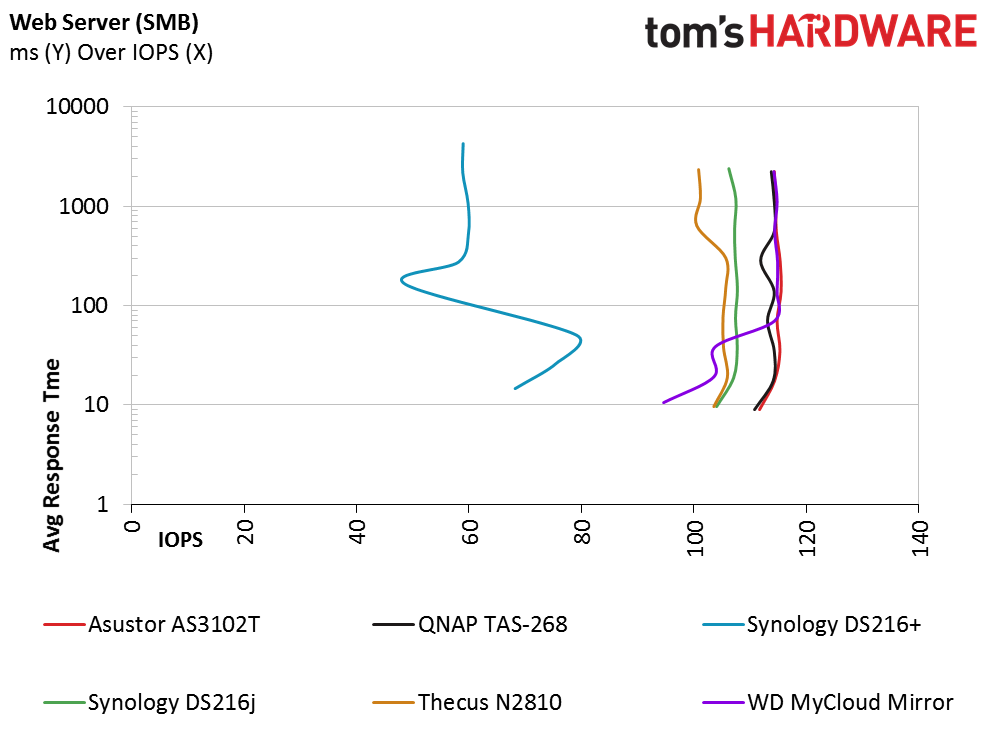
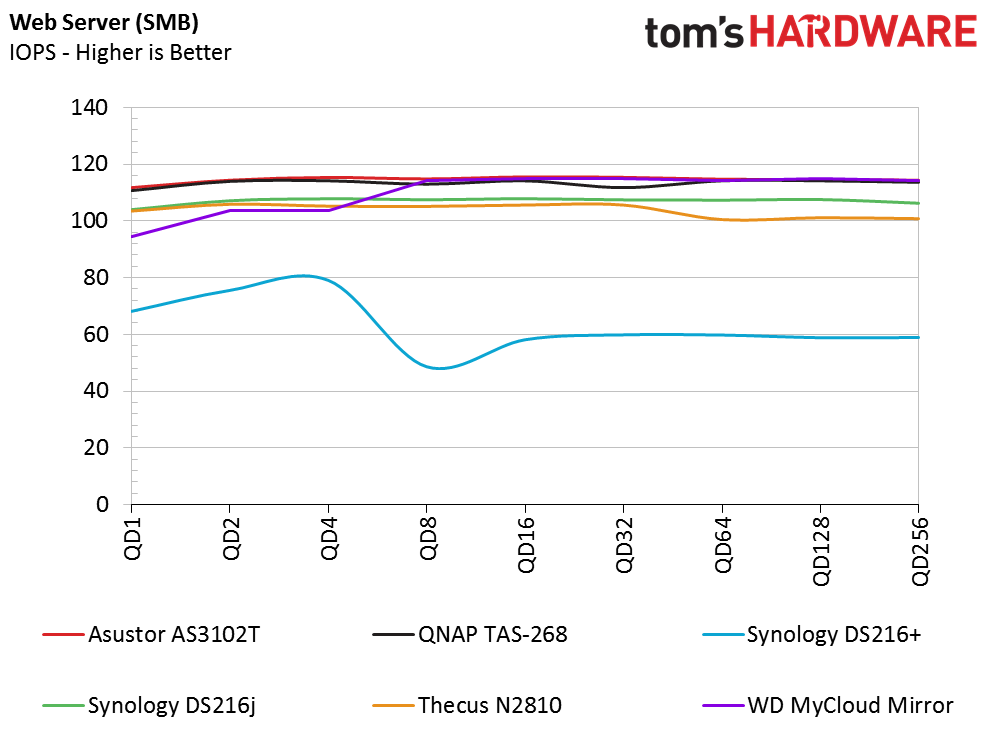
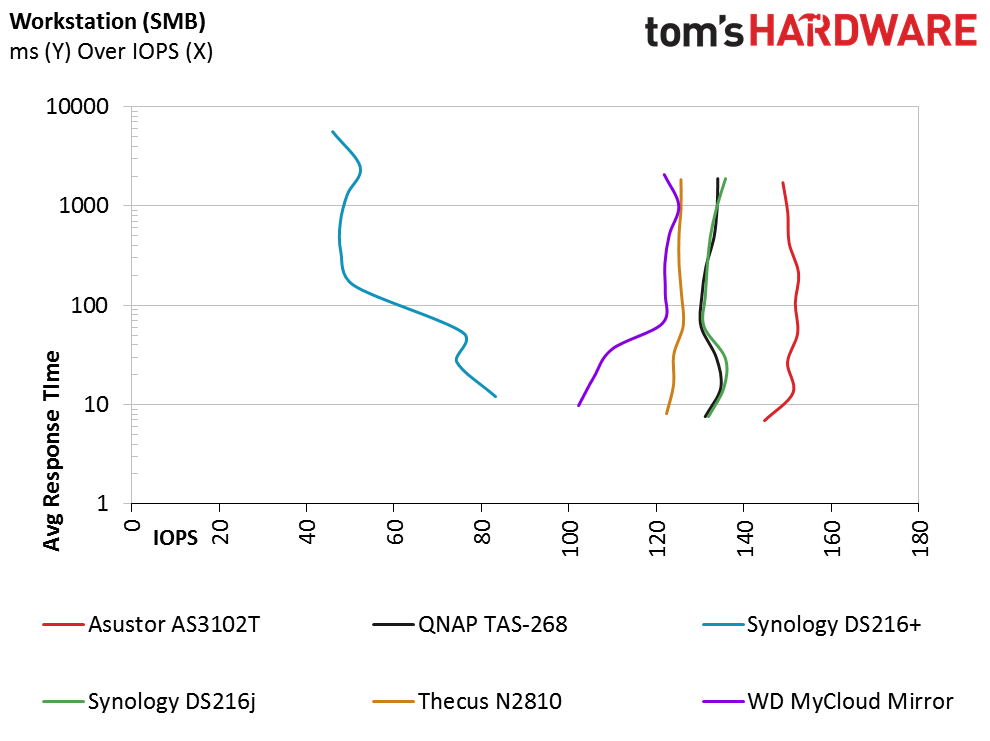
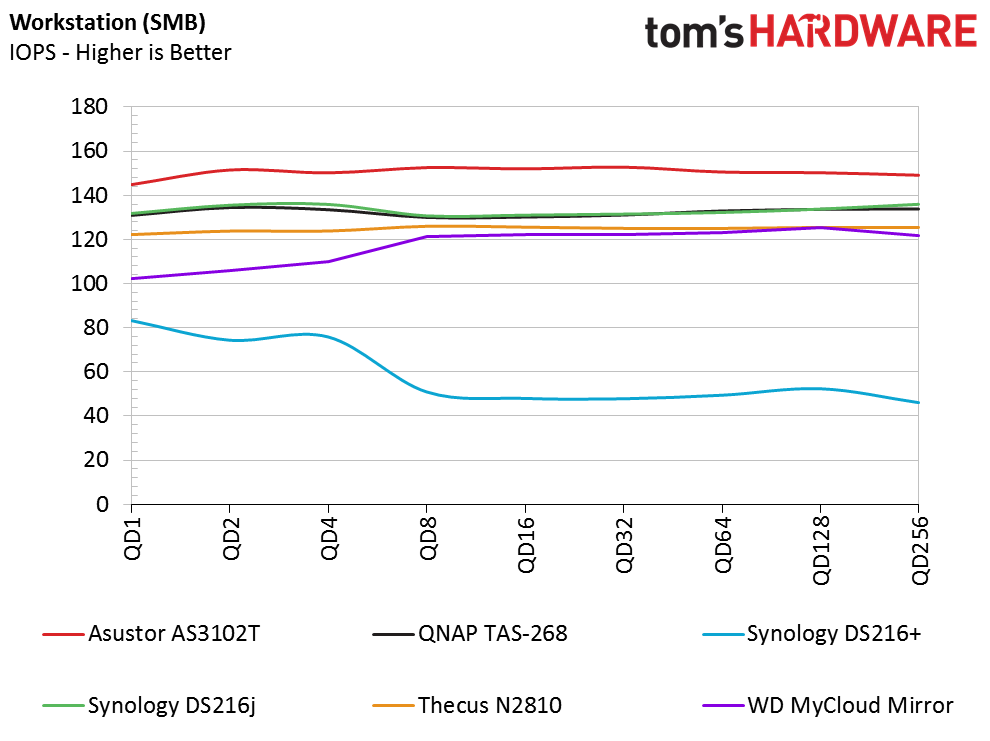
Very few users, in any, will run a heavy-use email or database server on these entry-level systems, but we like to see the tests to examine the mixed-workload performance in the latency over IOPS charts.
Consumer NAS Workloads
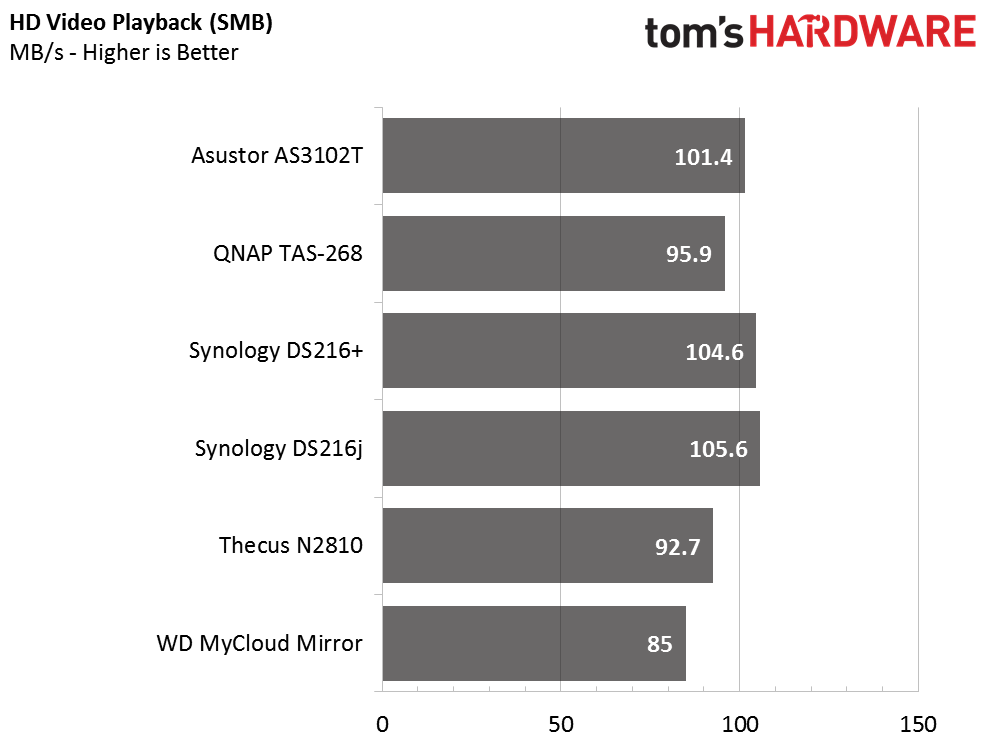
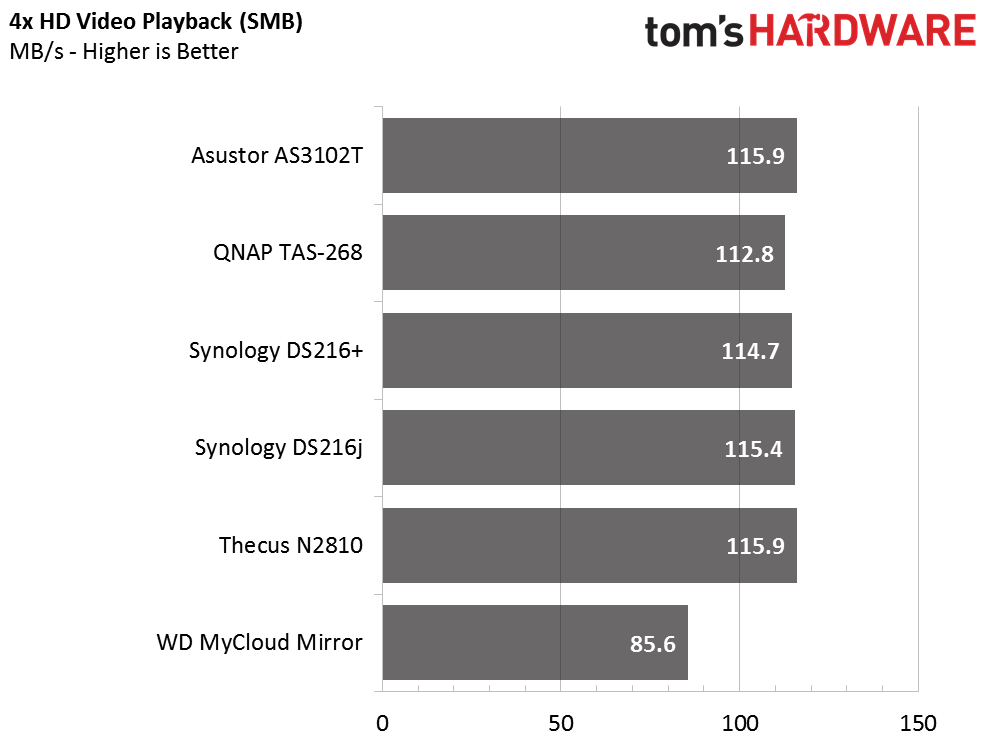
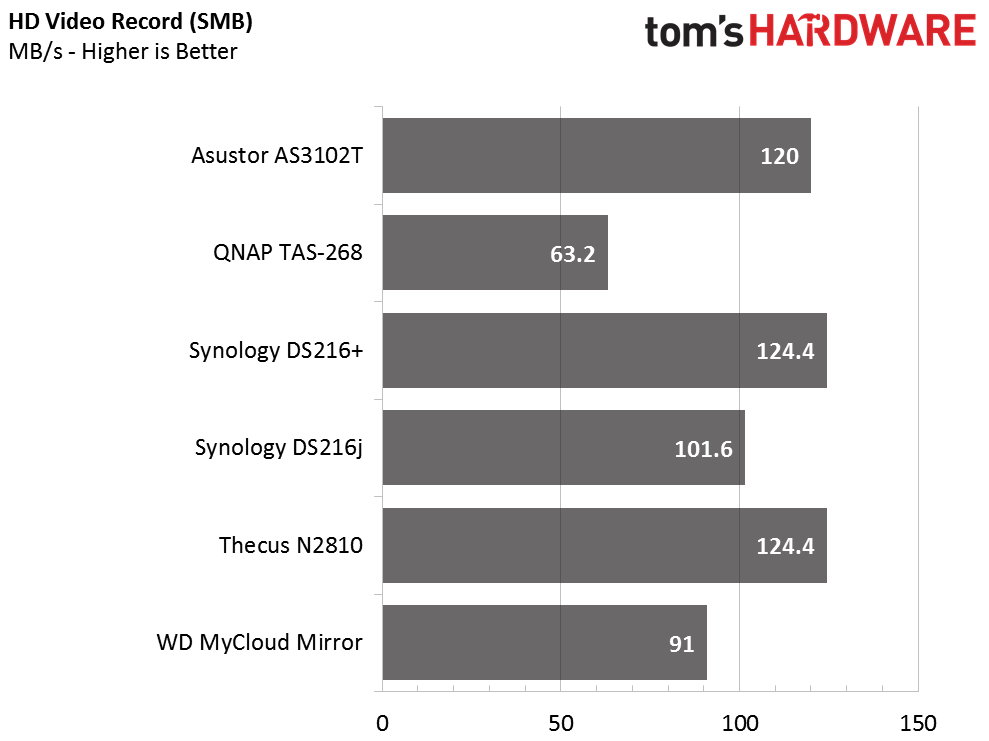
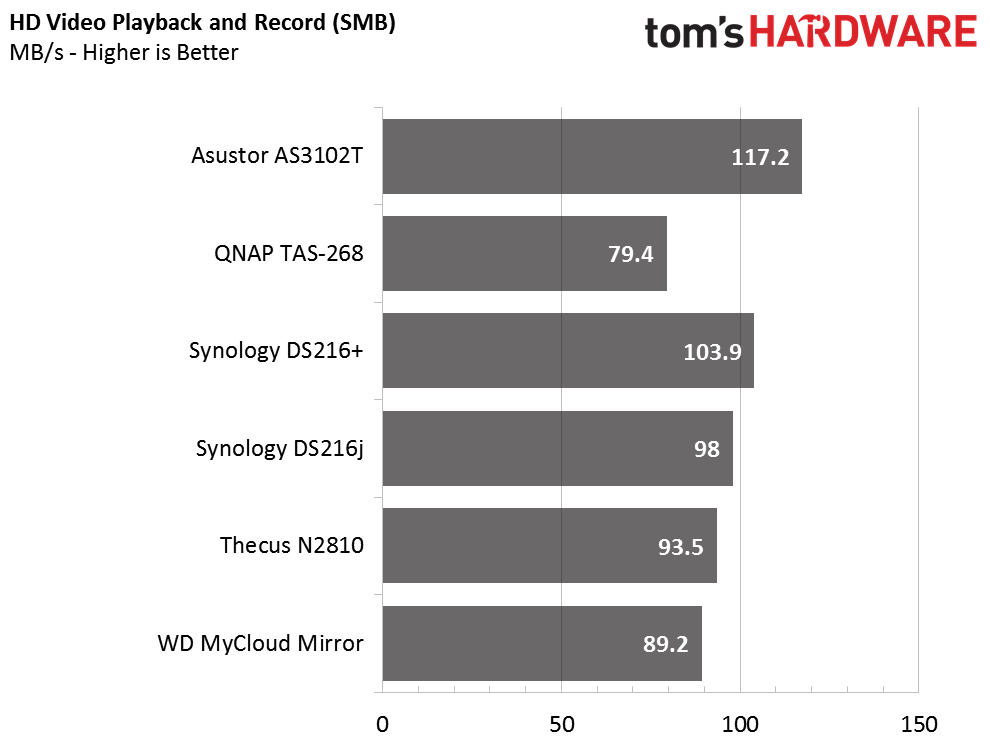
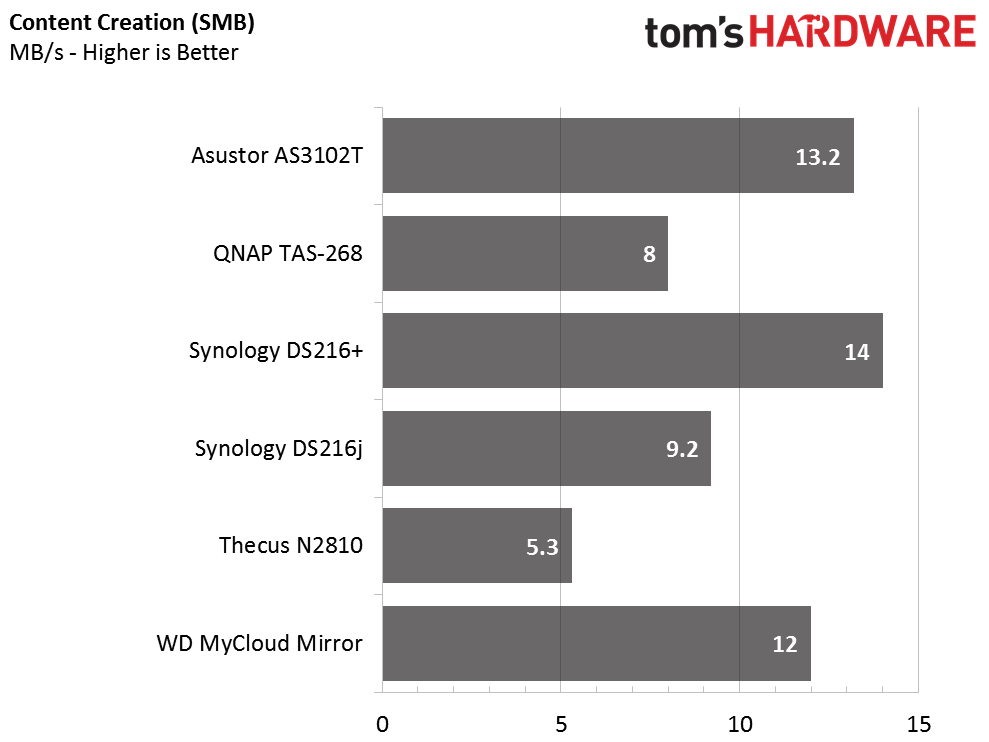
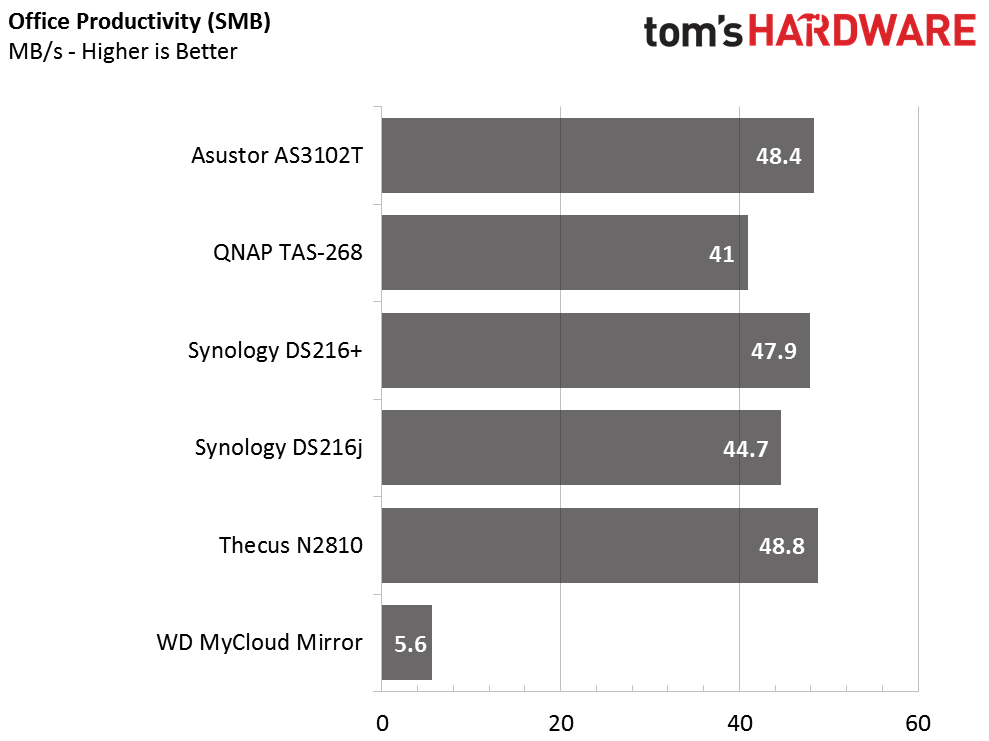
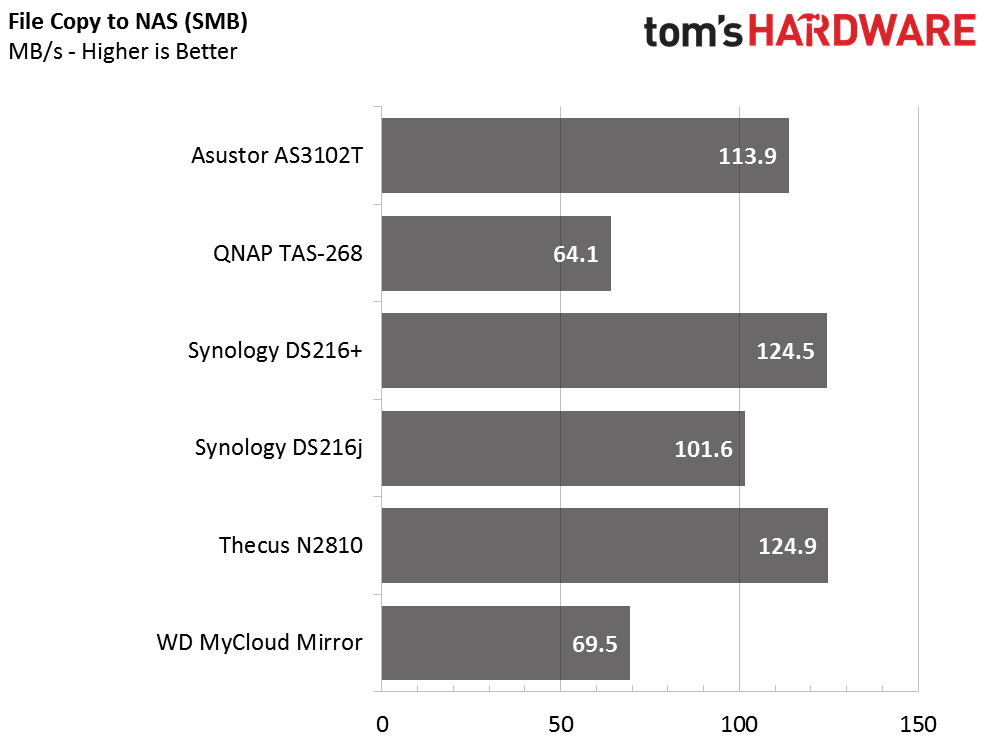
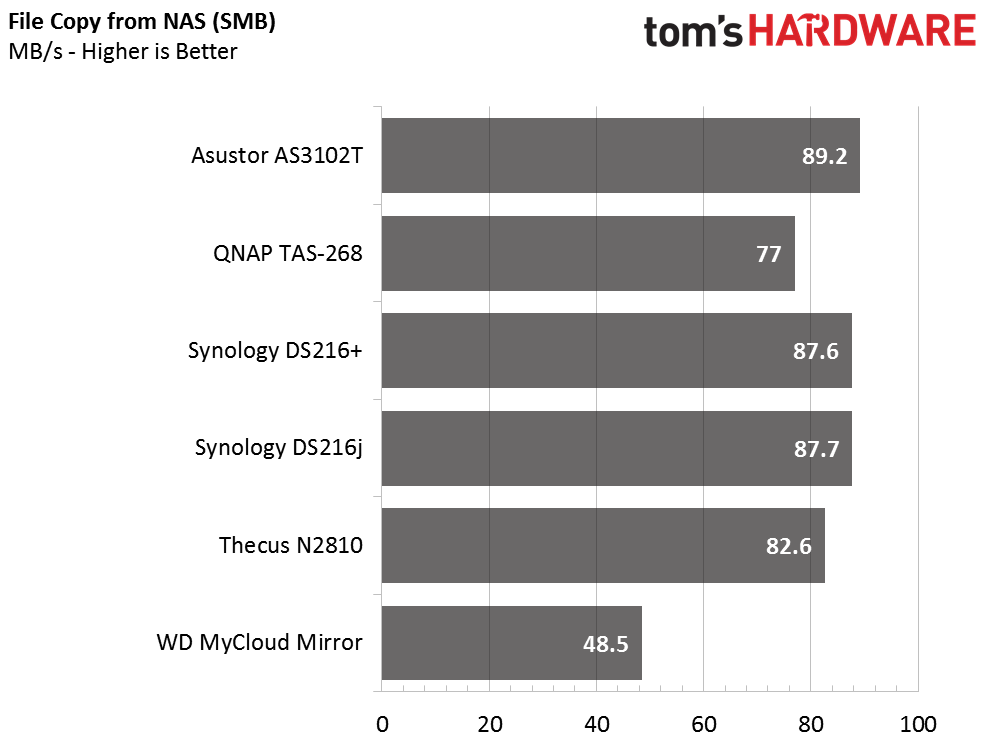
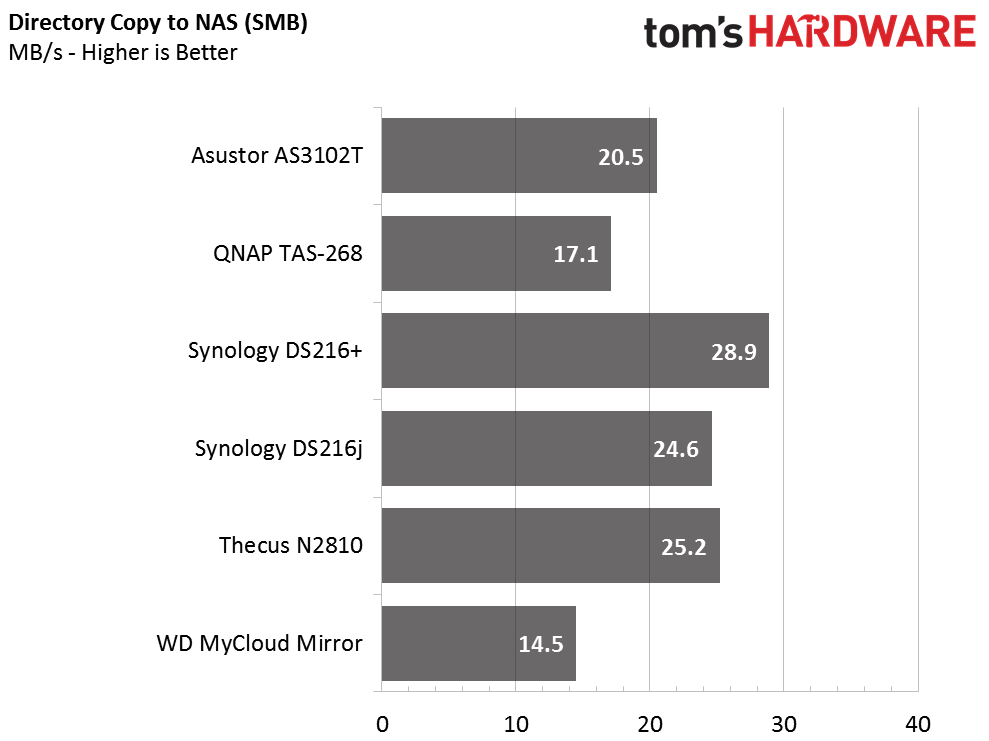
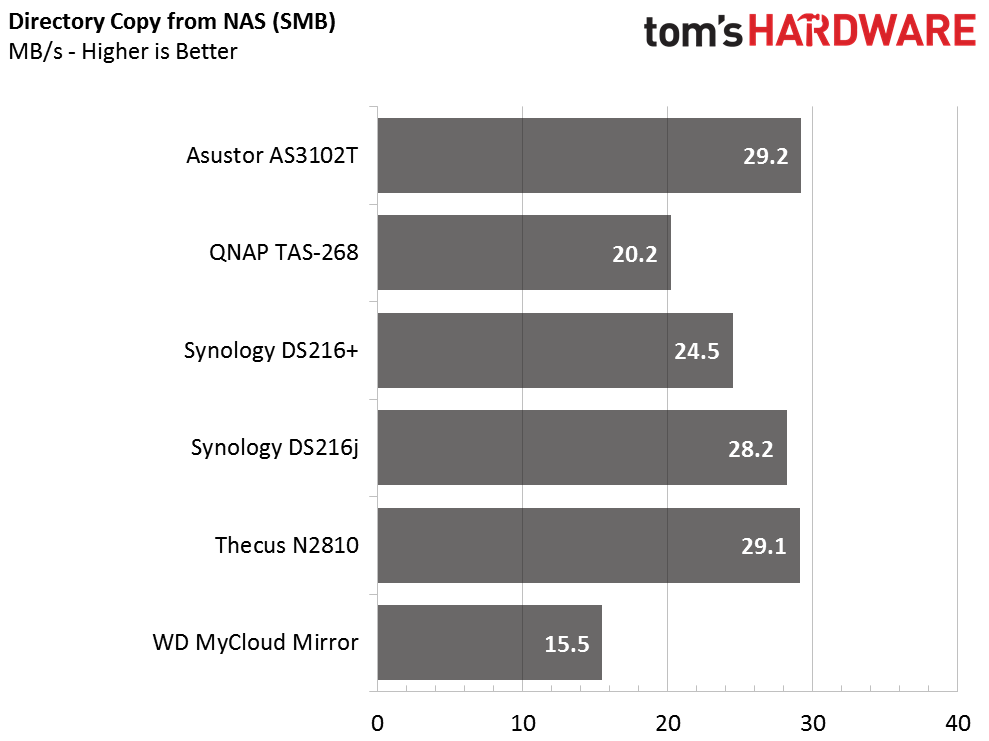
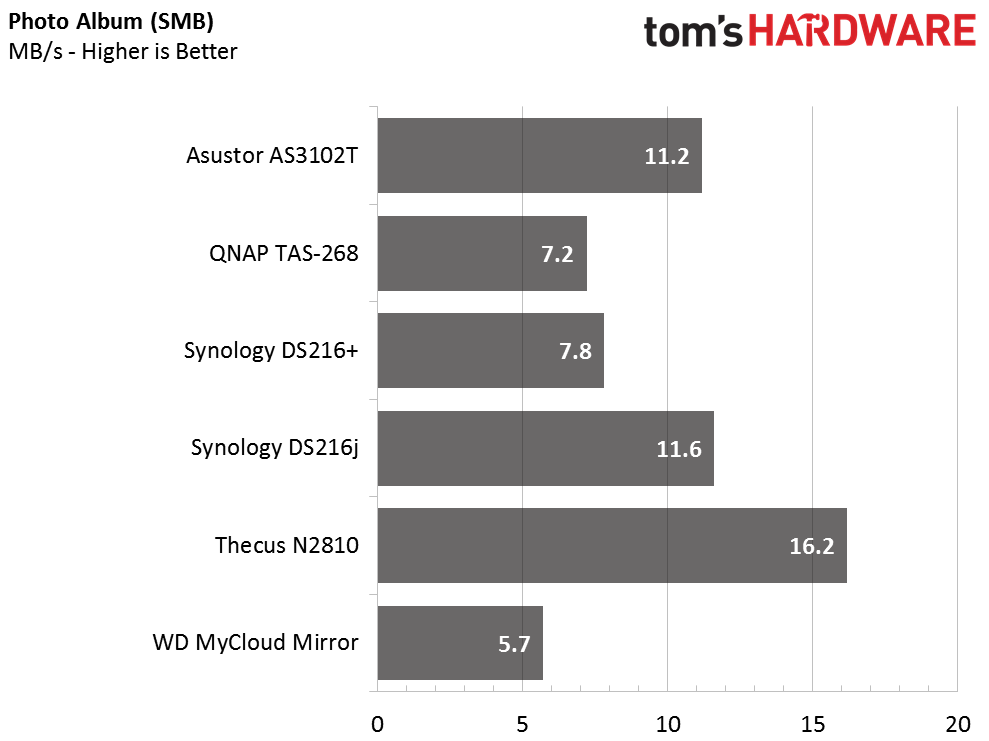
Normally we sort the different products by arranging them based upon performance (best on top, worst on bottom). However, that makes isolating a specific model difficult in this case, because every model on the list is under examination.
Intel's NASPT program tests with recorded traces, which highlights real-world performance better than other techniques. We use the longer batch test setting to record the results, which repeats the workload three times and then provides us with the average results.
Most of the systems performed well in some tests but suffered in others. The Asustor AS3102T and Thecus N2810 provided relatively high performance during each workload, and they also stand out for delivering balanced performance.
Current page: SMB Performance Testing
Prev Page Thecus N2810 & Western Digital My Cloud Mirror Next Page Encrypted Folder SMB Performance TestingGet Tom's Hardware's best news and in-depth reviews, straight to your inbox.

Chris Ramseyer was a senior contributing editor for Tom's Hardware. He tested and reviewed consumer storage.
-
BoredSysAdmin I won't buy Synology ever and no matter why and this is the reason:Reply
http://www.boredsysadmin.com/2015/10/a-bit-of-insight-into-synology-or-why.html -
littleleo Very interesting point. As for resellers I can tell you Synology is hard to recommend because they offer very little margin to the reseller. To make anything on a Synology product you have to be a partner to get the backend rebates. Otherwise it is very hard to make any profit selling Synology.Reply -
Neat-O man I would have loved to see how data rot, rebuild speed (full downtime, if any), where handled on the NAS's. As for the most part speed isn't much of a concern for me personally, as long as its "fast enough" which all of these are. I'm much more concerned about data rot and ease of maintenance.Reply -
Cerunnos Is the 216+ running btrfs?Reply
@boredsysadmin
None of these cheap NAS boxes will have 24/7 support. Established enterprise NAS units also require costly support plans to have that kind of on-call support. Synology's RS units run at only a fraction of the cost of others. Therefore, yes, you get what you pay for. -
JonDol Hi there. A decade ago there was a difference in reliability of the mechanical drives when placed vertically versus those placed horizontally. For this reason I've bought a NAS with horizontal drive bays and had to jump directly to 4 drives. Is the reliability of drives placed vertically still a concern today?Reply
Thanks -
heffeque Why review the TAS-268 when you've got the TS-251 for the same price and much better hardware and software?Reply
https://www.qnap.com/en-us/product/contrast.php?cp%5B%5D=195&cp%5B%5D=142&cp%5B%5D=208 -
Maxx_Power I'm pretty sure the ASUSTOR unit uses Intel Atom-based CPUs, not Broadwell-based. I think it is a Celeron N3050.Reply -
JBForum @CERUNNOS Yes, and I don't think any of the others offer a bit rot preventing system.... which was not mentioned in the article.Reply -
CRamseyer I use Seagate NAS 4TB HDDs in NAS reviews with 7 or less drive bays. The 4 to 7 bay systems run in RAID 5. The 8+ bay systems get NAS Pro 6TB drives and RAID 6.Reply
The Asustor system uses a Braswell-based processor.
