Why you can trust Tom's Hardware
Protection Features
Check out our PSUs 101 article to learn more about PSU protection features.
| OCP (Cold @ 25°C) | 12V: 81.8A (134.1%), 11.998V 5V: 24.8A (124%), 5.117V 3.3V: 22A (110%), 3.352V 5VSB: 4.5A (150%), 4.991V |
| OCP (Hot @ 44°C) | 12V: 81.8A (134.1%), 12.007V 5V: 23.3A (116.5%), 5.120V 3.3V: 20.3A (101.5%), 3.343V 5VSB: 4.5A (150%), 4.993V |
| OPP (Cold @ 27°C) | 981.43W (131.08%) |
| OPP (Hot @ 43°C) | 982.05W (134.16%) |
| OTP | ✓ (131°C @ 12V Heat Sink) |
| SCP | 12V to Earth: ✓ 5V to Earth: ✓ 3.3V to Earth: ✓ 5VSB to Earth: ✓ -12V to Earth: ✓ |
| PWR_OK | Proper operation |
| NLO | ✓ |
| SIP | Surge: MOV Inrush: NTC Thermistor & Bypass relay |
It is nice to see all protection features adequately set. MEIC paid extra attention to protection features, which are essential to every electronic device, including PSUs.
DC Power Sequencing
According to Intel’s most recent Power Supply Design Guide (revision 1.4), the +12V and 5V outputs must be equal to or greater than the 3.3V rail at all times. Unfortunately, Intel doesn't mention why it is so important to always keep the 3.3V rail's voltage lower than the levels of the other two outputs.
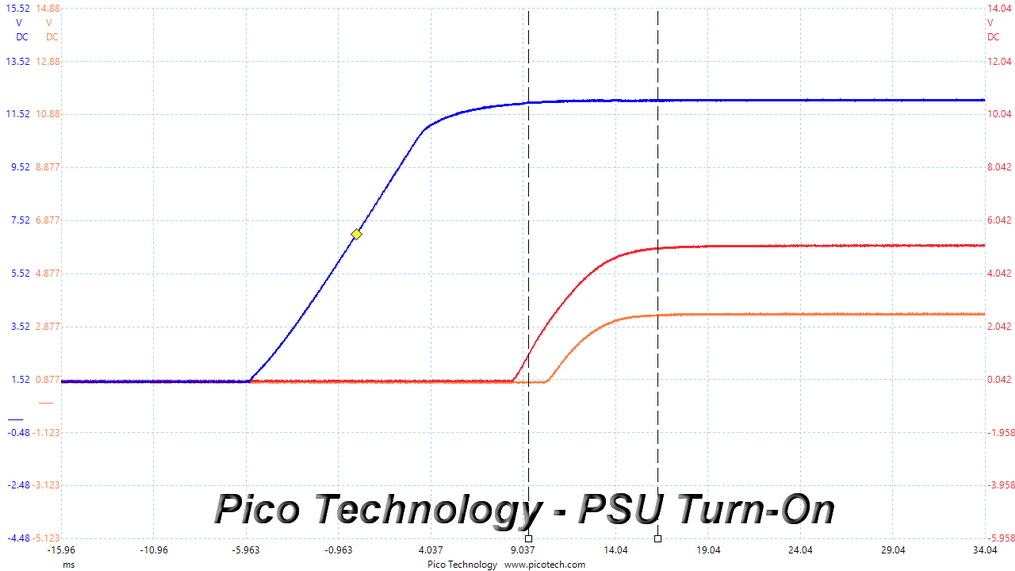
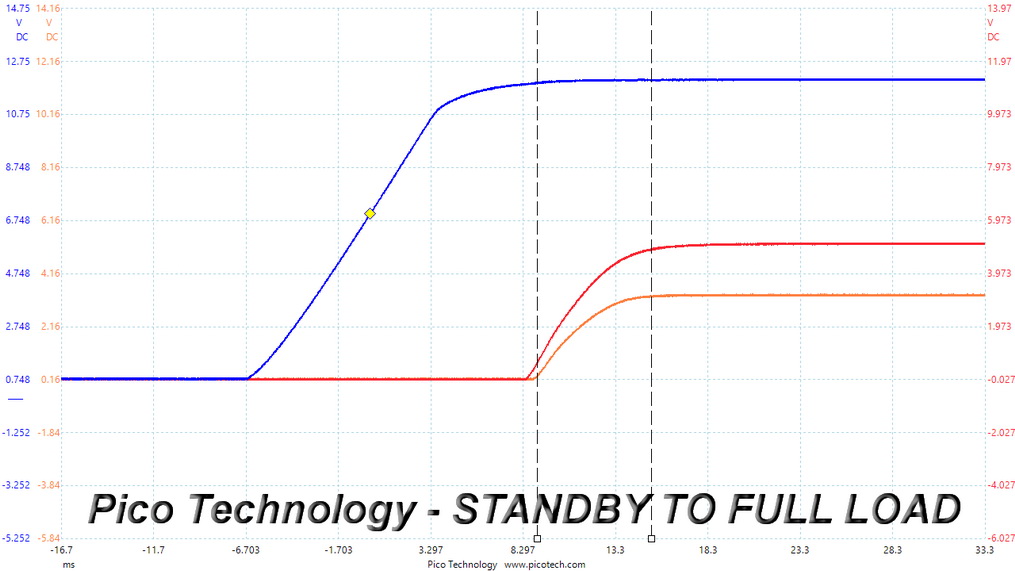
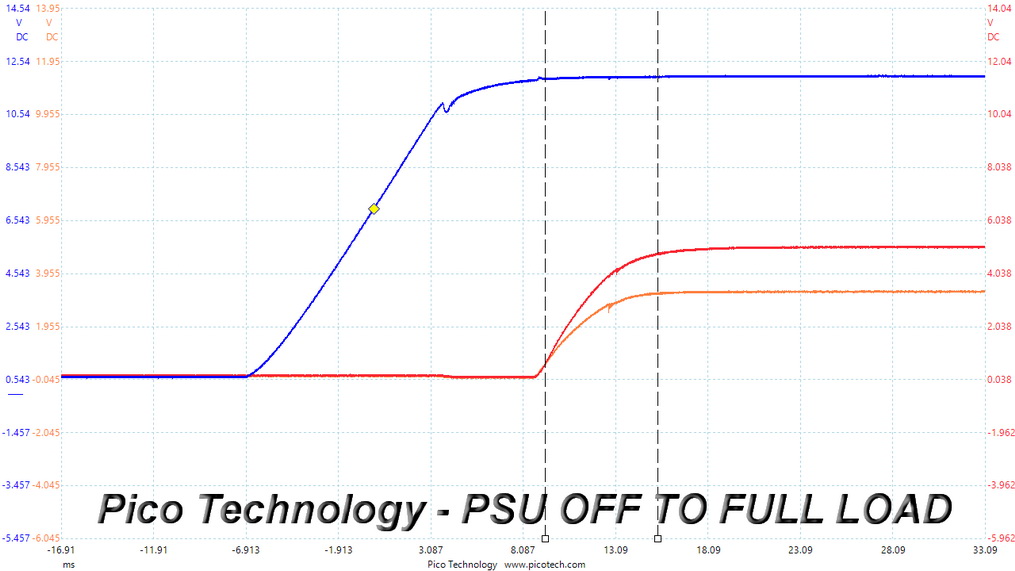
No problems here since the 3.3V rail is always lower than the other two.
Cross Load Tests
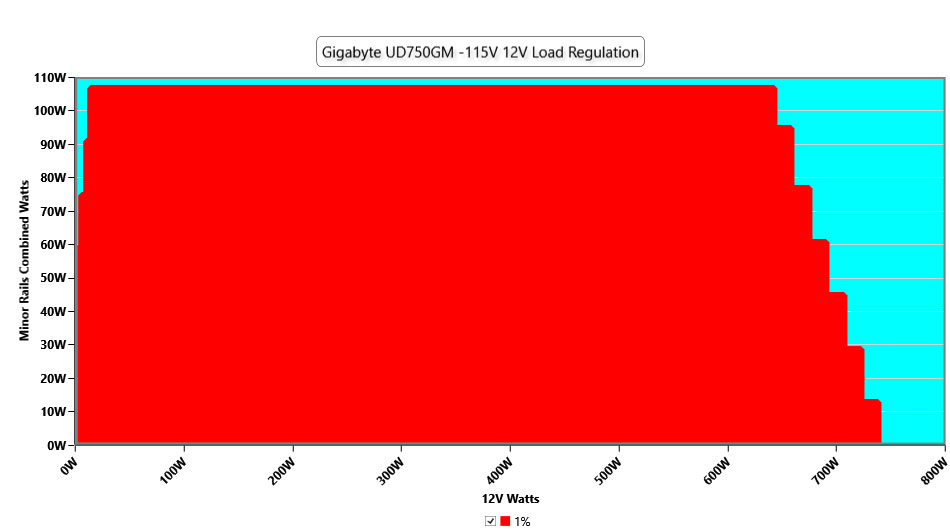
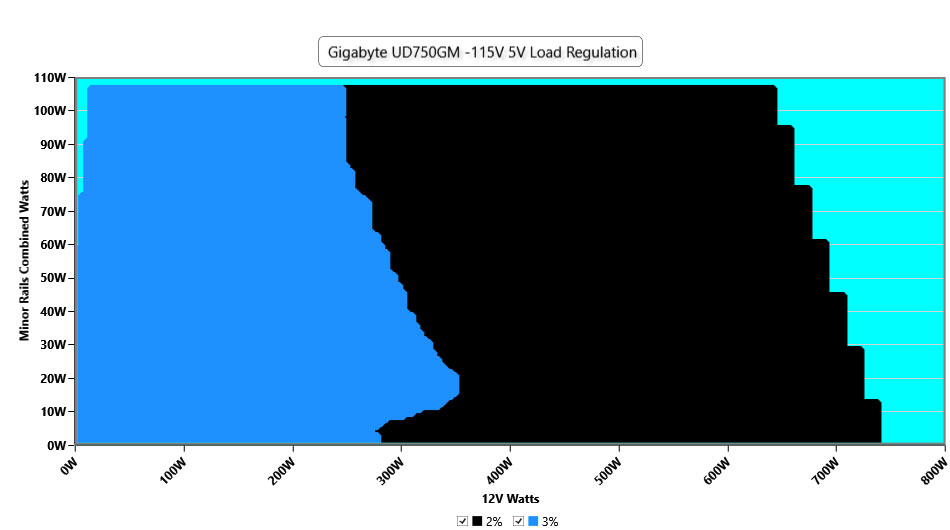
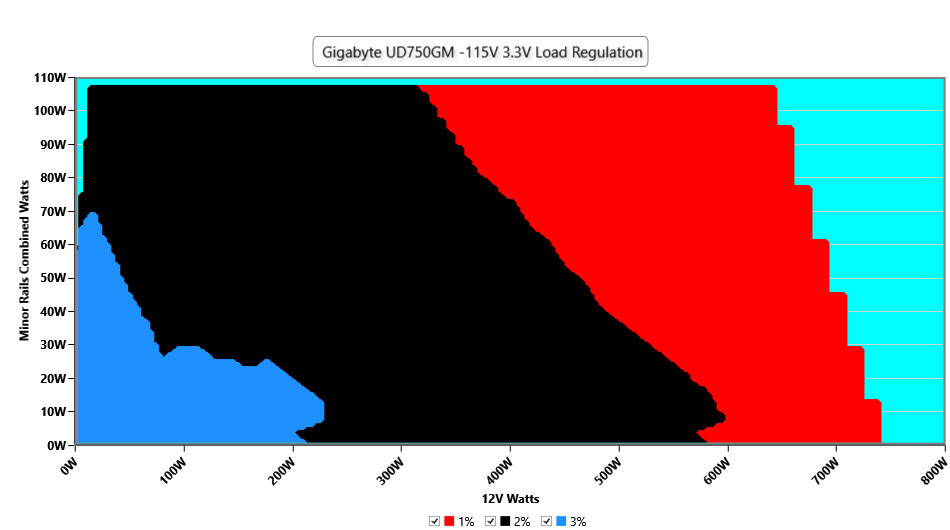
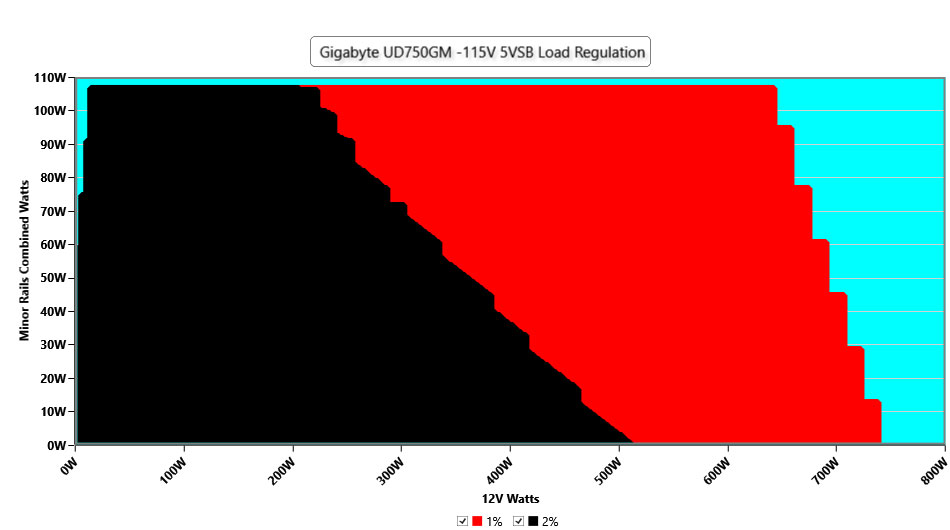
To generate the following charts, we set our loaders to auto mode through custom-made software before trying more than 25,000 possible load combinations with the +12V, 5V, and 3.3V rails. The deviations in each of the charts below are calculated by taking the nominal values of the rails (12V, 5V, and 3.3V) as point zero. The ambient temperature during testing was between 30 to 32 degrees Celsius (86 to 89.6 degrees Fahrenheit).
Load Regulation Charts
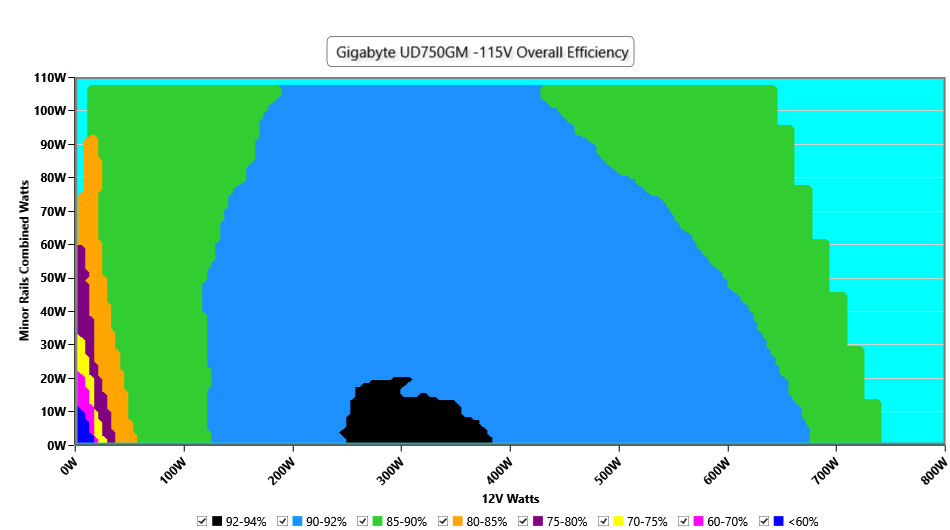
Efficiency Graph
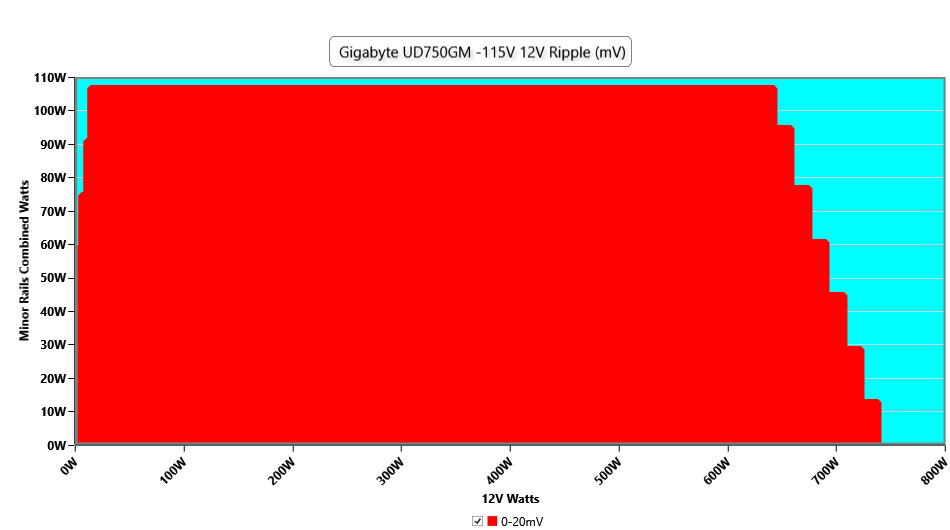
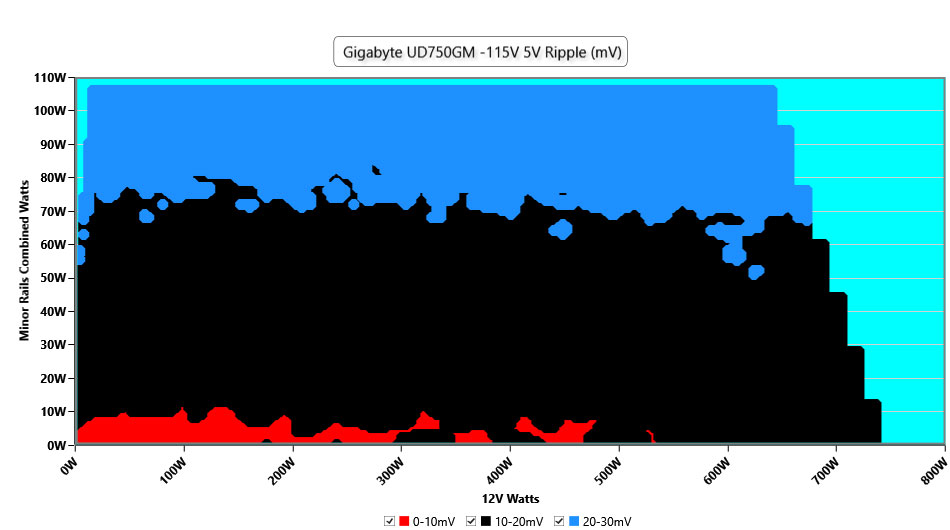
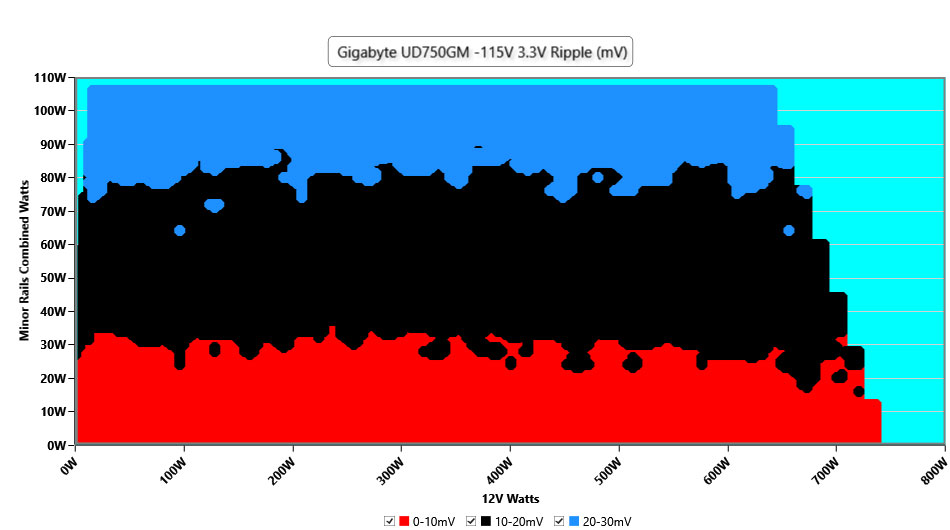
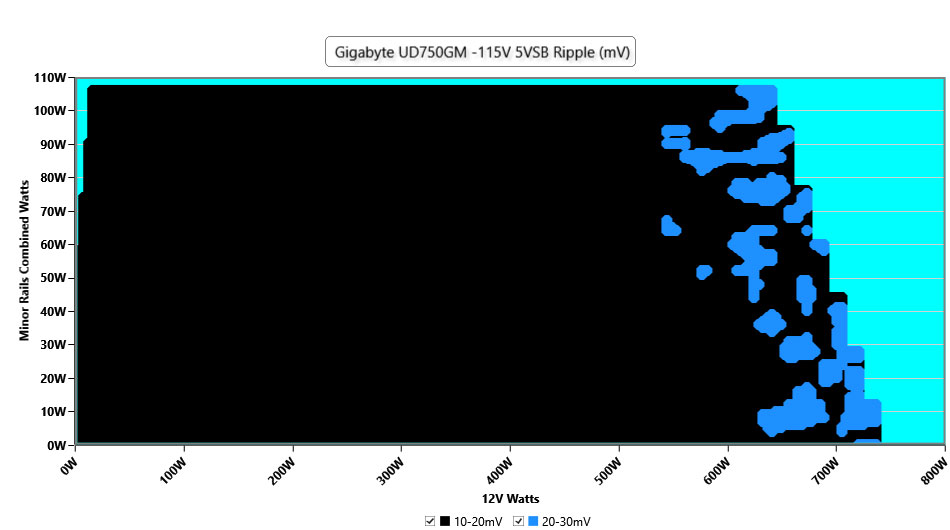
Ripple Graphs
The lower the power supply's ripple, the more stable the system will be and less stress will also be applied to its components.
Infrared Images
We apply a half-load for 10 minutes with the PSU's top cover and cooling fan removed before taking photos with a modified Fluke Ti480 PRO camera able to deliver an IR resolution of 640x480 (307,200 pixels).
Get Tom's Hardware's best news and in-depth reviews, straight to your inbox.
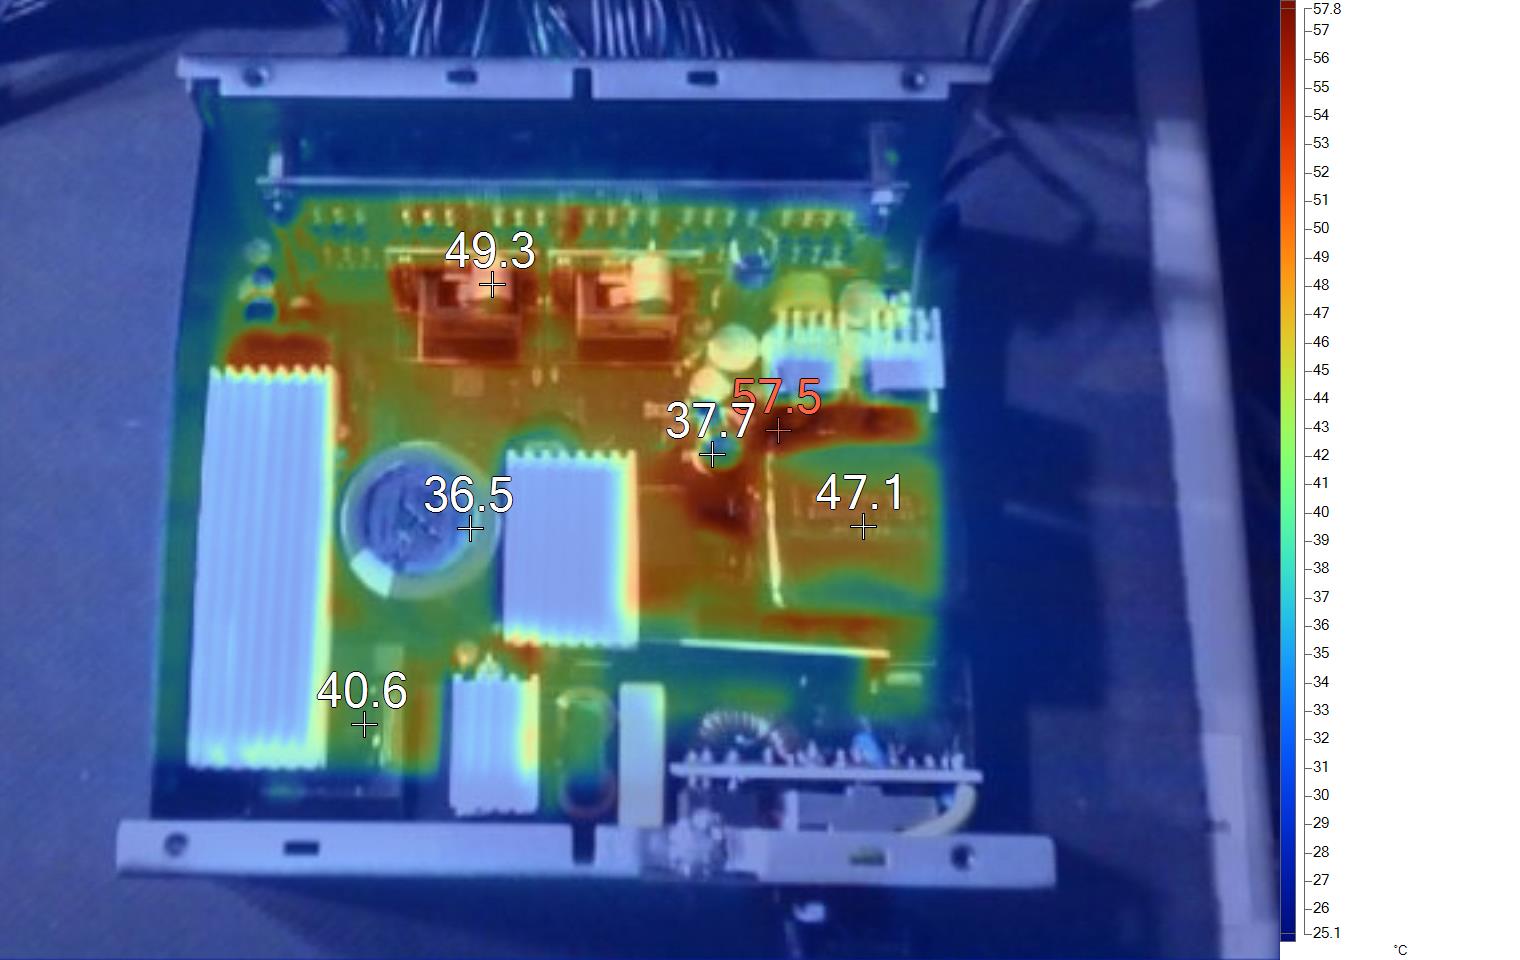
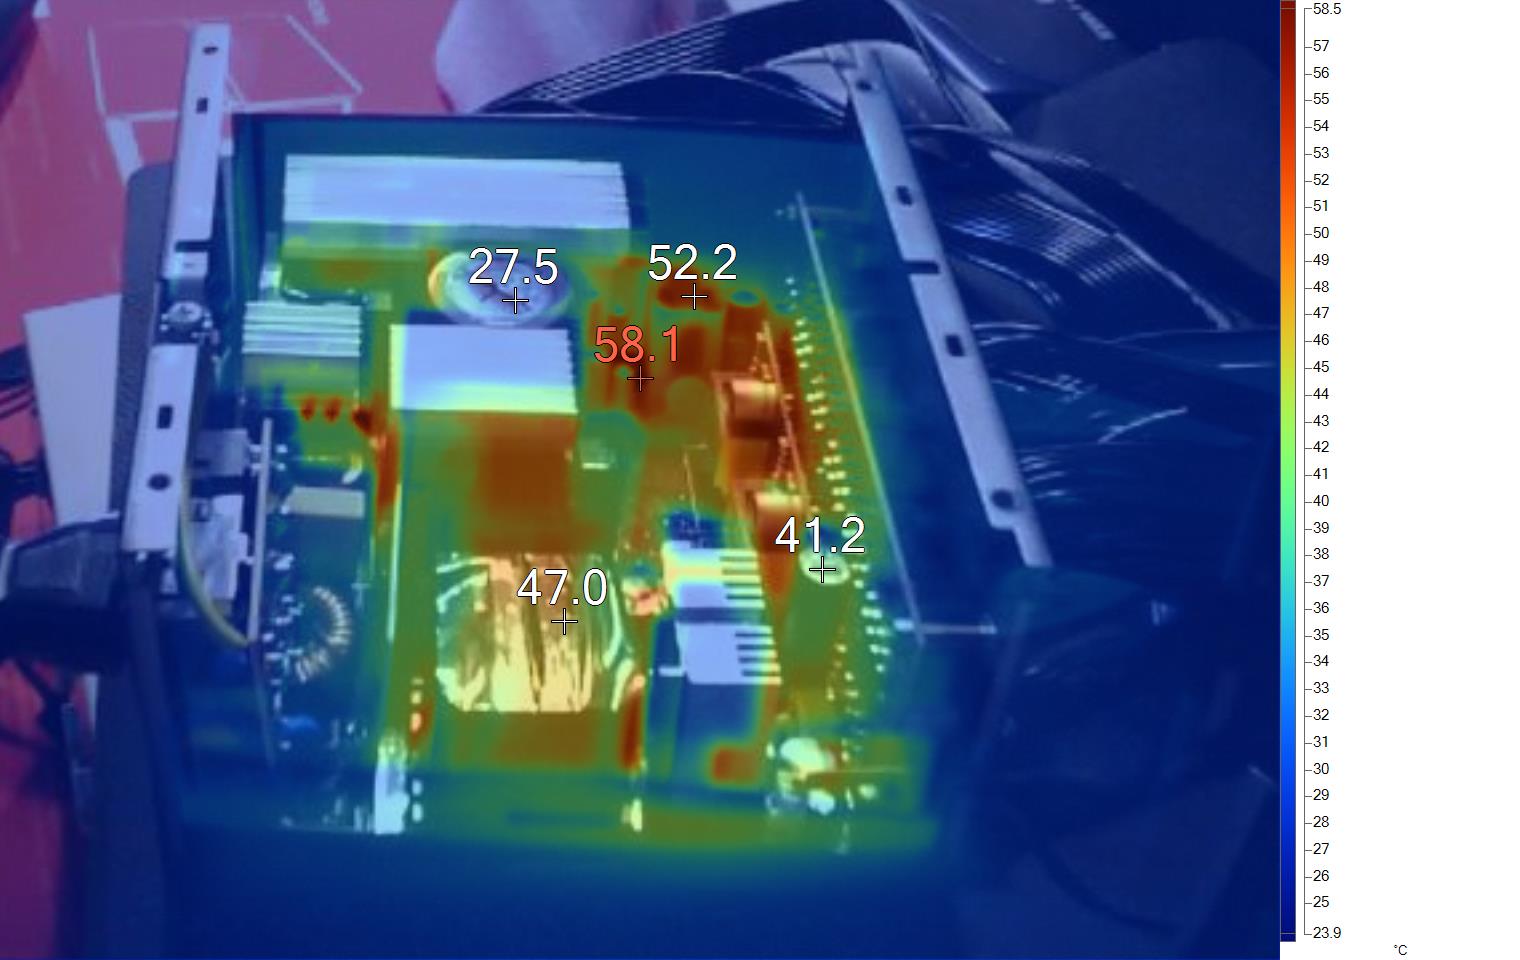
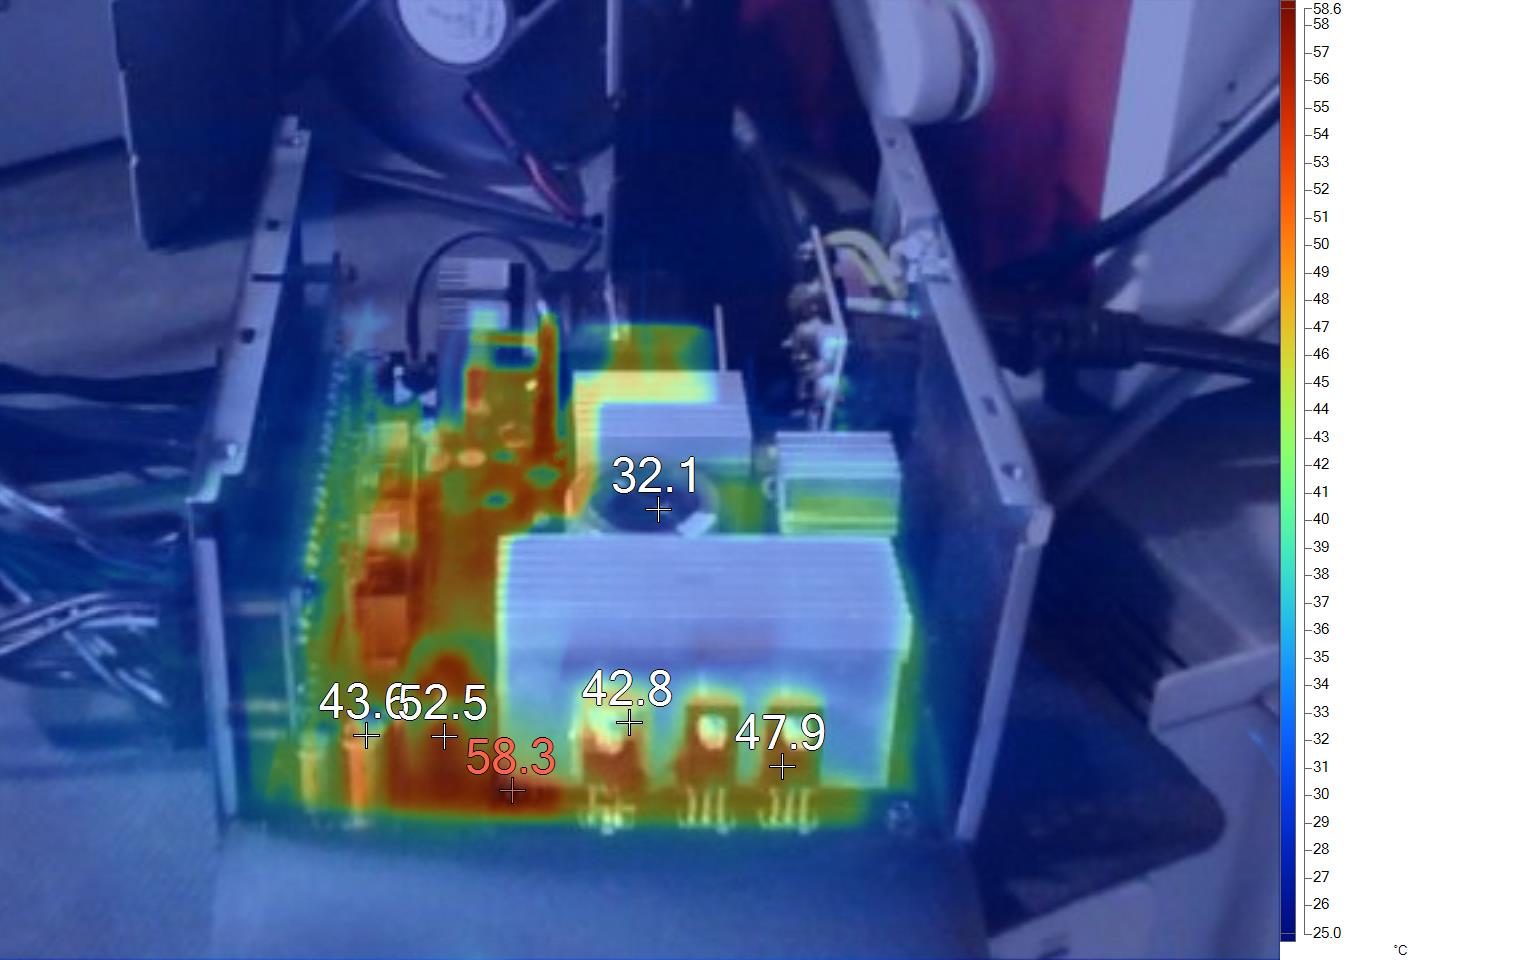
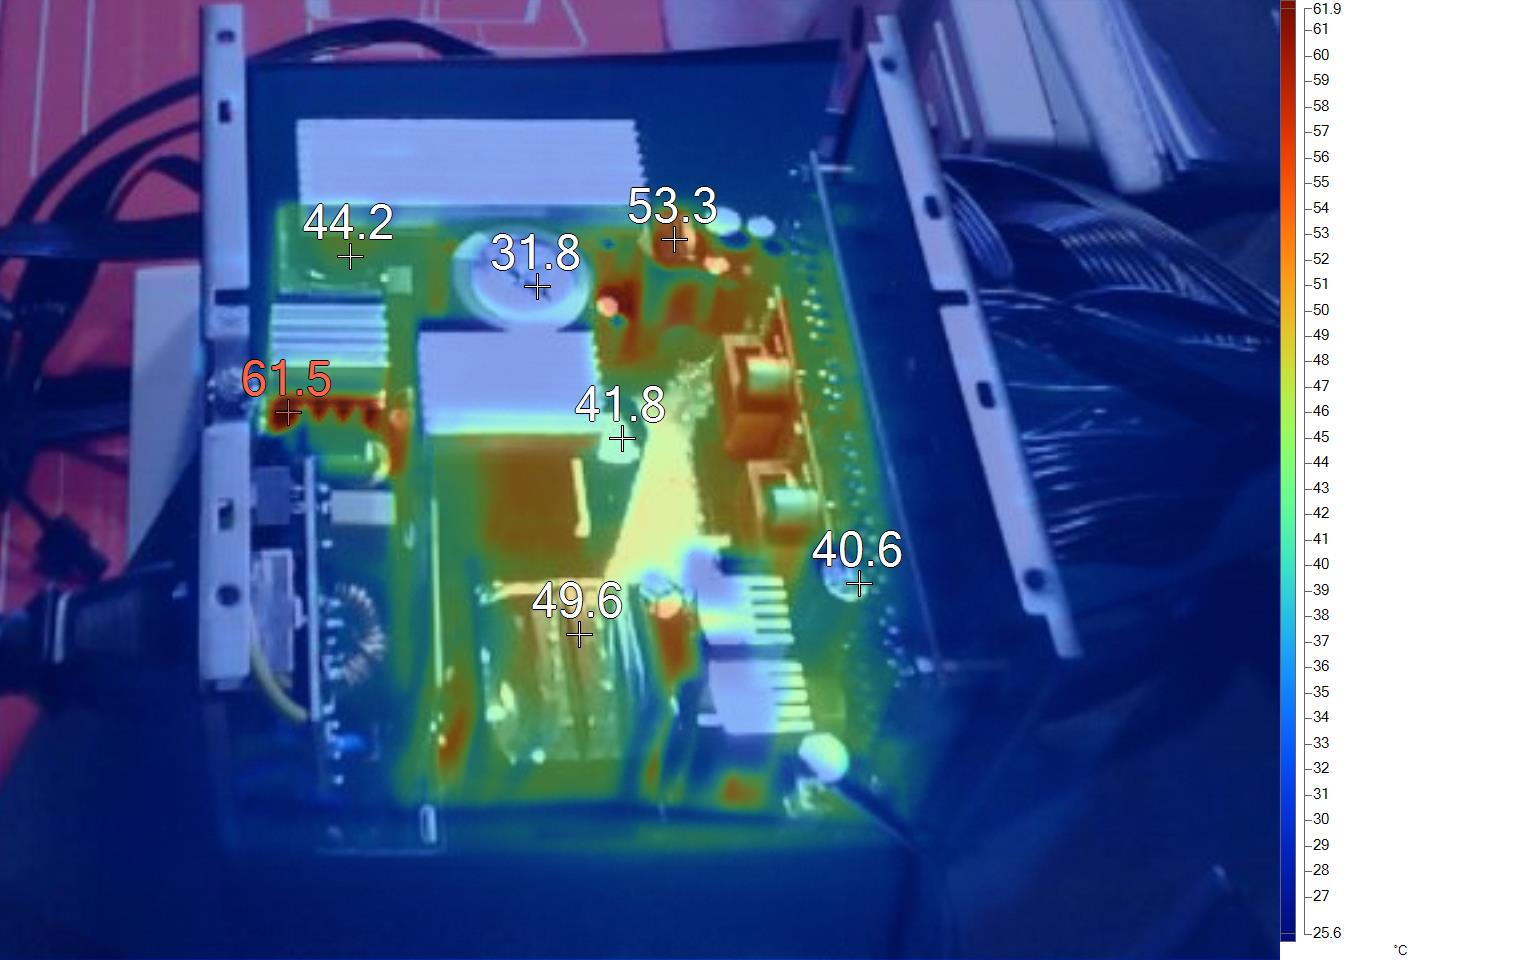
The platform's high efficiency minimized energy losses. Thus the heat loads are lower. This is why our IR camera didn't show any high-temperature parts during this test.
MORE: Best Power Supplies
MORE: How We Test Power Supplies
MORE: All Power Supply Content
Current page: Protection Features, DC Power Sequencing, Cross-Load Tests and Infrared Images
Prev Page Load Regulation, Hold-Up Time, Inrush & Leakage Current, Efficiency and Noise Next Page Transient Response Tests, Timing Tests, Ripple Measurements and EMC Pre-Compliance Testing
Aris Mpitziopoulos is a contributing editor at Tom's Hardware, covering PSUs.
-
PiranhaTech I'm curious if you did the GamersNexus tests. A lot of PC builders are going to wait for their tests before considering a Gigabyte PSU due to the exploding PSU issue they hadReply
aACtT_rzToIView: https://www.youtube.com/watch?v=aACtT_rzToI
