Why you can trust Tom's Hardware
SPEC Workstation and Adobe Performance Test Notes
We ran an extra series of tests to reflect performance in workstation-class workloads. Some of these applications make an appearance in our standard test suite on the following page, but those test configurations and benchmarks are focused on a typical desktop-class environment. In contrast, these tests are configured to stress the systems with workstation-class workloads.
With the exception of the W-3175X system, we loaded down our test platforms with 64GB of DDR4 memory spread across four modules to accommodate the expanded memory capacity required for several of these workstation-focused tasks. Due to the W-3175X's six channel memory controller and our limited stock of high-capacity DIMMs, we used six 8GB DIMMs for a total capacity of 48GB. All systems were tested at the vendor-specified supported memory data transfer rates for their respective stock configurations, and DDR4-3600 for the overclocked settings.
We also conducted the tests on this page with a PCIe 4.0 Gigabyte Aorus SSD for all of the test systems, including the Intel platforms that are limited to PCIe 3.0 throughput. This will enable additional platform-level performance gains from the increased throughput of the faster interface supported by AMD's processors.
All Threadripper processors are tested in creator mode, meaning the full heft of their prodigious number of cores and threads are in action.
Puget Systems Benchmarks
Puget Systems is a boutique vendor that caters to professional users with custom-designed systems targeted at specific workloads. The company developed a series of acclaimed benchmarks for Adobe software, which you can find here. We use several of the benchmarks for our first round of workstation testing, followed by SPECworkstation 3 benchmarks.
Adobe After Effects CC Render Node Benchmark
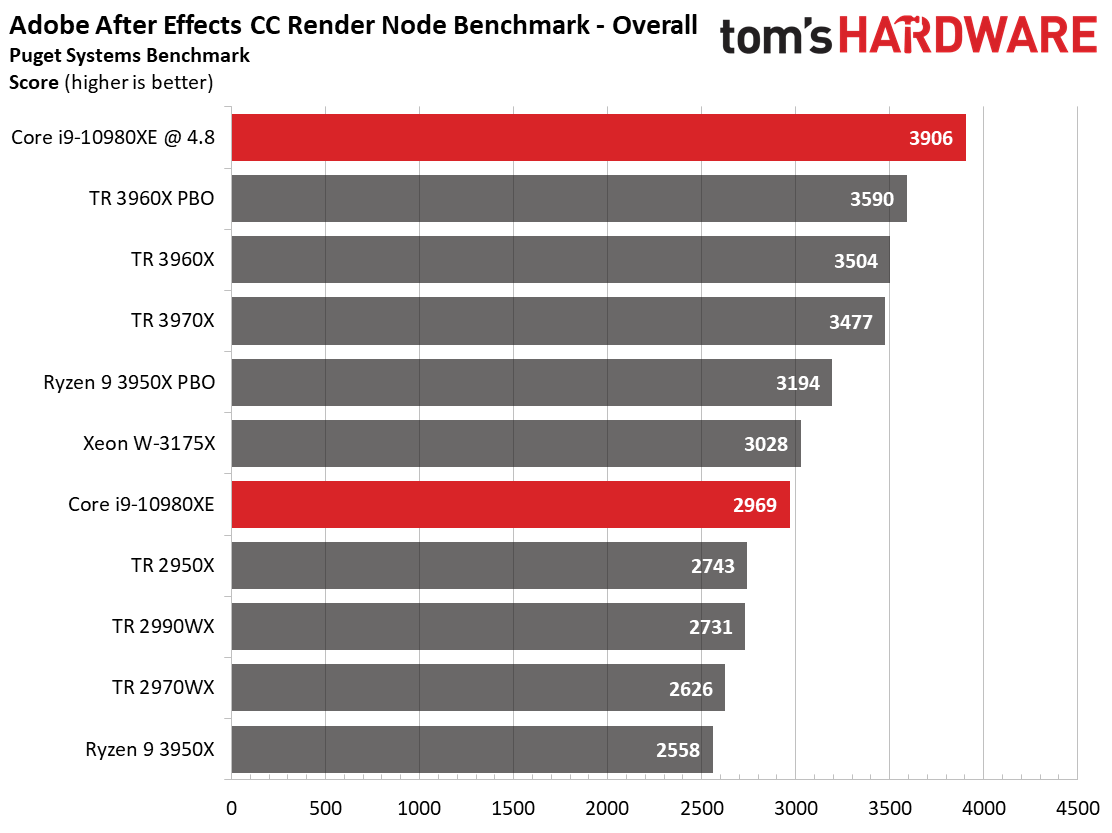
The After Effects render node benchmark leverages the in-built aerender application that splits the render engine across multiple threads to maximize CPU and GPU performance. This test is memory-intensive, so capacity and throughput are important and can be a limiting factor.
Focusing on the price-competitive processors, the stock -10980XE leads the 2970WX and Ryzen 9 3950X, but the 3950X profits heavily from overclocking. Bumping up the voltage on the -10980XE opens up a large divide between it and the rest of the test pool.
Get Tom's Hardware's best news and in-depth reviews, straight to your inbox.
Adobe Premier Pro CC Benchmark
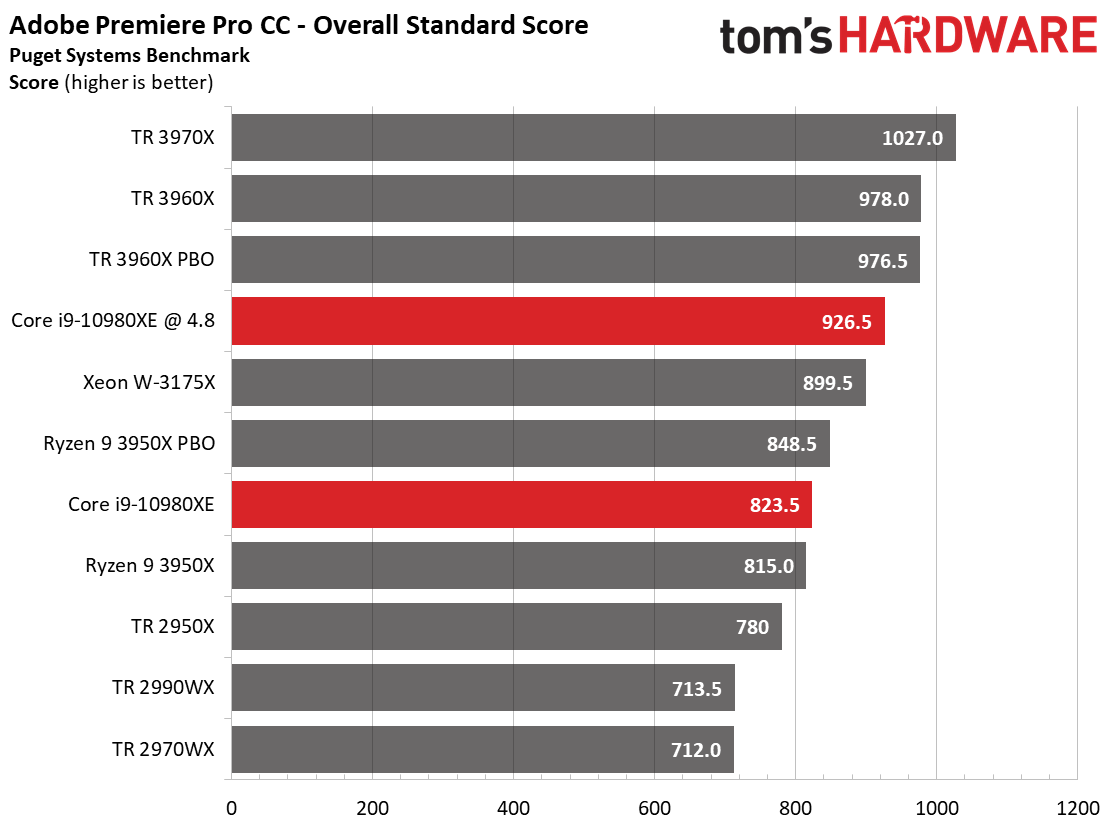
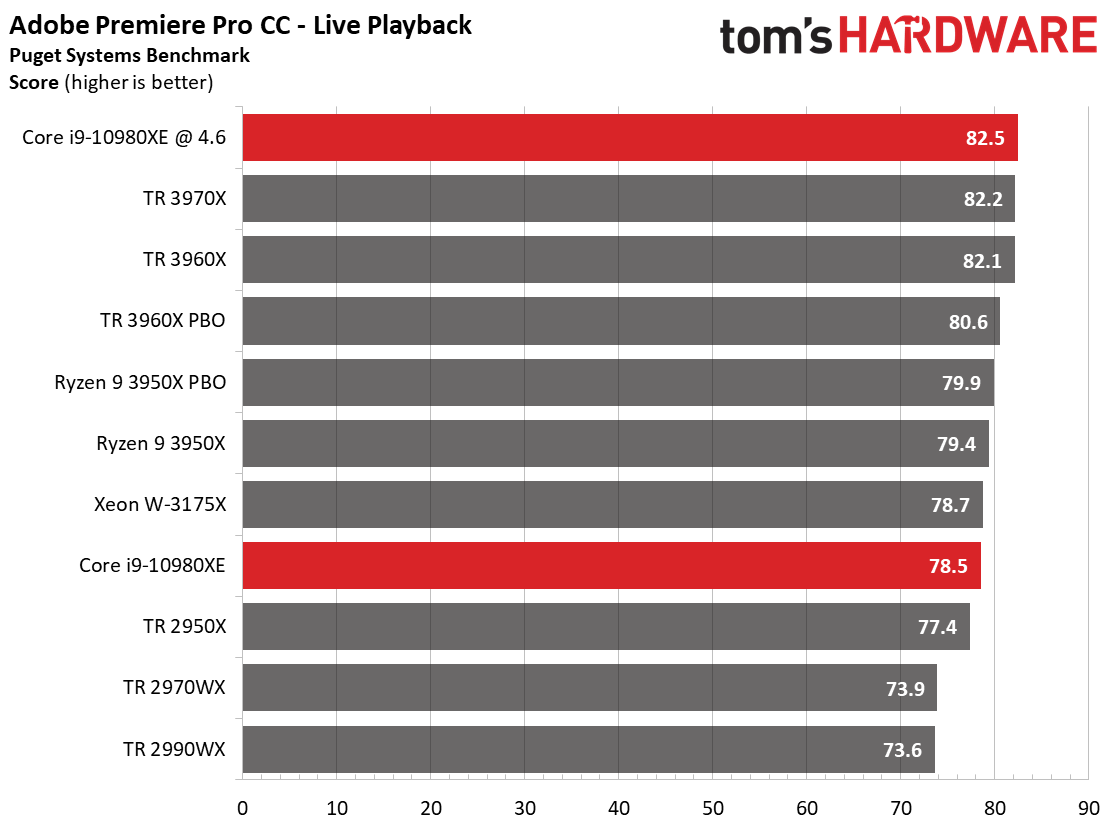
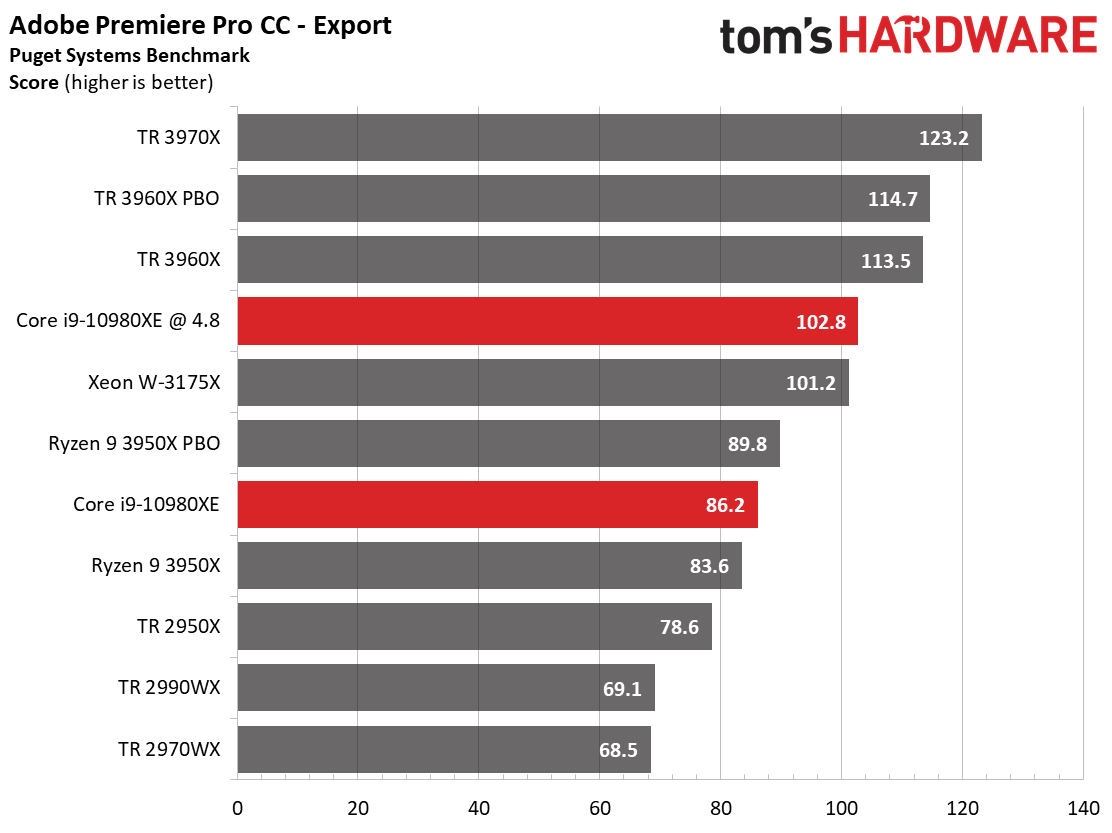
This benchmark measures live playback and export performance with several codecs at 4K and 8K resolutions. It also incorporates 'Heavy GPU' and 'Heavy CPU' effects that stress the system beyond a typical workload. Storage throughput also heavily impacts the score.
Feeding the third-gen AMD processors with the throughput of PCIe 4.0 certainly helps, but sheer brute computational force appears to be the name of the game. The Ryzen 9 3950X trails the -10980XE at stock settings, but overclocking again pushes the -10980XE into the lead.
Adobe Photoshop CC Benchmark
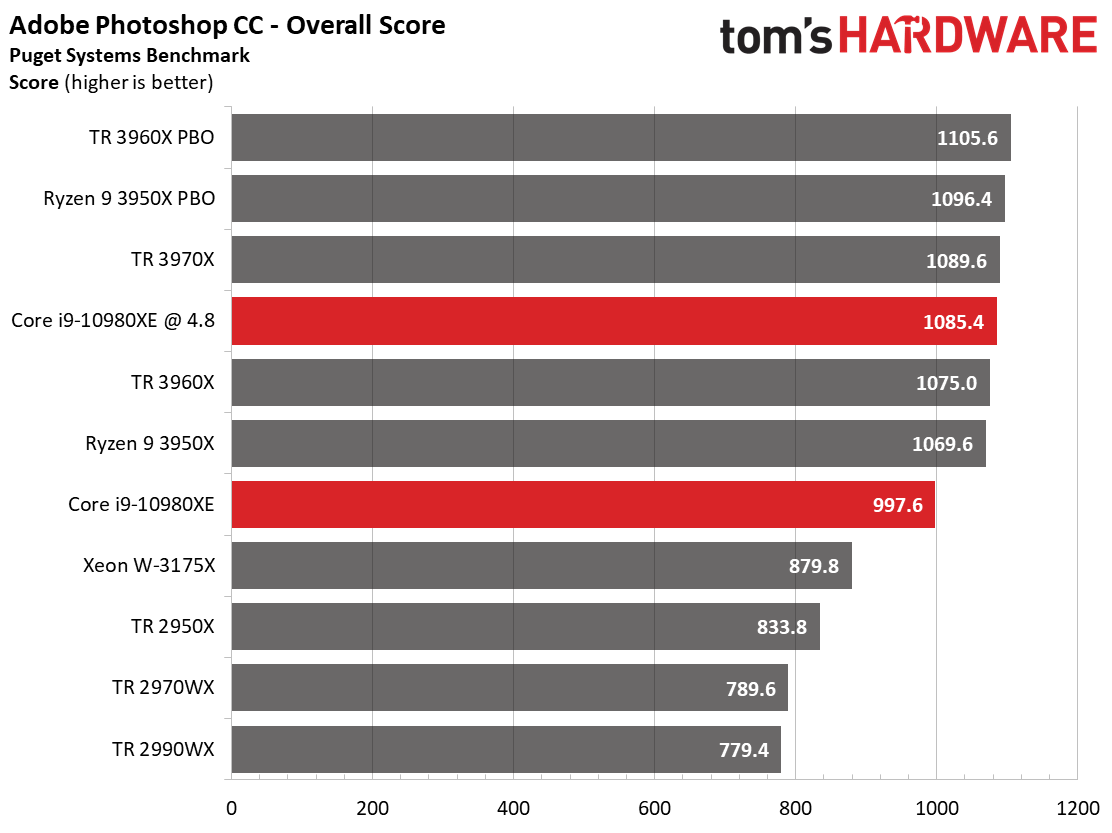
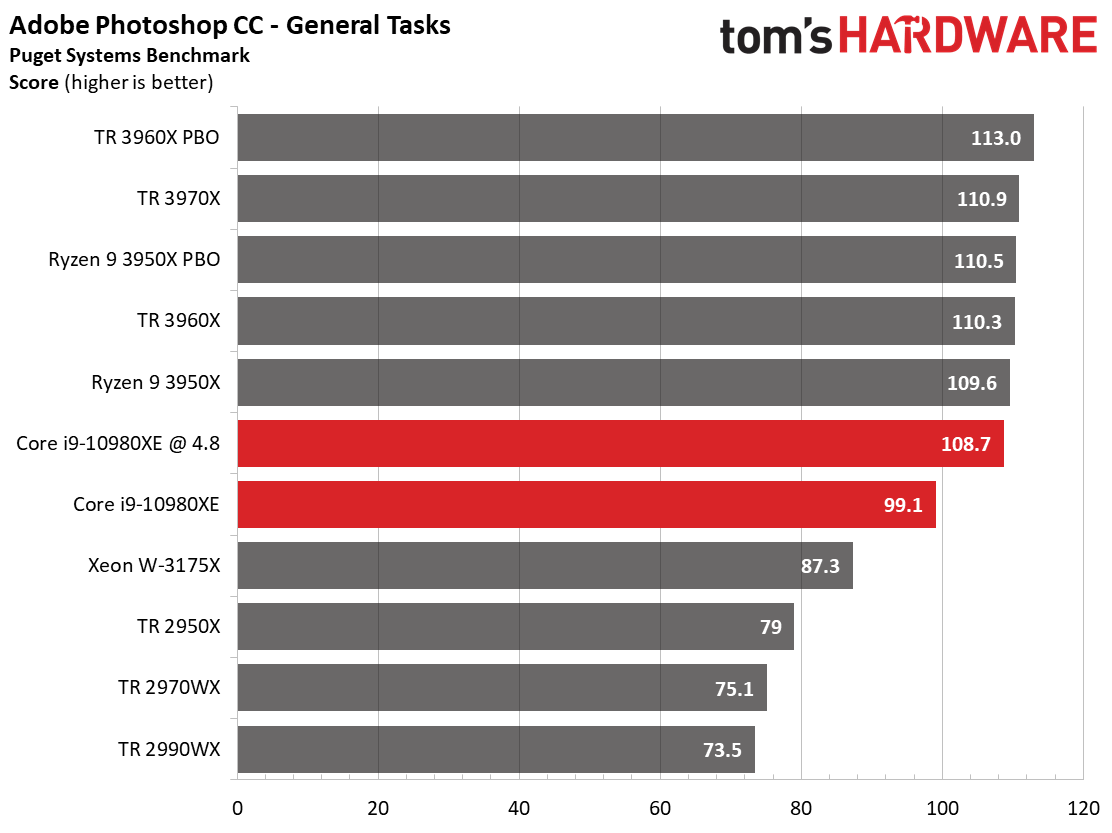
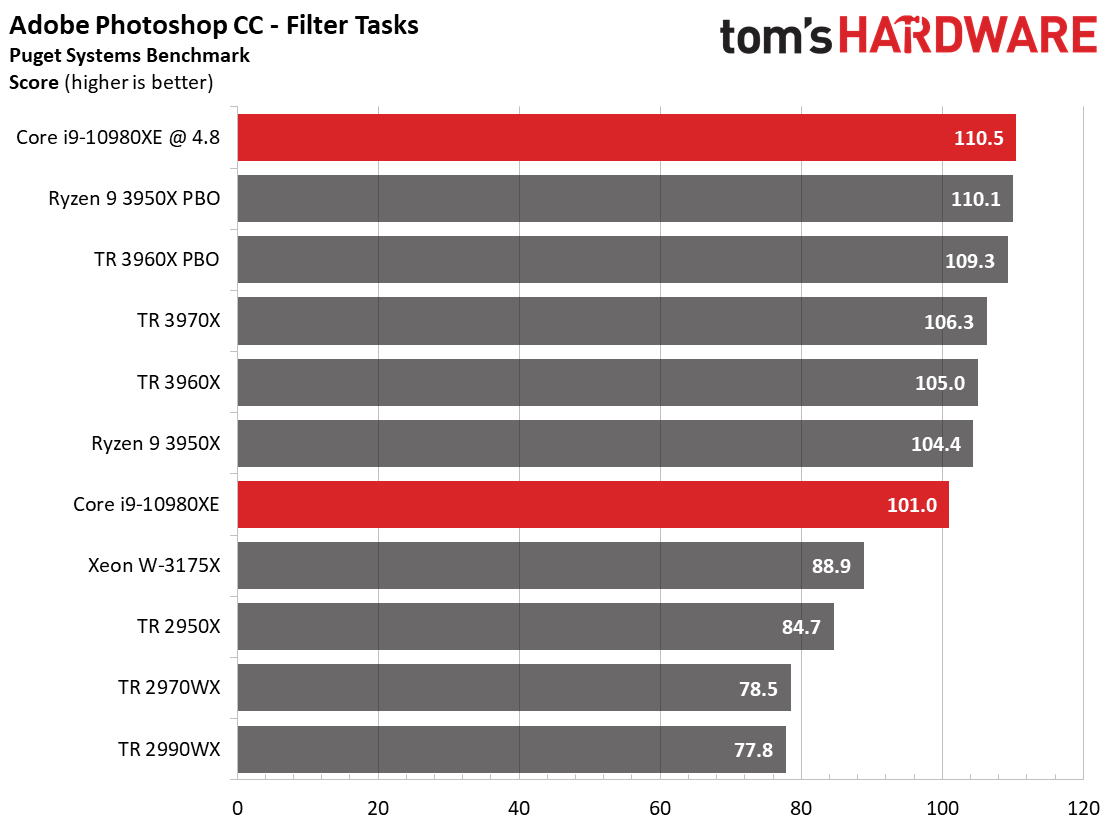
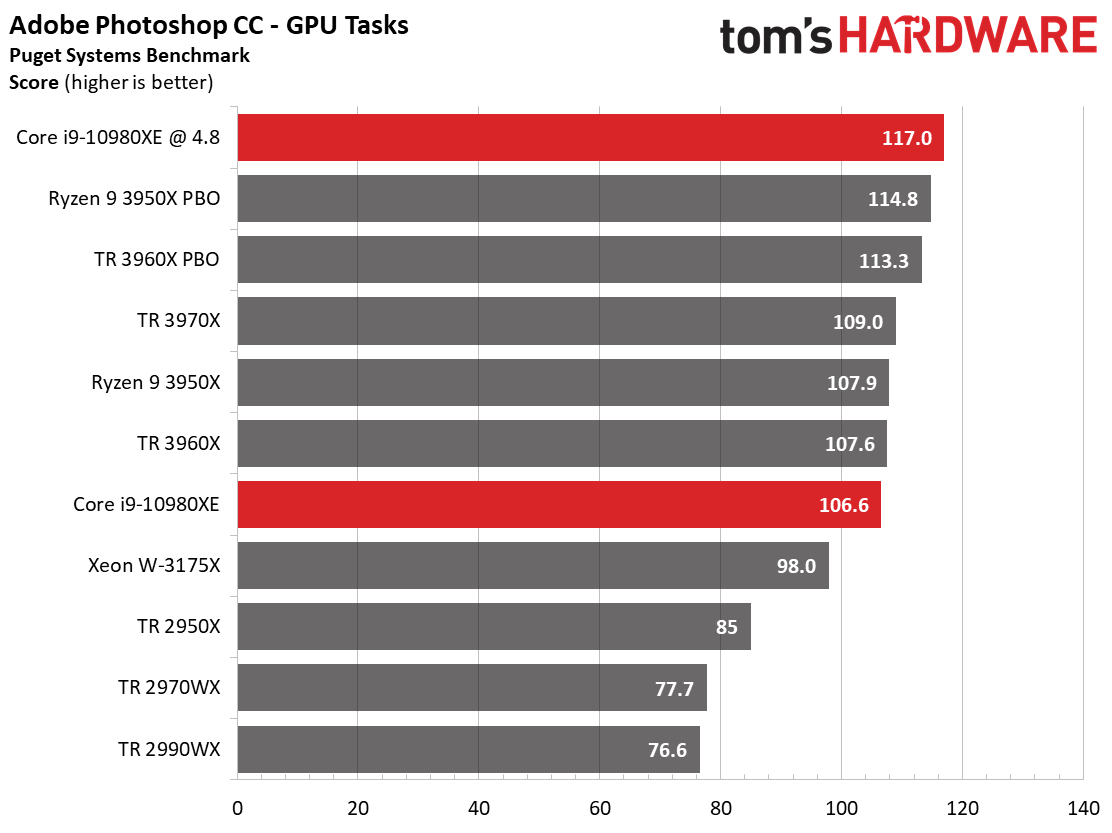
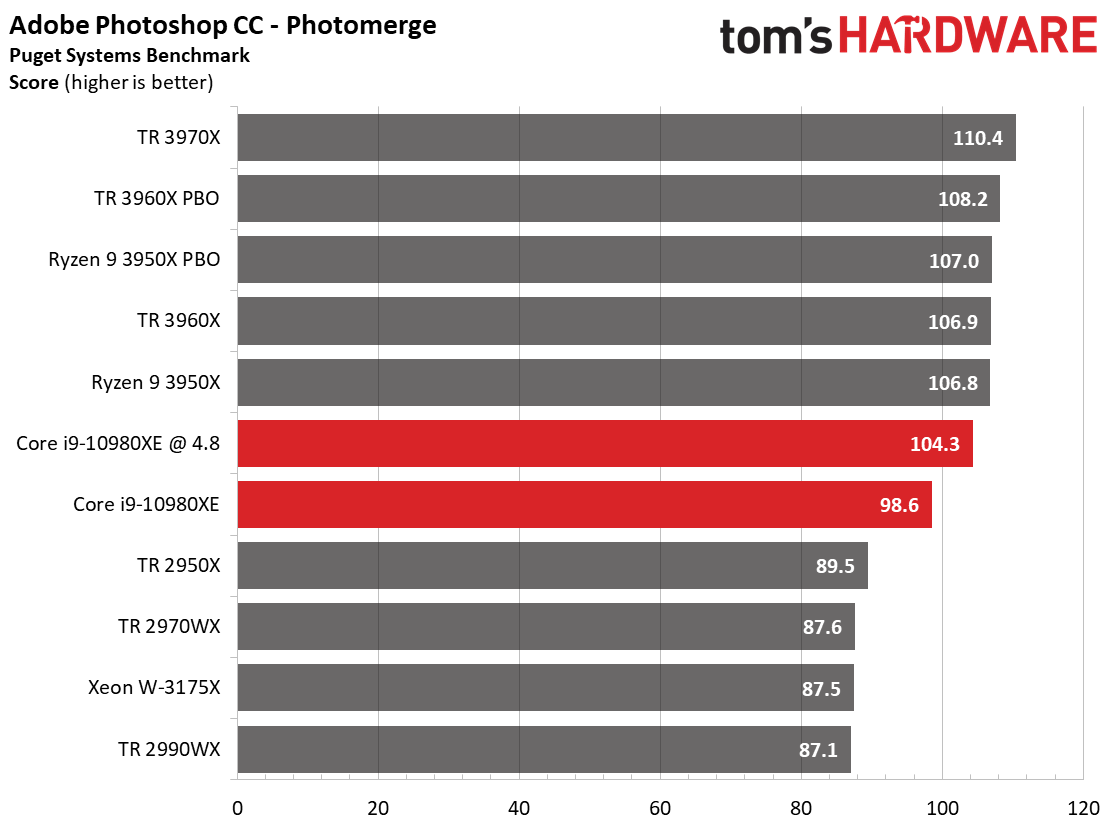
The Photoshop benchmark measures performance in a diverse range of tasks, measuring the amount of time taken to complete general tasks, create panoramas (photomerge results) and apply filters.
The Threadripper processors prove their mettle with leading performance, but notice the Ryzen 9 3950X: That processor is significantly cheaper at $749 and drops into mainstream motherboards, which equates to lower overall platform pricing. It also only has access to a single dual-channel memory controller, yet manages to trade blows with Threadripper 3000's two dual-channel controllers. Given its pricing, and the performance you'll see throughout these workstation tests, the Ryzen 9 3950X steals the show.
SPECworkstation 3 Benchmarks
The SPECworkstation 3 benchmark suite is designed to measure workstation performance in professional applications. The full suite consists of more than 30 applications split among seven categories, but we've winnowed down the list to tests that largely focus specifically on CPU performance. We haven't submitted these benchmarks to the SPEC organization, so be aware these are not official benchmarks.
Media and Entertainment
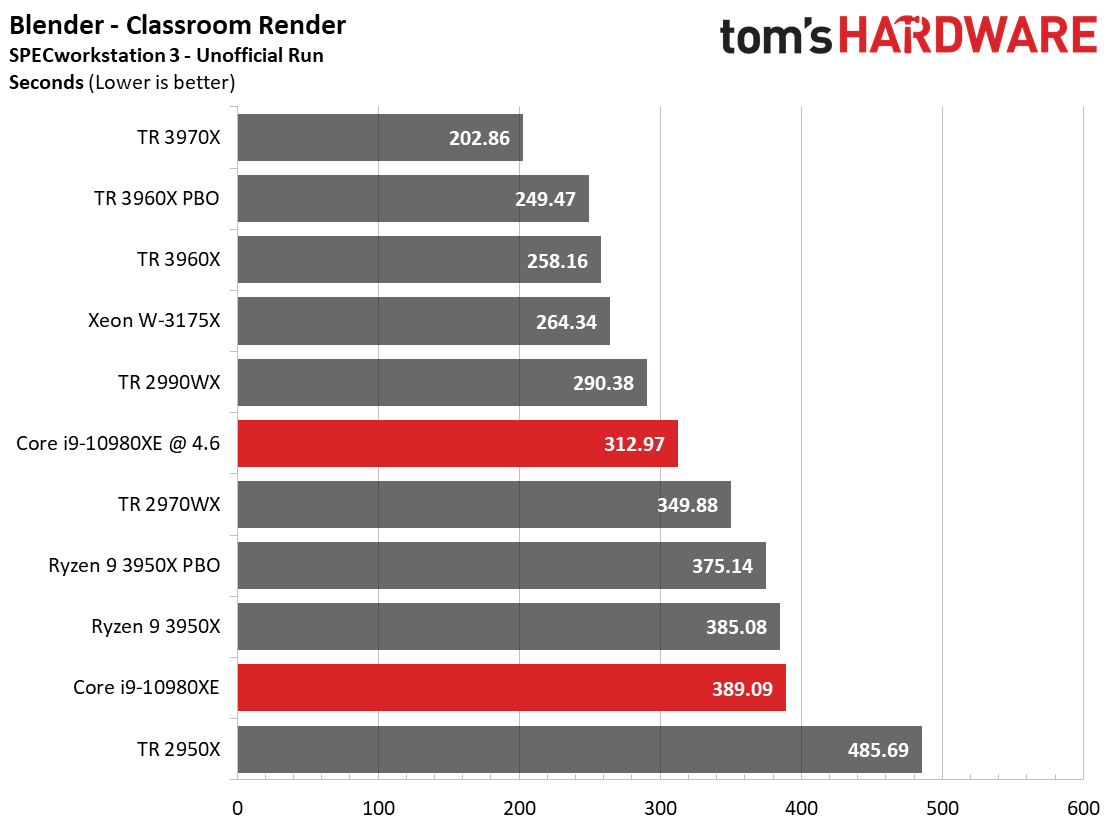
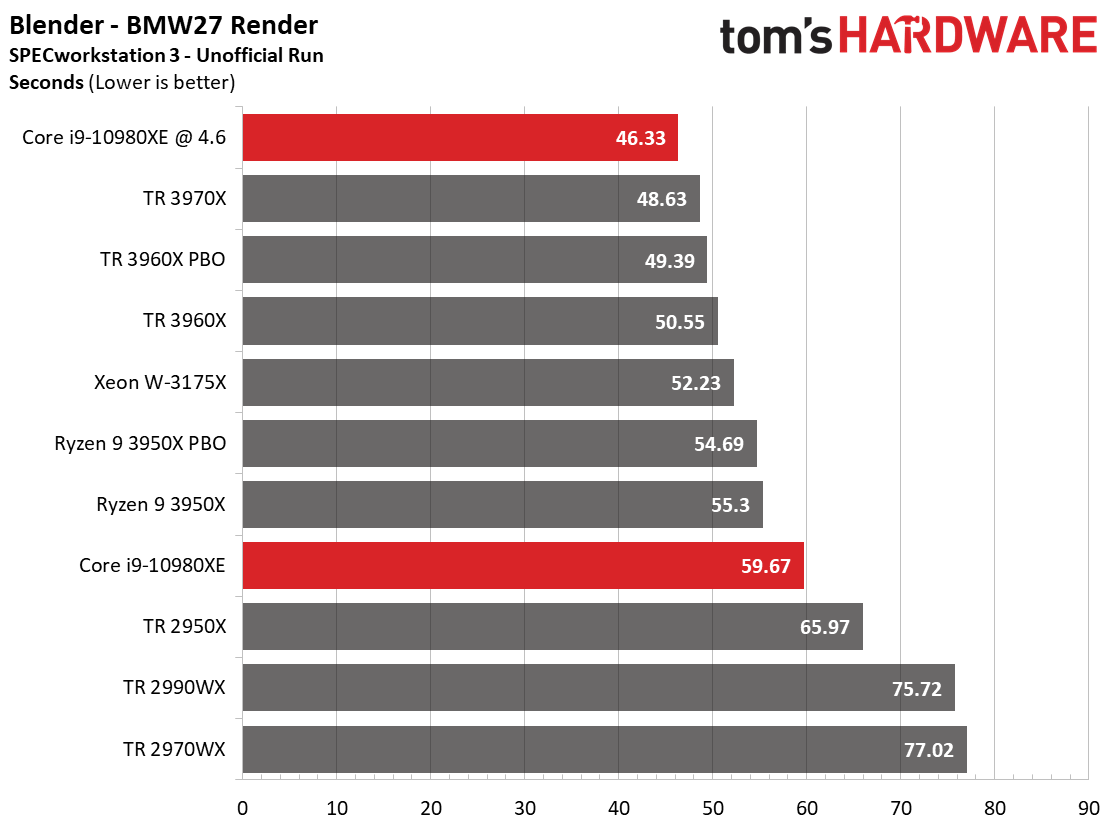
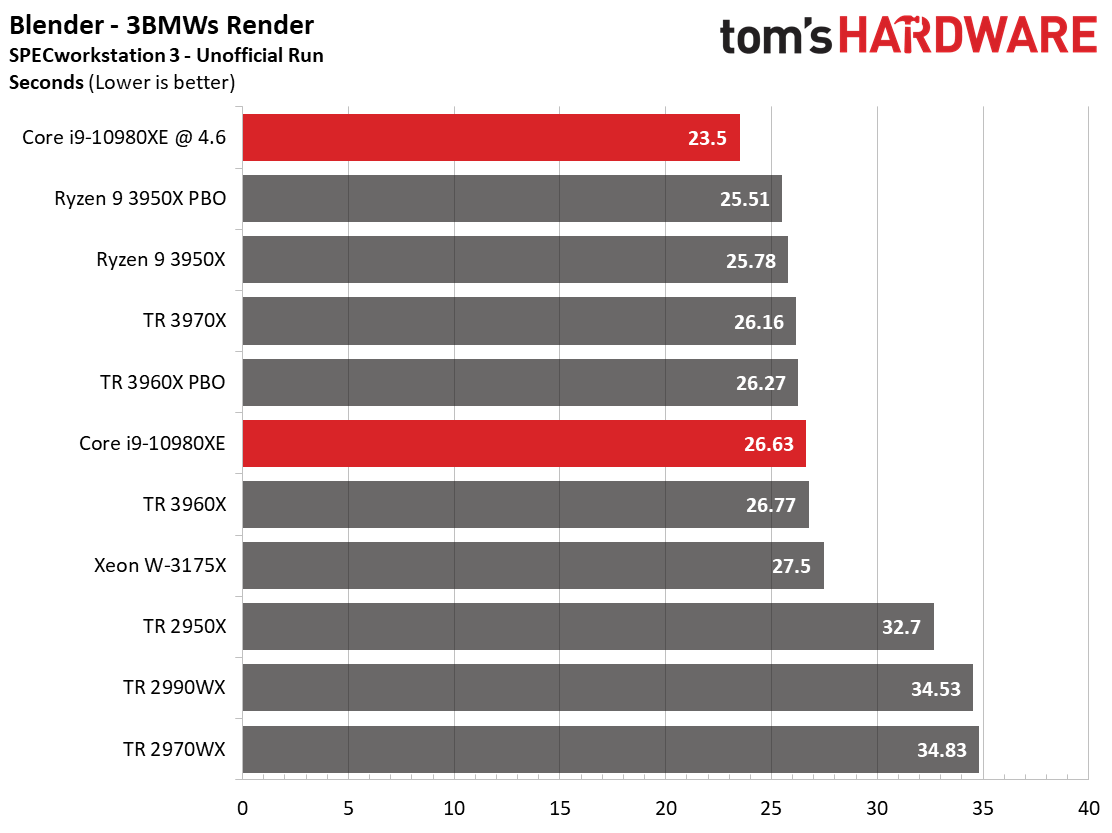
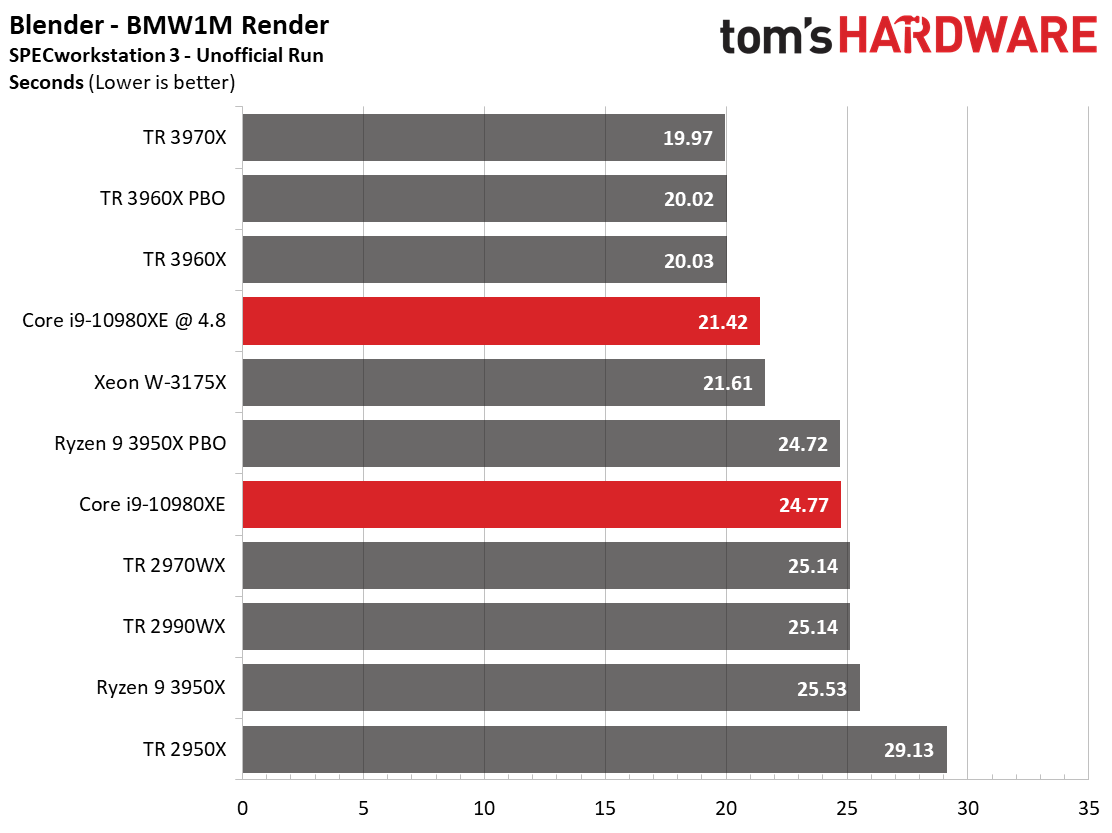
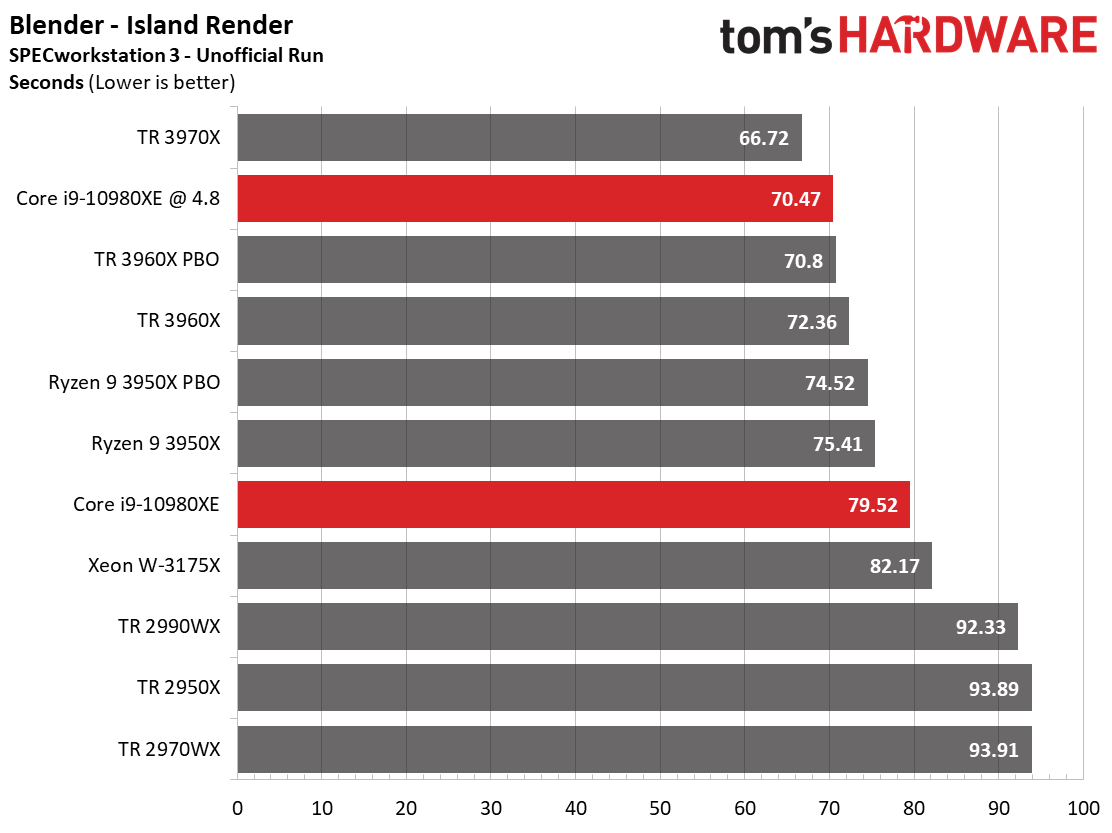
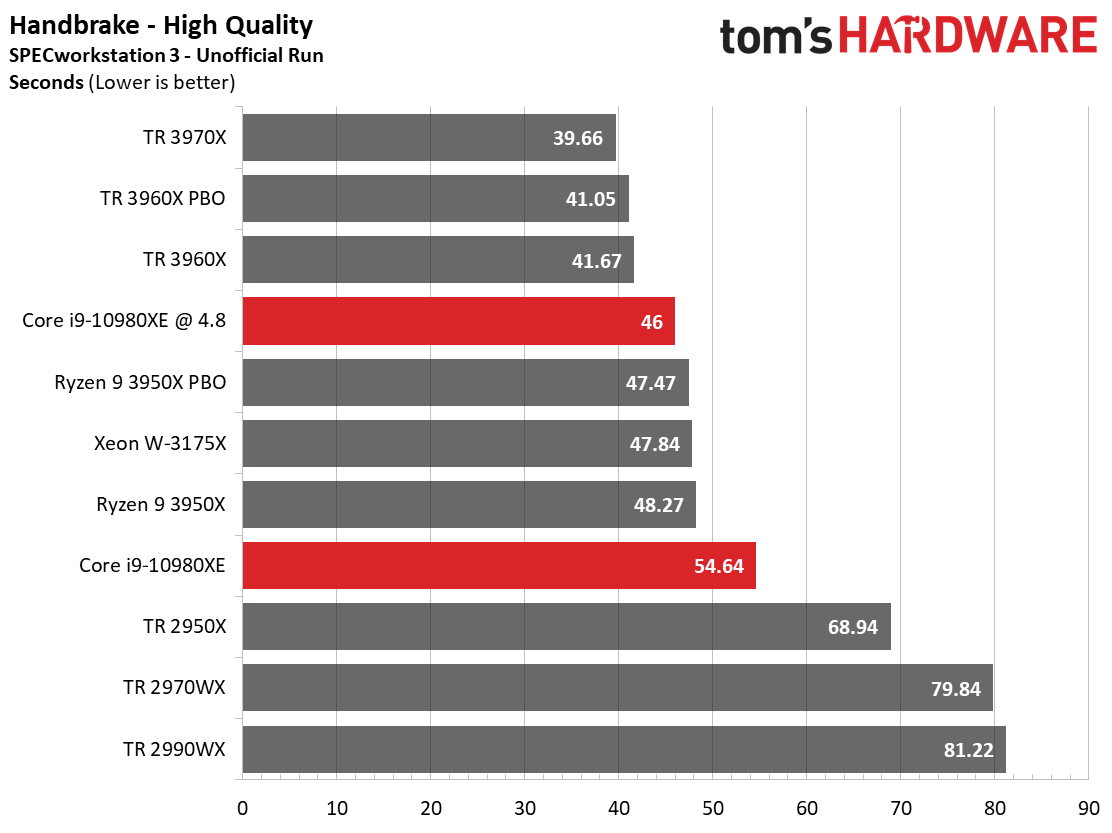
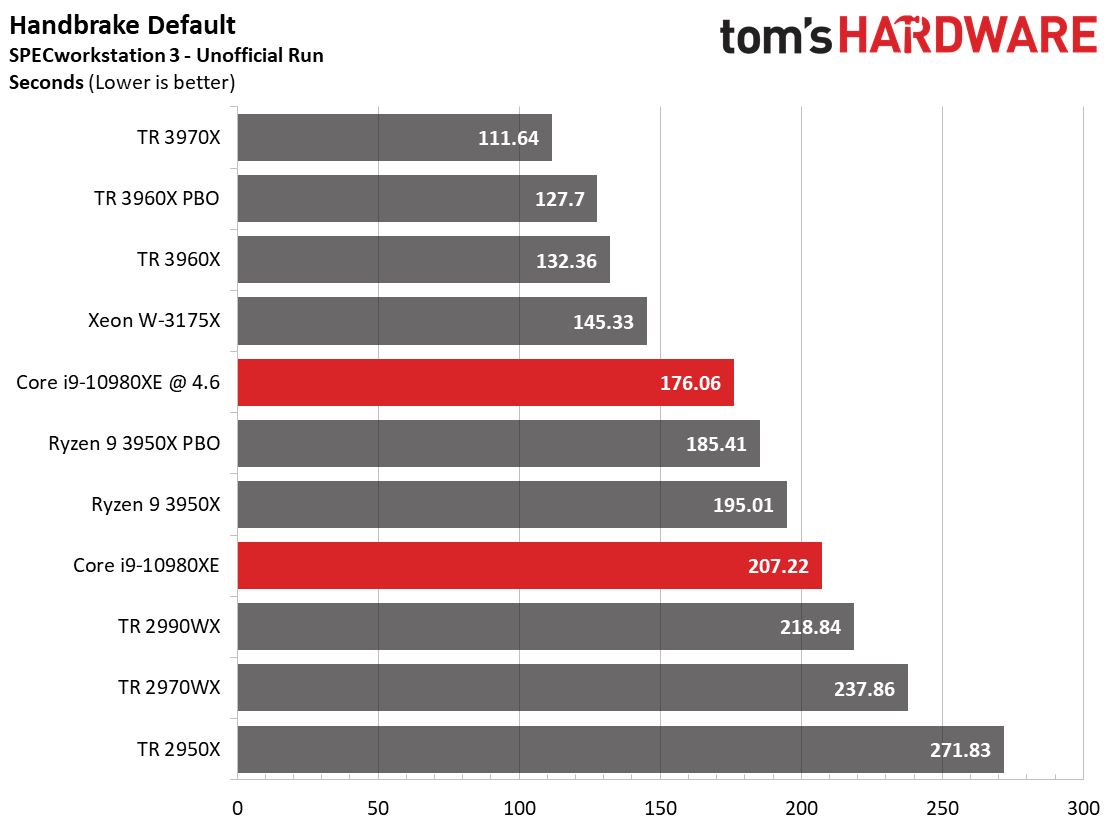
We run the new Blender Benchmark beta in our regular suite of tests on the following page, but different types of render jobs can stress processors in unique ways. Here we can see a breakout of several industry-standard benchmark renders that largely favor the Zen 2 architecture.
The Ryzen 9 3950X is incredibly potent in the Blender and Handbrake benchmarks, leading the -stock -10980XE in the majority of the tests. Meanwhile, the 2970WX isn't as competitive with its price bracket, especially when you consider the 3950X's lower platform costs. Overclocking flips the script in favor of Intel's Core i9-10980XE, but but that gain requires a more expensive platform and cooler, not to mention populating a quad-channel memory controller. However, the seconds measured in these tests can turn to hours for prolific users, so gearing the purchasing decision towards your workload is critical.
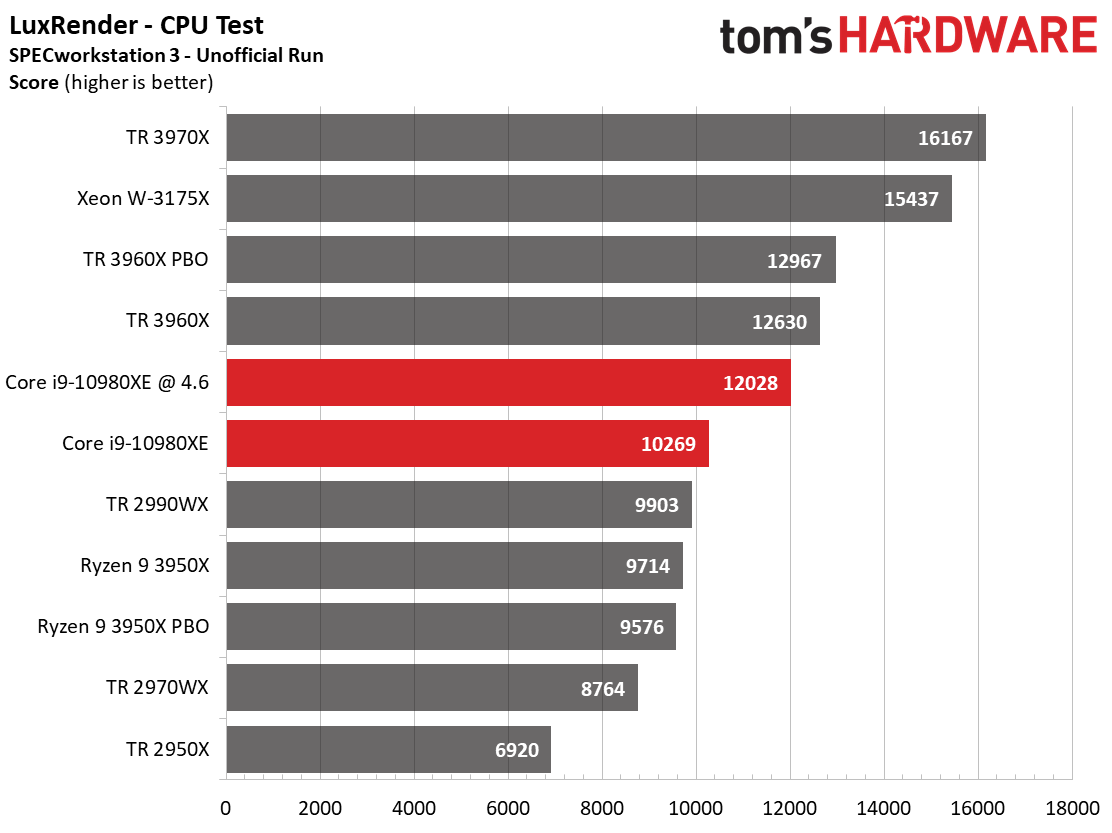
The LuxRender benchmarks favor the -10980XE at both stock and overclocked settings.
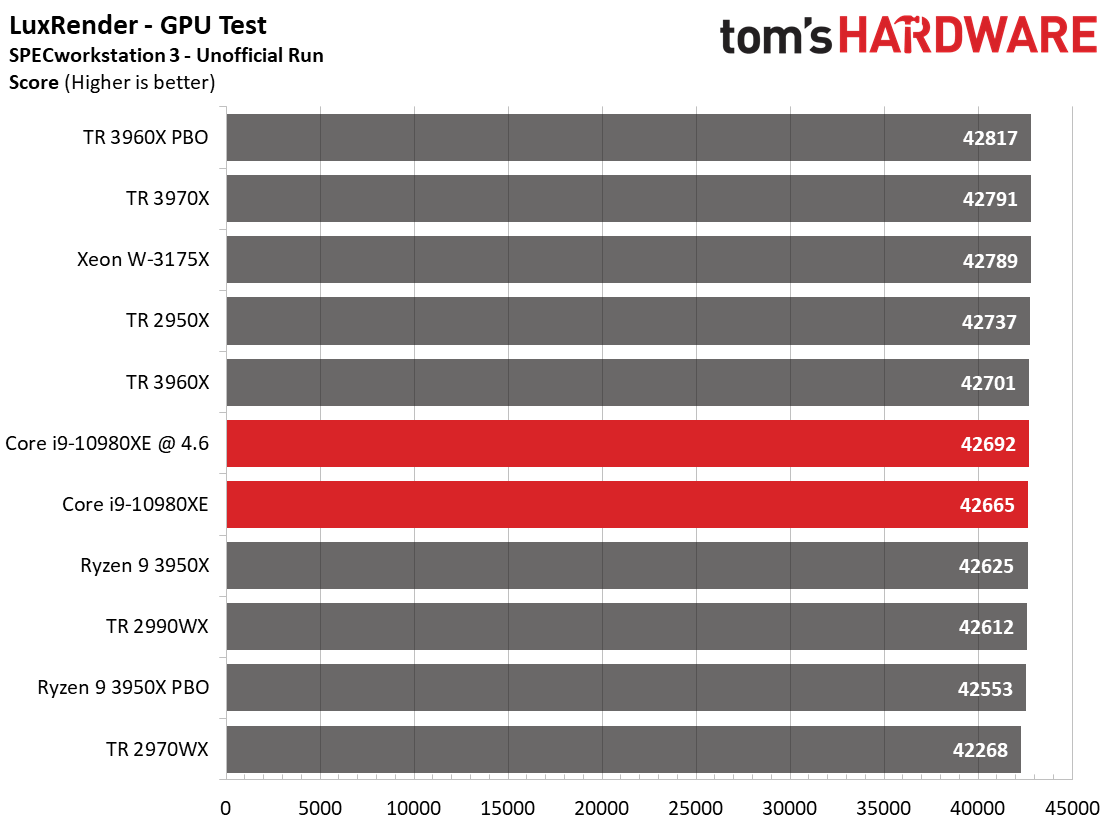
More workloads are leveraging the massive computational power of GPUs to accelerate key portions of parallelized workloads. The LuxRender GPU test shows us that all of the processors in our test pool offer similar performance with the task offloaded to the GPU (the slim variances in run-to-run performance are expected).
NAMD and Rodinia LifeSciences
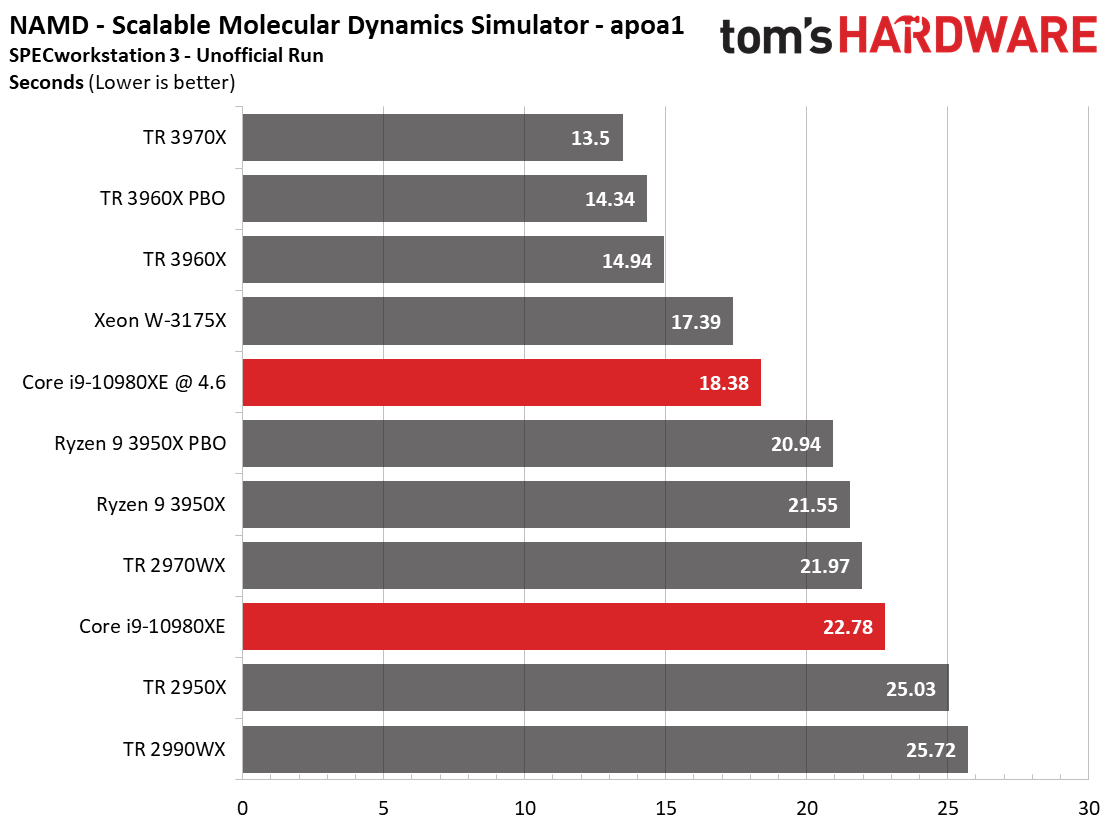
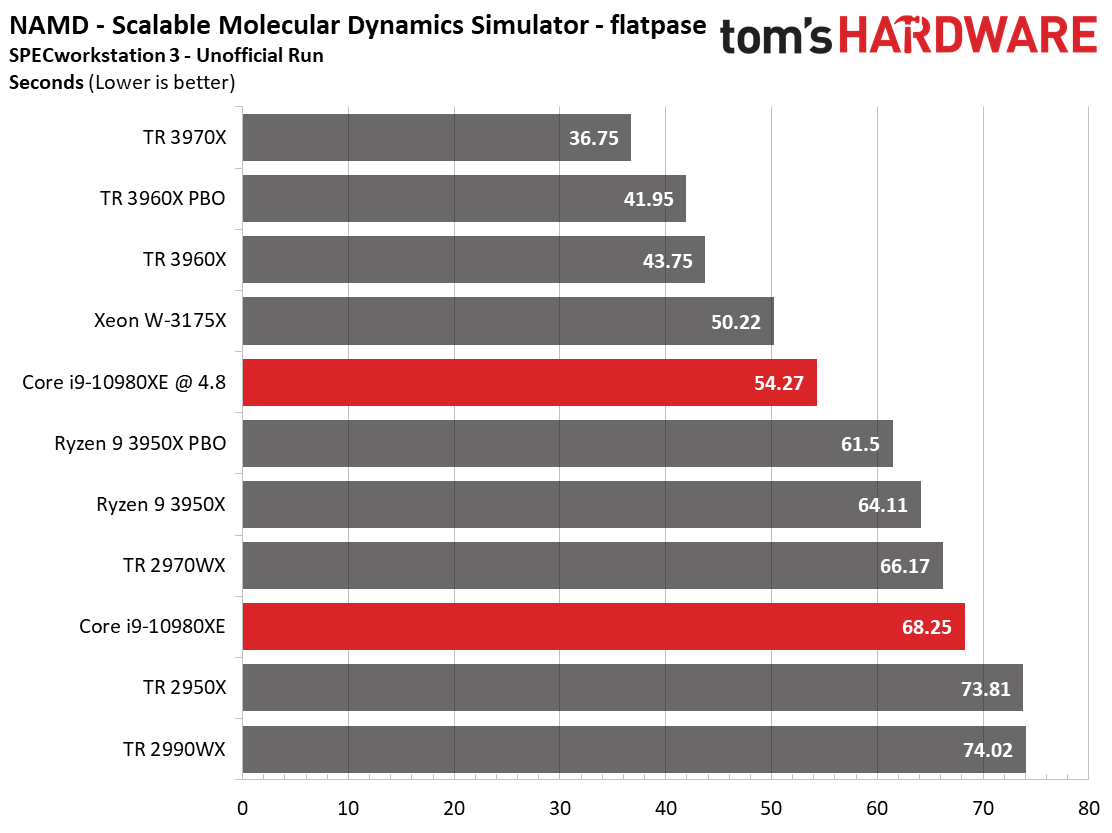
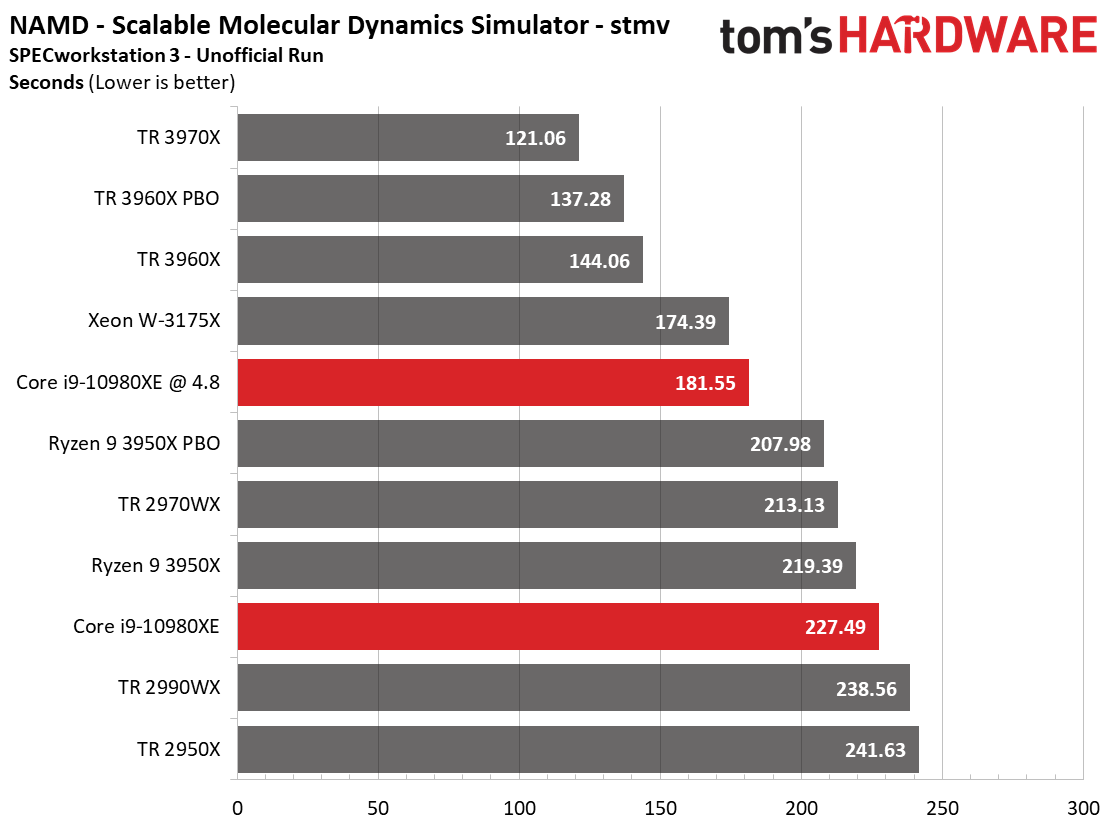
NAMD is a parallel molecular dynamics code designed to scale well with additional compute resources, and again the Ryzen 9 3950X pulls ahead of the -10980XE at stock settings, but trails after overclocking.
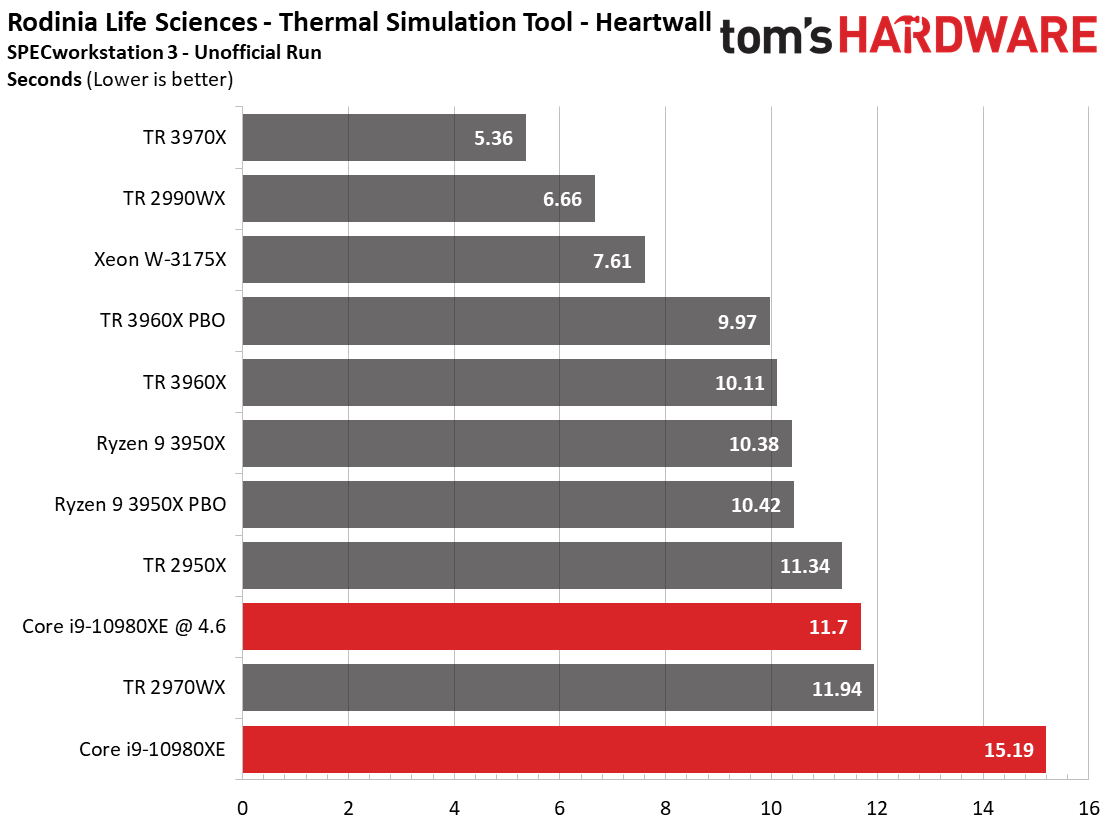
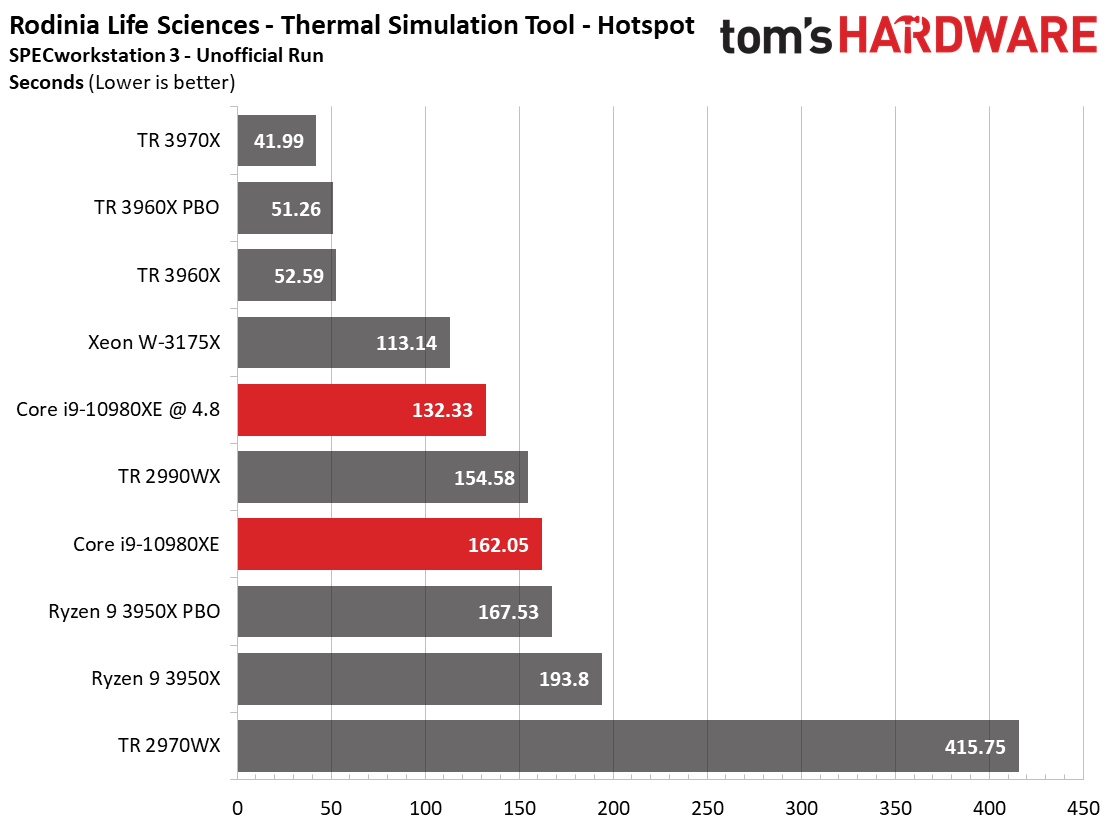
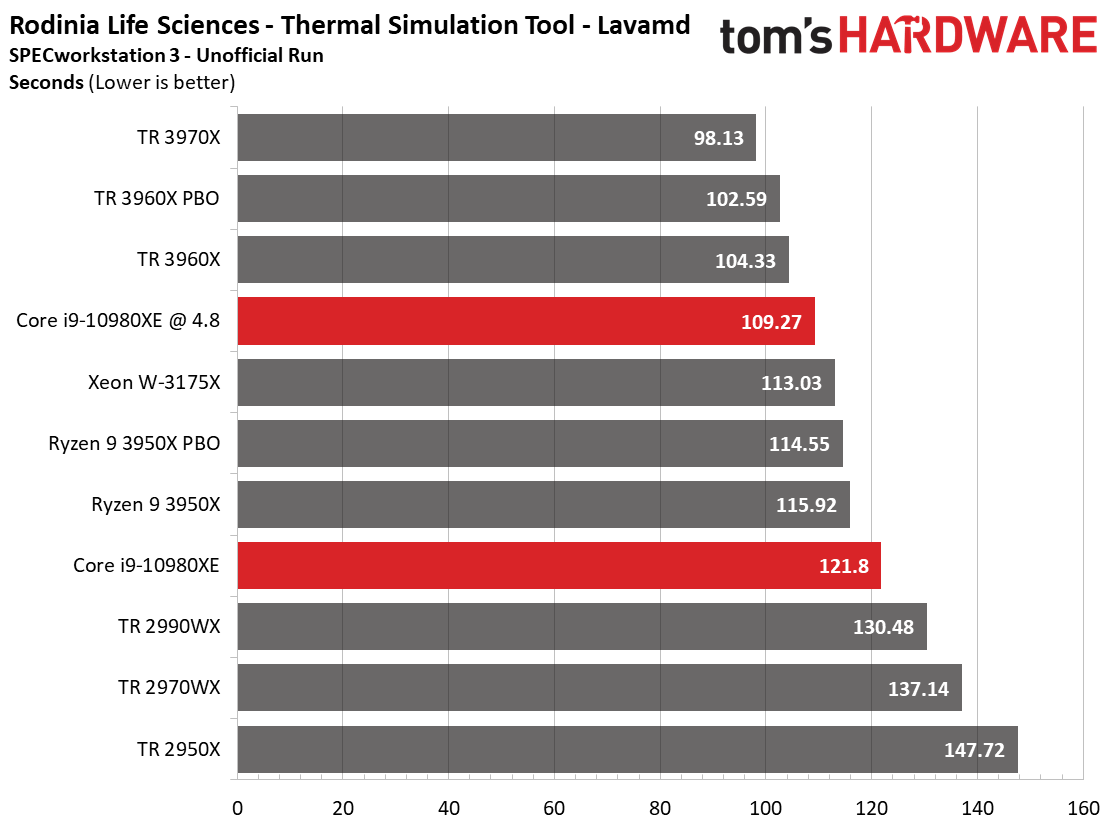
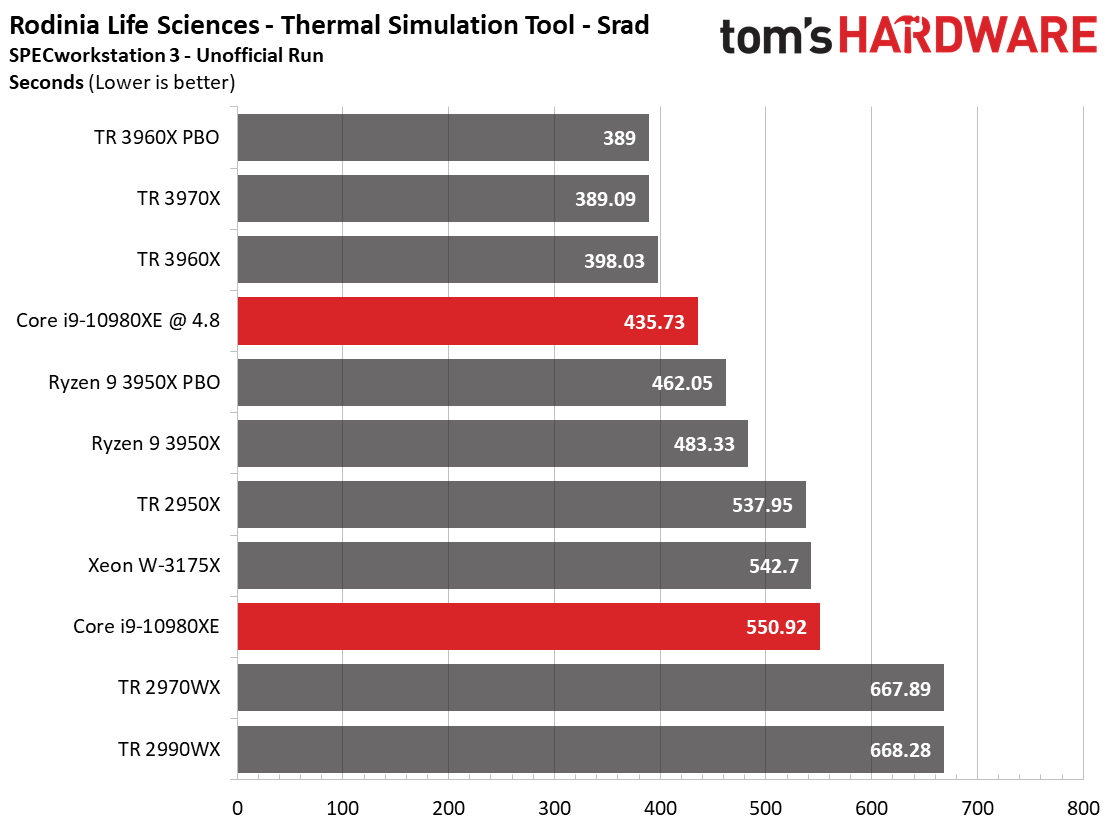
SPECworkstation 3's Rodinia LifeSciences benchmark steps through four tests that include medical imaging, particle movements in a 3D space, a thermal simulation, and image-enhancing programs. The -10980XE inexplicably suffers in the heartwall simulation benchmark, but proves to be more competitive in the other Rodinia tests, indicating this may be another workload that doesn't 'mesh' well with Intel's mesh architecture.
Product Development and Energy
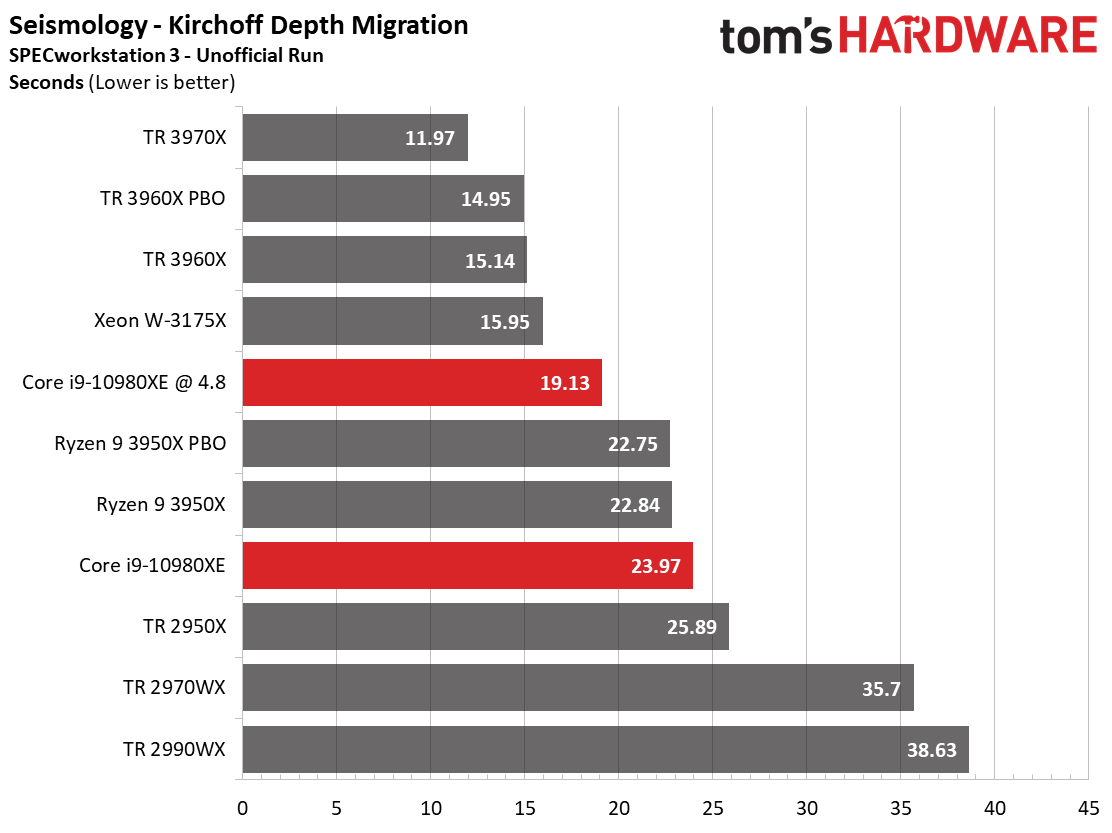
The earth’s subsurface structure can be determined via seismic processing. One of the four basic steps in this process is the Kirchhoff Migration, which is used to generate an image based on the available data using mathematical operations. The same trend emerges: The -10980XE trails the 3950X at stock settings, but benefits from tuning.
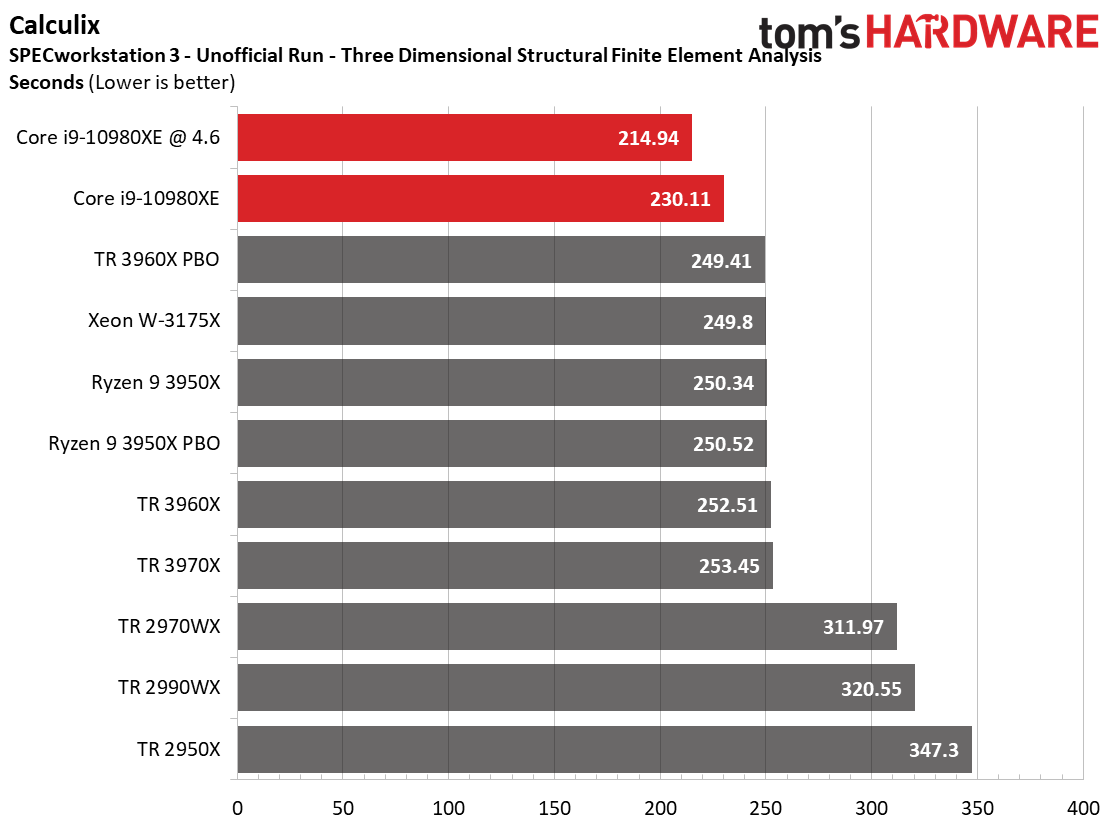
Calculix is based on the finite element method for three-dimensional structural computations. This benchmark performs well on the Intel processors, with the -10980XE being particularly impressive. Again, the Ryzen 9 3950X pops delivers surprisingly strong performance, but doesn't benefit much from overclocking.
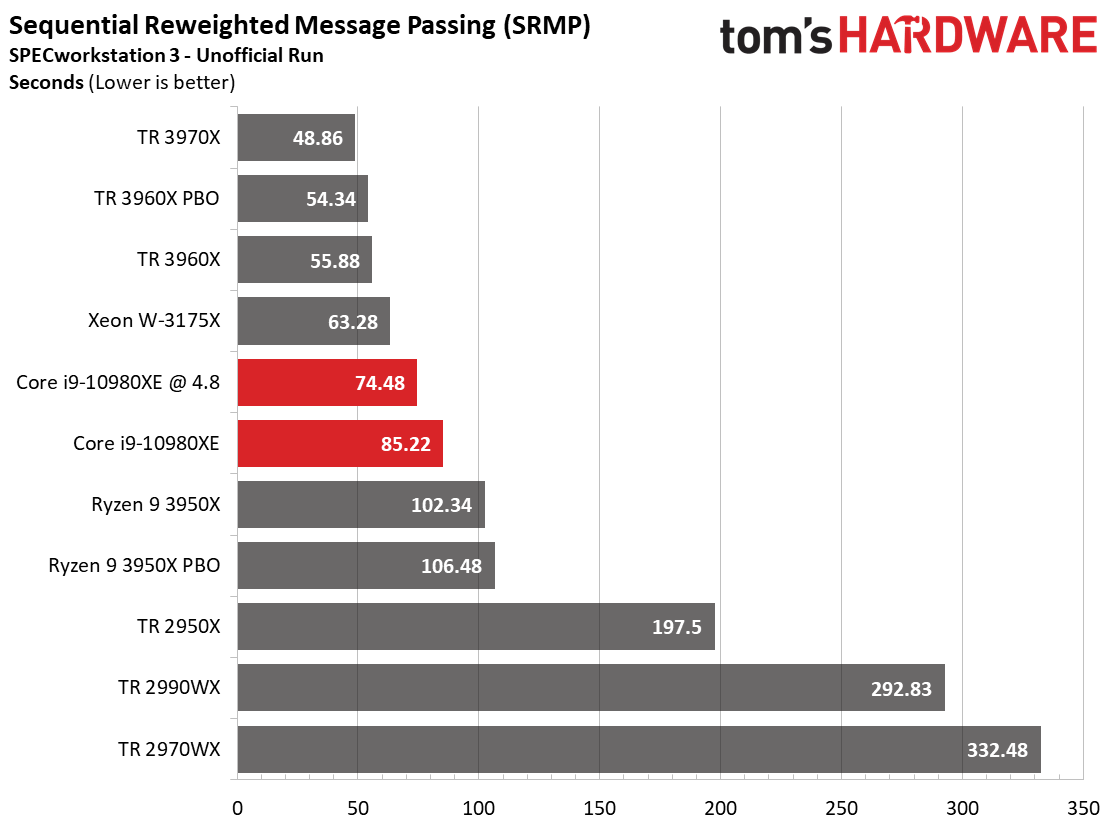
SRMP algorithms are used for discrete energy minimization. The -10980XE wins this benchmark in convincing fashion, while the 2970WX suffers at the hands of its distributed memory architecture.
Financial and General Workloads
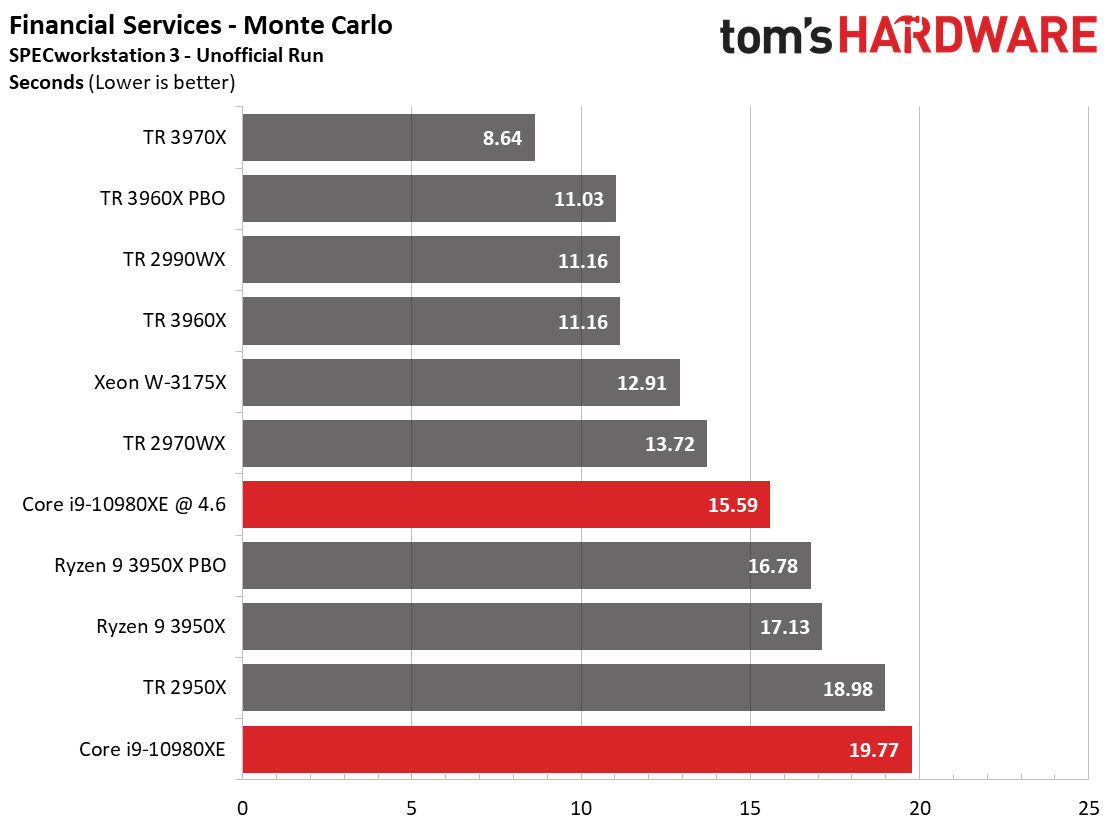
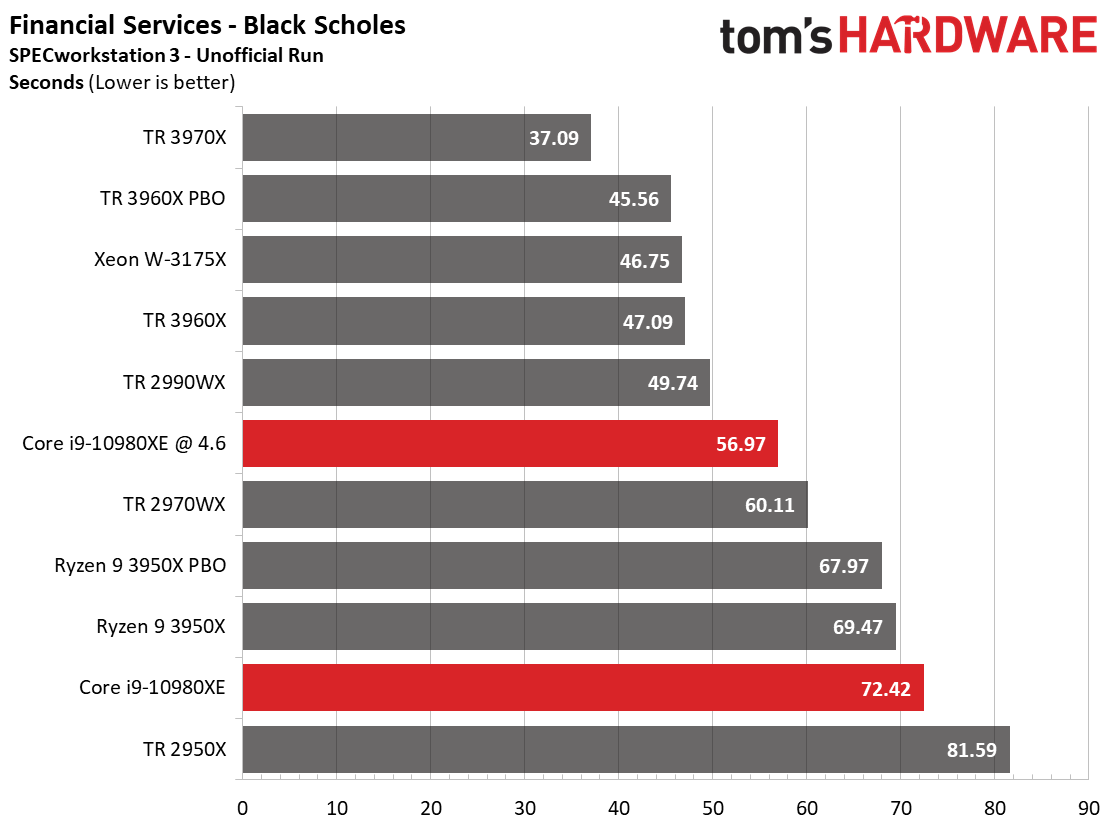
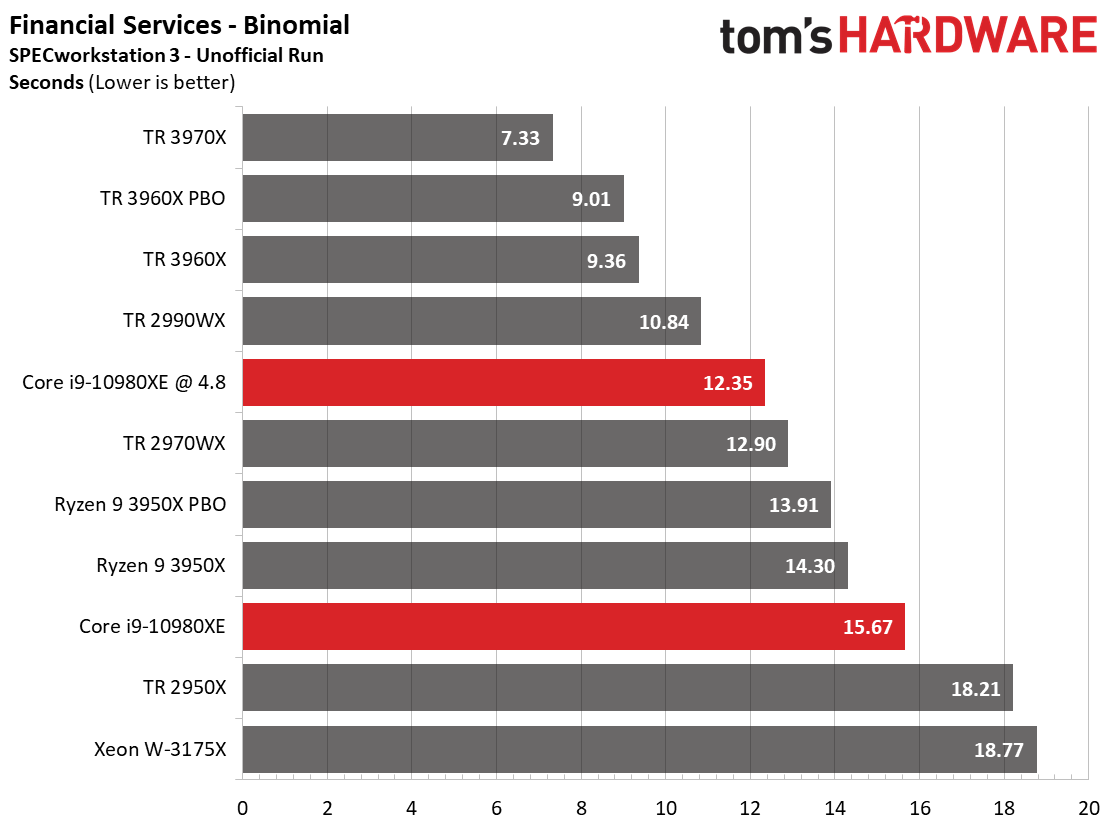
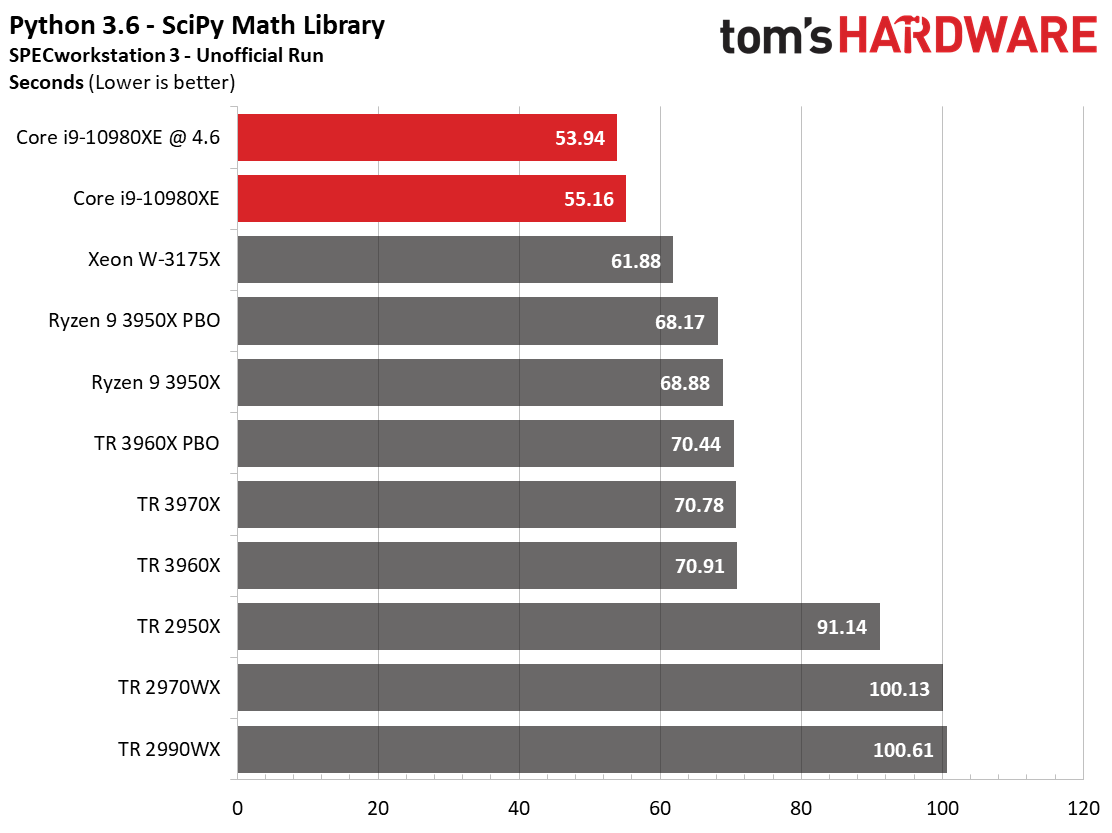
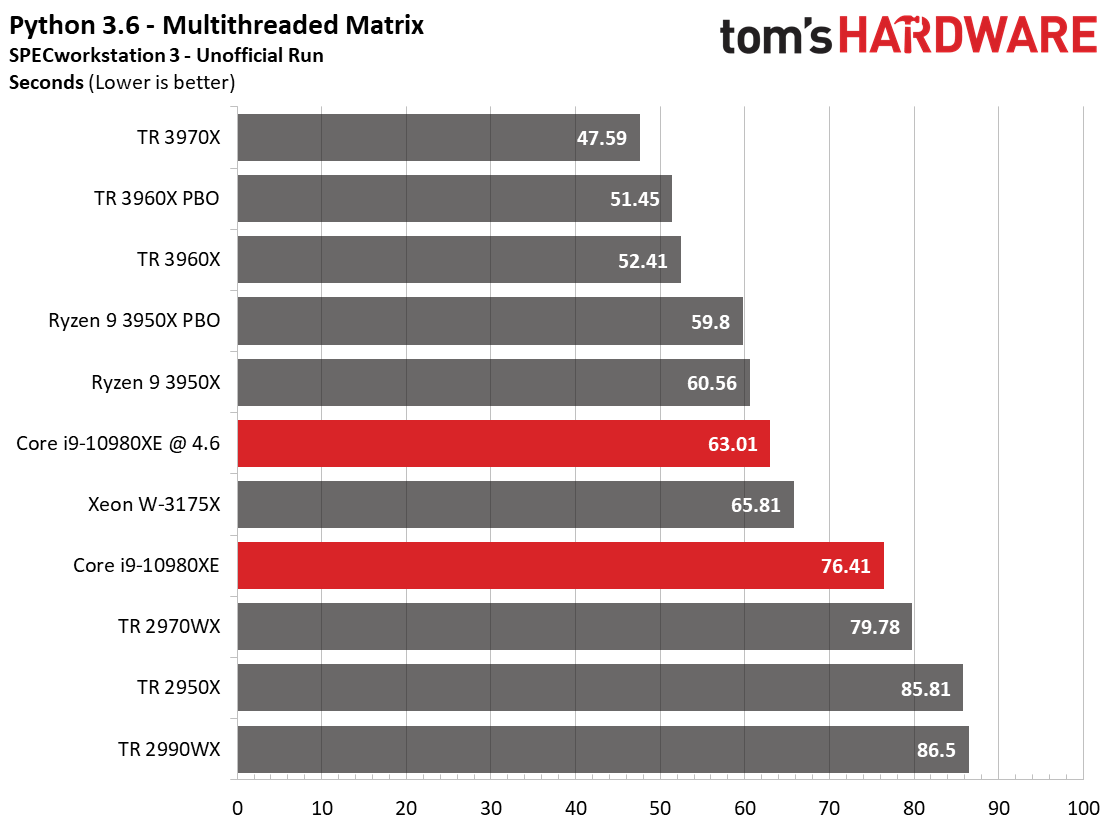
The Monte Carlo simulation is used to project risk and uncertainty in financial forecasting models. Intel's finest trails the test pool at stock settings, once again falling to the mighty 3950X. It even trails the 2970WX in these tests.
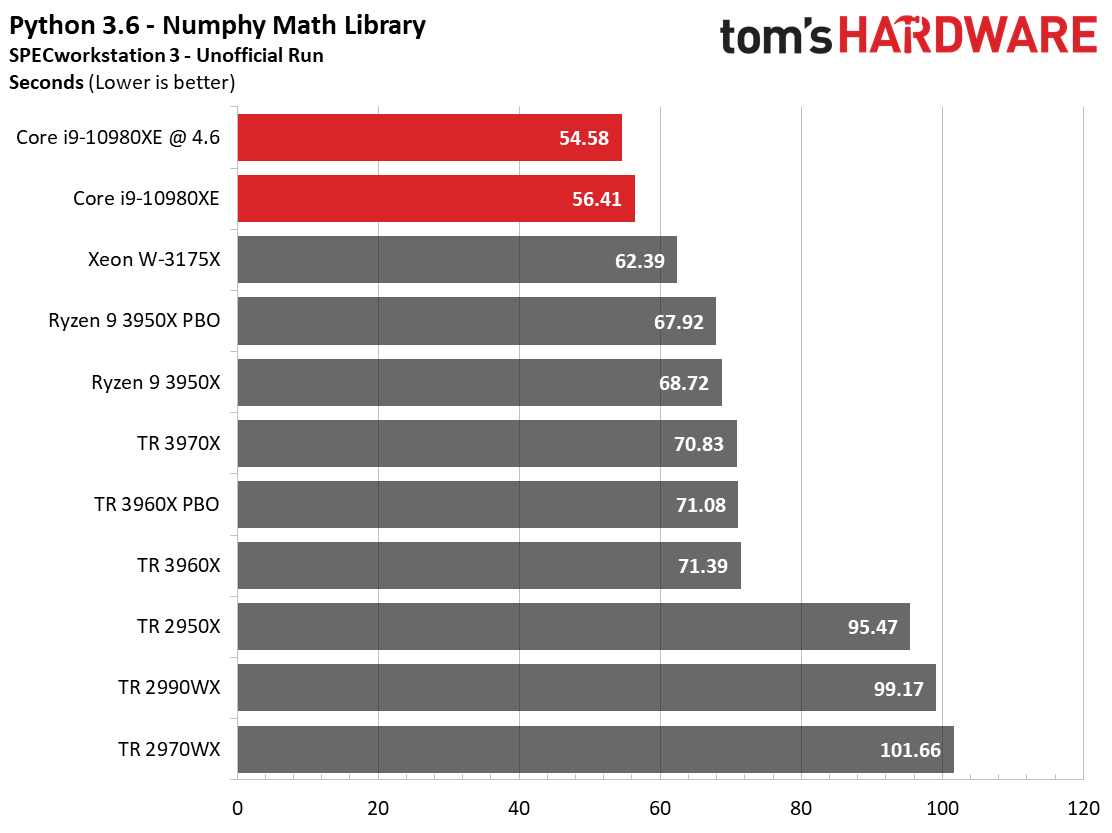
The Python benchmark conducts a series of math operations, including numpy and scipy math libraries, with Python 3.6. This test also includes multithreaded matrix tests that would obviously benefit from more cores, provided the software can utilize the host processing resources correctly. Naturally, the multithreaded matrix workload favors Threadripper 3000, but the Intel processors dominate the numpy and scipy tests. This is due to their compilation in Intel's MKL library, but alternative libraries would improve AMD's standing.
MORE: Best CPUs
MORE: Intel & AMD Processor Hierarchy
MORE: All CPUs Content
Current page: Core i9-10980XE SPEC Workstation and Adobe Performance
Prev Page Core i9-10980XE Gaming Next Page Core i9-10980XE Application Performance
Paul Alcorn is the Editor-in-Chief for Tom's Hardware US. He also writes news and reviews on CPUs, storage, and enterprise hardware.
-
Ful4n1t0c0sme Games benchmarks on a non gamer CPU. There is no sense. Please do compiling benchmarks and other stuff that make sense.Reply
And please stop using Windows to do that. -
Pat Flynn ReplyFul4n1t0c0sme said:Games benchmarks on a non gamer CPU. There is no sense. Please do compiling benchmarks and other stuff that make sense.
And please stop using Windows to do that.
While I agree that some Linux/Unix benchmarks should be present, the inclusion of gaming benchmarks helps not only pro-sumers, but game developers as well. It'll let them know how the CPU handles certain game engines, and whether or not they should waste tons of money on upgrading their dev teams systems.
Re: I used to build systems for Bioware... -
Paul Alcorn ReplyFul4n1t0c0sme said:Games benchmarks on a non gamer CPU. There is no sense. Please do compiling benchmarks and other stuff that make sense.
And please stop using Windows to do that.
Intel markets these chips at gamers, so we check the goods.
9 game benchmarks
28 workstation-focused benchmarks
40 consumer-class application tests
boost testing
power/thermal testing, including efficiency metrics
overclocking testing/data. I'm happy with that mix. -
Disclaimer: I badly want to dump Intel and go AMD. But are the conditions right?Reply
The AMD 3950X has 16 PCIe lanes, right? So for those of us who have multiple adapters such as RAID cards, USB or SATA port adapters, 10G NICs, etc, HEDT is the only way to go.
Someone once told me "No one in the world needs more than 16PCIe lanes, that's why mainstream CPUs have never gone over 16 lanes". If that were true the HEDT CPUs would not exist.
So we can say the 3950X destroys the Intel HEDT lineup, but only if you don't have anything other than ONE graphics card. As soon as you add other devices, you're blown.
The 3970X is $3199 where I am. That will drop by $100 by 2021.
The power consumption of 280w will cost me an extra $217 per year per PC. There are 3 HEDT PCs, so an extra $651 per year.
AMD: 1 PC @ 280w for 12 hours per day for 365 days at 43c per kilowatt hour = $527.74
Intel: 1 PC @ 165w for 12 hours per day for 365 days at 43c per kilowatt hour = $310.76
My 7900X is overclocked to 4.5GHZ all cores. Can I do that with any AMD HEDT CPU?
In summer the ambient temp here is 38 - 40 degrees Celsius. With a 280mm cooler and 11 case fans my system runs 10 degrees over ambient on idle, so 50c is not uncommon during the afternoons on idle. Put the system under load it easily sits at 80c and is very loud.
With a 280w CPU, how can I cool that? The article says that "Intel still can't deal with heat". Errr... Isn't 280w going to produce more heat than 165w. And isn't 165w much easier to cool? Am I missing something?
I'm going to have to replace motherboard and RAM too. That's another $2000 - $3000. With Intel my current memory will work and a new motherboard will set me back $900.
Like I said, I really want to go AMD, but I think the heat, energy and changeover costs are going to be prohibitive. PCIe4 is a big draw for AMD as it means I don't have to replace again when Intel finally gets with the program, but the other factors I fear are just too overwhelming to make AMD viable at this stage.
Darn it Intel is way cheaper when looked at from this perspective. -
redgarl ReplyFul4n1t0c0sme said:Games benchmarks on a non gamer CPU. There is no sense. Please do compiling benchmarks and other stuff that make sense.
And please stop using Windows to do that.
It's over pal... done, there is not even a single way to look at it the bright way, the 3950x is making the whole Intel HEDT offering a joke.
I would have give this chip a 2 stars, but we know toms and their double standards. The only time they cannot do it is when the data is just plain dead impossible to contest... like Anandtech described, it is a bloodbath.
I don't believe Intel will get back from this anytime soon. -
Paul Alcorn ReplyIceQueen0607 said:<snip>
The AMD 3950X has 16 PCIe lanes, right? So for those of us who have multiple adapters such as RAID cards, USB or SATA port adapters, 10G NICs, etc, HEDT is the only way to go.
<snip>
The article says that "Intel still can't deal with heat".
<snip>
I agree with the first point here, which is why we point out that Intel has an advantage there for users that need the I/O.
On the second point, can you point me to where it says that in the article? I must've missed it. Taken in context, it says that Intel can't deal with the heat of adding more 14nm cores in the same physical package, which is accurate if it wants to maintain a decent clock rate. -
ezst036 I'm surprised nobody caught this from the second paragraph of the article.Reply
Intel's price cuts come as a byproduct of AMD's third-gen Ryzen and Threadripper processors, with the former bringing HEDT-class levels of performance to mainstream 400- and 500-series motherboards, while the latter lineup is so powerful that Intel, for once, doesn't even have a response.
For twice? This is a recall of the olden days of the first-gen slot-A Athlon processors. Now I'm not well-versed in TomsHardware articles circa 1999, but this was not hard to find at all:
Coppermine's architecture is still based on the architecture of Pentium Pro. This architecture won't be good enough to catch up with Athlon. It will be very hard for Intel to get Coppermine to clock frequencies of 700 and above and the P6-architecture may not benefit too much from even higher core clocks anymore. Athlon however is already faster than a Pentium III at the same clock speed, which will hardly change with Coppermine, and Athlon is designed to go way higher than 600 MHz. This design screams for higher clock speeds! AMD is probably for the first time in the very situation that Intel used to enjoy for such a long time. AMD might already be able to supply Athlons at even higher clock rates right now (650 MHz is currently the fastest Athlon), but there is no reason to do so.
https://www.tomshardware.com/reviews/athlon-processor,121-16.html
Intel didn't have a response back then either. -
bigpinkdragon286 Reply
TDP is the wrong way to directly compare an Intel CPU with an AMD CPU. Neither vendor measures TDP in the same fashion so you should not compare them directly. On the most recent platforms, per watt consumed, you get more work done on the new AMD platform, plus most users don't have their chips running at max power 24/7, so why would you calculate your power usage against TDP even if it were comparable across brands?IceQueen0607 said:Disclaimer: I badly want to dump Intel and go AMD. But are the conditions right?
The AMD 3950X has 16 PCIe lanes, right? So for those of us who have multiple adapters such as RAID cards, USB or SATA port adapters, 10G NICs, etc, HEDT is the only way to go.
Someone once told me "No one in the world needs more than 16PCIe lanes, that's why mainstream CPUs have never gone over 16 lanes". If that were true the HEDT CPUs would not exist.
So we can say the 3950X destroys the Intel HEDT lineup, but only if you don't have anything other than ONE graphics card. As soon as you add other devices, you're blown.
The 3970X is $3199 where I am. That will drop by $100 by 2021.
The power consumption of 280w will cost me an extra $217 per year per PC. There are 3 HEDT PCs, so an extra $651 per year.
AMD: 1 PC @ 280w for 12 hours per day for 365 days at 43c per kilowatt hour = $527.74
Intel: 1 PC @ 165w for 12 hours per day for 365 days at 43c per kilowatt hour = $310.76
My 7900X is overclocked to 4.5GHZ all cores. Can I do that with any AMD HEDT CPU?
In summer the ambient temp here is 38 - 40 degrees Celsius. With a 280mm cooler and 11 case fans my system runs 10 degrees over ambient on idle, so 50c is not uncommon during the afternoons on idle. Put the system under load it easily sits at 80c and is very loud.
With a 280w CPU, how can I cool that? The article says that "Intel still can't deal with heat". Errr... Isn't 280w going to produce more heat than 165w. And isn't 165w much easier to cool? Am I missing something?
I'm going to have to replace motherboard and RAM too. That's another $2000 - $3000. With Intel my current memory will work and a new motherboard will set me back $900.
Like I said, I really want to go AMD, but I think the heat, energy and changeover costs are going to be prohibitive. PCIe4 is a big draw for AMD as it means I don't have to replace again when Intel finally gets with the program, but the other factors I fear are just too overwhelming to make AMD viable at this stage.
Darn it Intel is way cheaper when looked at from this perspective.
Also, your need to have all of your cores clocked to a particular, arbitrarily chosen speed is a less than ideal metric to use if speed is not directly correlated to completed work, which after all is essentially what we want from a CPU.
If you really need to get so much work done that your CPU runs at it's highest power usage perpetually, the higher cost of the power consumption is hardly going to be your biggest concern.
How about idle and average power consumption, or completed work per watt, or even overall completed work in a given time-frame, which make a better case about AMD's current level of competitiveness. -
Crashman Reply
Fun times. The Tualatin was based on Coppermine and went to 1.4 GHz, outclassing Williamette at 1.8GHz by a wide margin. Northwood came out and beat it, but at the same time Intel was developing Pentium M based on...guess what? Tualatin.ezst036 said:I'm surprised nobody caught this from the second paragraph of the article.
Intel's price cuts come as a byproduct of AMD's third-gen Ryzen and Threadripper processors, with the former bringing HEDT-class levels of performance to mainstream 400- and 500-series motherboards, while the latter lineup is so powerful that Intel, for once, doesn't even have a response.
For twice? This is a recall of the olden days of the first-gen slot-A Athlon processors. Now I'm not well-versed in TomsHardware articles circa 1999, but this was not hard to find at all:
Coppermine's architecture is still based on the architecture of Pentium Pro. This architecture won't be good enough to catch up with Athlon. It will be very hard for Intel to get Coppermine to clock frequencies of 700 and above and the P6-architecture may not benefit too much from even higher core clocks anymore. Athlon however is already faster than a Pentium III at the same clock speed, which will hardly change with Coppermine, and Athlon is designed to go way higher than 600 MHz. This design screams for higher clock speeds! AMD is probably for the first time in the very situation that Intel used to enjoy for such a long time. AMD might already be able to supply Athlons at even higher clock rates right now (650 MHz is currently the fastest Athlon), but there is no reason to do so.
https://www.tomshardware.com/reviews/athlon-processor,121-16.html
Intel didn't have a response back then either.
And then Core came out of Pentium M, etc etc etc and it wasn't long before AMD couldn't keep up.
Ten years we waited for AMD to settle the score, and it's our time to enjoy their time in the sun. -
ReplyPaulAlcorn said:I agree with the first point here, which is why we point out that Intel has an advantage there for users that need the I/O.
On the second point, can you point me to where it says that in the article? I must've missed it. Taken in context, it says that Intel can't deal with the heat of adding more 14nm cores in the same physical package, which is accurate if it wants to maintain a decent clock rate.
yes, sorry, my interpretation was not worded accurately.
Intel simply doesn't have room to add more cores, let alone deal with the increased heat, within the same package.
My point was that Intel is still going to be easier to cool producing only 165w vs AMD's 280w.
How do you calculate the watts, or heat for an overclocked CPU? I'm assuming the Intel is still more over-clockable than the AMD, so given the 10980XE's base clock of 3.00ghz, I wonder if I could still overclock it over 4.00ghz. How much heat would it produce then compared to the AMD?
Not that I can afford to spend $6000 to upgrade to the 3970X or $5000 to upgrade to the 3960X... And the 3950X is out because of PCIe lane limitations.
It looks like I'm stuck with Intel, unless I save my coins to go AMD. Makes me sick to the pit of my stomach :)