
Why you can trust Tom's Hardware Our expert reviewers spend hours testing and comparing products and services so you can choose the best for you. Find out more about how we test.
Core i9-10980XE Boost Frequency
We ran a few tests to measure the Core i9-10980XE's ability to hit its rated boost speeds. Intel targets the fastest cores, in this case four of them, with lightly-threaded workloads with its Turbo Boost Max 3.0 feature. However, the frequency for the second two fastest cores drops 100 MHz from the listed Turbo Boost Max 3.0 frequency. Intel pioneered this technique for the desktop, but AMD has also adopted the tactic to extract more performance from its third-gen Ryzen chips.


We begin by recording the frequencies of each core during a series of commonly-used tests that should expose the peak frequencies. The first two tests are LAME and Cinebench in single-core test mode. These programs only execute on one core of the processor, which typically allows the chip to reach its peak boost frequency within its power, current, and thermal envelope. We also used tests with intermittent "bursty" workloads: PCMark 10, Geekbench, and VRMark run in rapid succession after the first two tests.
The album above only includes the maximum and minimum frequencies recorded during each 1-second measurement interval (100ms sampling). That means these measurements could come from any one core, but it makes the charts easier to digest. We've also plotted chip temperature on the right axis (the dark red line).
As you can see, both chips can hit their rated turbo frequencies rather easily, and frequently, with the Core i9-10980XE offering a 300MHz improvement over the previous-gen -9980XE in single-threaded work. We also noticed the impact of the expanded four-core Turbo Boost Max 3.0 as more cores engage in boost activity during lightly-threaded workloads.
Core i9-10980XE Overclocking
Overclocking still remains a key Intel advantage in the face of AMD's brutally-powerful Zen 2 processors. Intel's chips have far higher overclocking headroom and are realtively easy to tune manually, and deliver a much larger performance improvement than we see with AMD procesors. However, you'll need beefy cooling to wring out peak overclocking performance from the -10980XE, but it generally offers much higher overclocking headroom than the -9980XE.
We used our go-to Corsair H115i cooler for stock testing, but switched over to a custom loop with two 360mm radiators for overclocking. The -10980XE allows you to adjust bins for three types of instructions: IA/SSE, AVX2, and AVX-512.
| All-core Ratios (GHz) | IA/SSE | AVX2 | AVX-512 |
| i9-10980XE stock | 3.8 | 3.3 | 2.8 |
| 19-10980XE Overclocked | 4.8 | 4.0 | 3.3 |
| i9-9980XE Overclocked | 4.4 | 3.3 | 2.8 |
We adjusted the -10980XE turbo ratios to 4.8, 4.0, and 3.3 GHz, respectively. We dialed these in as all-core overclock values, which means we do lose a bit of steam in lightly-threaded AVX-512 workloads that boost up to 3.8GHz on two cores, but you can also assign these values on a per-core basis to recoup those losses. As you can see, our -10980XE sample overclocked far beyond the limits we found with our -9980XE, but your mileage may vary.
Overclocking was a straightforward affair: We bumped memory speeds up to DDR4-3600 and used a 2.1v VCCIN paired with a 1.2V vCore. We also bumped up the mesh multiplier to 32 and increased vMesh to 1.2V, which imparts a nice performance kicker due to better cache latencies. We also uncorked all of the power limits in the BIOS. Temperatures with our custom loop peaked at 80C during AVX2 workloads, but be aware that standard closed-loop coolers will be a limiting factor.
Even with relaxed settings, heat easily overwhelmed our H115i after small voltage increases, and that was with its fans cranking away at maximum speed. Just like the first- and second-gen Skylake-X chips, thermals limited our overclocking efforts before hitting the silicon's limits, despite solder-based TIM. Build your own custom loop if you plan on serious overclocking. Also, we advise forced air or water cooling on the power delivery subsystem. Invest in a PSU able to deliver at least 20A on the +12V rail. MSI’s BIOS warns that you need a power supply capable of providing up to 1000W through the eight-pin EPS cable; a beefy PSU is non-negotiable.
Our overclocking technique for AMD's 3000-series processors is drastically different. These chips offer improved single-threaded performance, but you'll lose that benefit if you manually overclock. That's because the 7nm chips can't be manually overclocked on all cores to reach the same frequency as the single-core boost frequency. In fact, the all-core overclock ceiling is often 200 to 300 MHz lower than the single-core boost speeds, which is likely due to AMD’s new binning strategy that finds the Ryzen 3000 chips with a mix of both faster and slower cores.
We turned to AMD's auto-overclocking Precision Boost Overdrive feature for our battery of tests. This auto-overclocking algorithm preserves the benefits of the single core boost, as seen in our boost testing above, while speeding up threaded workloads. We paired our PBO-enabled configurations with our custom watercooling loop and a Phanteks full-coverage Glacier C399A TR4 wateblock, enabling the utmost performance possible with our available cooling solutions. As with all Zen 2-based chips, PBO performance will vary based upon your cooling solution, motherboard, and firmware.
Core i9-10980XE Power Consumption
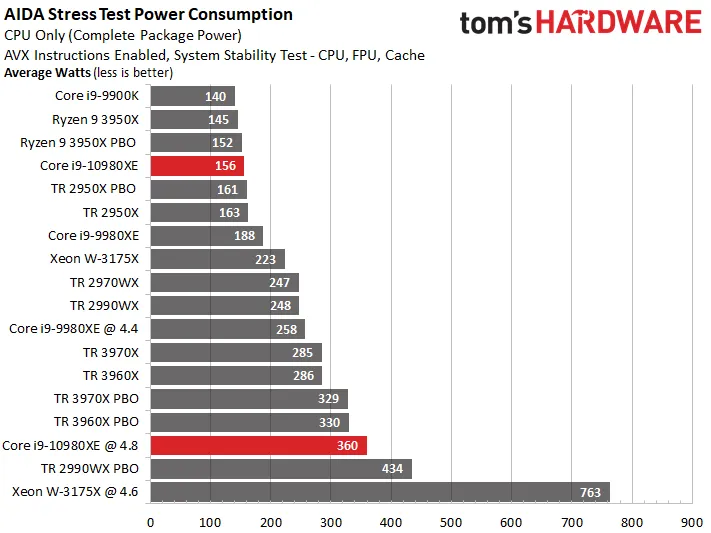


Sometimes we encounter results that simply seem to good to be true, and that is exactly what transpired with the -10980XE's power measurements. We retested both the -10980XE and -9980XE on multiple motherboards to verify the power consumption deltas, and while they vary based on motherboard, there is no doubt the -10980XE is significantly more power efficient. We also used Intel's XTU to monitor both chips during stress testing and noticed that the -9980XE encountered current/EDP limit throttling much more frequently than the -10980XE during extended AVX workloads, indicating that motherboard vendors have a bit more budget to play with on the Cascade Lake-X chip. This could be due to refinements Intel has made to power thresholds, but most of the secret sauce behind these power reductions are hidden in the lines of BIOS code.
In either case, the -9980XE draws ~20% more power than the -10980XE with both SSE and AVX2 instructions. We also measured peak AVX-512 power draw (not in the charts) at 149W for the -10980XE and 162W for the -9980XE, an 8% increase for the older chip. Normally we would expect these kind of power enhancements to stem from a newer, small process, but Intel has definitely mastered its 14nm, which you would expect after five long years and countless revisions.
However, those large deltas in stress tests don't always carry over to all real world workloads. The -9980XE only drew 2W less than the -10980XE during the y-cruncher workload, though it is noteworthy that the latter was ~9% faster during the test, indicating that it is more efficient. Power efficiency gains will definitely vary based upon workload.
Flipping over to the AVX-enabled HandBrake tests finds the -10980XE drawing 16 fewer watts in the x265 workload, which has a heavier distribution of AVX instructions than the x264 test. In x264, the -10980Xe drew 14 fewer watts.
At idle, the -10980XE measured 26.5W, compared to the -9980XE's 28.8W.
These improvements are impressive, but a glance at the Ryzen 9 3950X reveals the power efficiency of the new 7nm process, albeit paired with a 12nm I/O die. When we compare that chip to the -10980XE in the final two charts, which calculate power efficiency based on performance, the 3950X tops the chart for the Handbrake tests. The -10980XE also notches an impressive efficiency gain over the -9980XE in these real-world workloads, but the more we see of the 3950X, the more we like it.
By virtue of its drastically lower price point, the -10980XE doesn't compete directly with the 3970X and 3960X, but it is more power efficient. There is some overhead for AMD's Threadripper chips due to a larger 12nm central I/O die and the Infinity Fabric that it uses to tie together the four chiplets, but they are even more power efficient than the eight-core -9900K with its monolithic die, which is impressive. Also, a glance at the 2990WX and 2970WX in the efficiency charts really highlights the transformational gen-on-gen efficiency improvement.
Test Setup
| AMD Socket sTRX4 (TRX40) | Threadripper 3970X, 3960X |
| Row 1 - Cell 0 | MSI Creator TRX40 |
| Row 2 - Cell 0 | 4x 8GB G.Skill FlareX DDR4-3200 - Stock: DDR4-3200, OC: DDR4-3600 |
| Intel Socket 2066 (X299) | Core i9-10980XE, Core i9-9980XE |
| Row 4 - Cell 0 | MSI Creator X299 |
| Row 5 - Cell 0 | 4x 8GB G.Skill FlareX DDR4-3200 - Stock: DDR4-2933, OC: DDR4-3600 |
| AMD Socket AM4 (X570) | AMD Ryzen 9 3950X |
| MSI MEG X570 Godlike | |
| Row 8 - Cell 0 | 2x 8GB G.Skill FlareX DDR4-3200 - Stock: DDR4-3200, OC: DDR4-3600 |
| Intel LGA 3647 (C621) | Intel Xeon W-3175X |
| Row 10 - Cell 0 | ROG Dominus Extreme |
| Row 11 - Cell 0 | 6x 8GB Corsair Vengeance RGB DDR4-2666 - Stock: DDR4-2666, OC: DDR4-3600 |
| AMD Socket SP3 (TR4) | Threadripper 2990WX, 2970WX |
| Row 13 - Cell 0 | MSI MEG X399 Creation |
| Row 14 - Cell 0 | 2x 8GB G.Skill FlareX DDR4-3200 - Stock: DDR4-2933, OC: DDR4-3466 |
| Intel LGA 1151 (Z390) | Intel Core i9-9900K |
| MSI MEG Z390 Godlike | |
| 2x 8GB G.Skill FlareX DDR4-3200 - Stock: DDR4-2666, OC: DDR4-3600 | |
| All Systems | Nvidia GeForce RTX 2080 Ti |
| 2TB Intel DC4510 SSD | |
| EVGA Supernova 1600 T2, 1600W | |
| Windows 10 Pro (1903 - All Updates) | |
| Cooling | Corsair H115i, Enermax Liqtech 360 TR4 II, Custom Loop |
MORE: Best CPUs
MORE: Intel & AMD Processor Hierarchy
MORE: All CPUs Content
