iXsystems FreeNAS Mini NAS Review
iXsystems' FreeNAS Mini incorporates enterprise features, an advanced file system and a flash cache to deliver superior performance in its price range.
Why you can trust Tom's Hardware
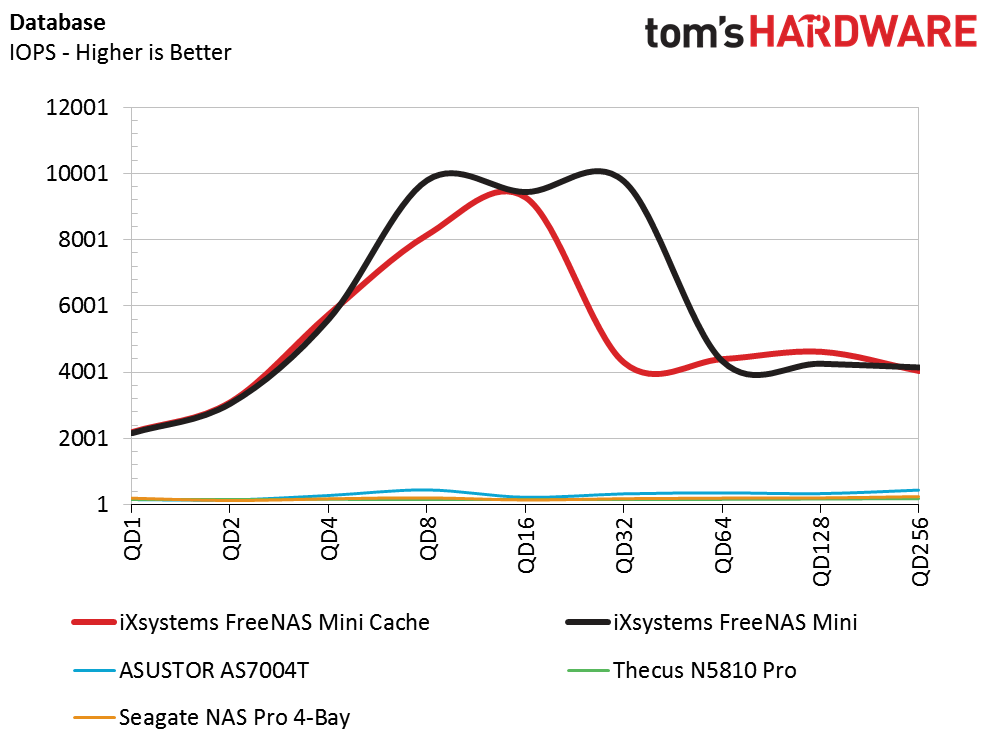
Database Server Workload


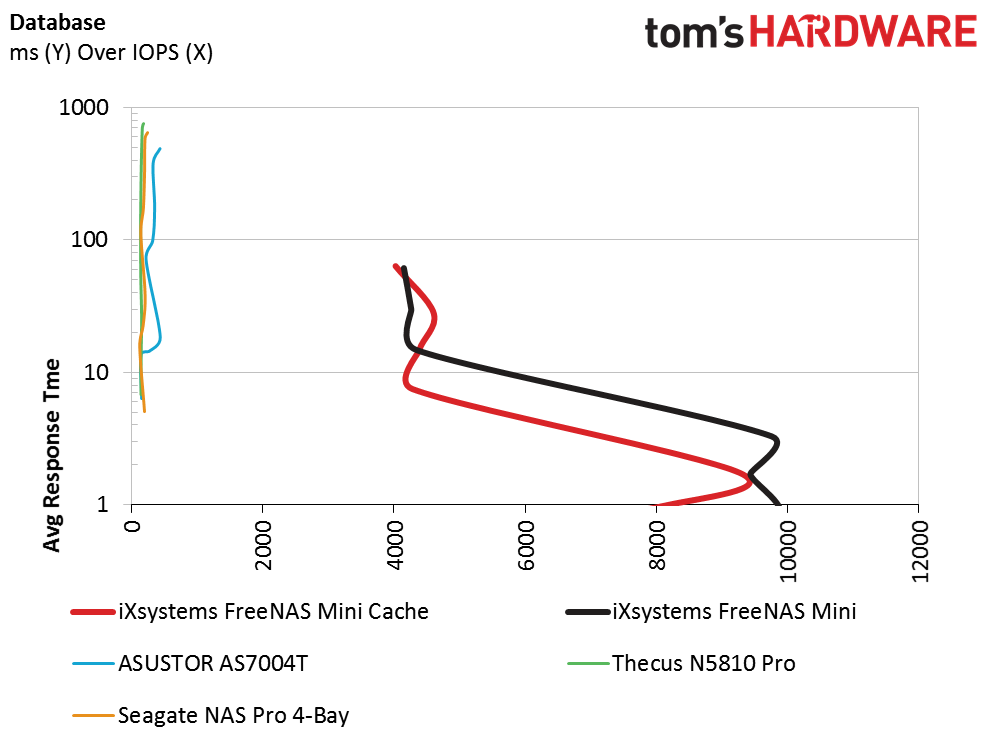
The following workload tests have been around for so long that they're considered industry standards. The way we present the average response times are not. The first line graph shows workload performance with scaling queue depth. The second chart shows average response time correlated to the number of IOPS. In many of these tests, users target a maximum amount of latency. An application may require less than 10 milliseconds of latency, so the system administrator will aim for workloads that stay under the target. The amount of IOPS tells the administrator how much load the system can handle while staying within the response time range.
In order to make the graphs presentable, we had to use a different scale for the response time. The first three sections show the response time to 100ms. The next line shows the scaling to 1000ms, a 10x increase from one line to the next. Without the large scale increase, the FreeNAS Mini barely lifts off of the baseline.
The fact that we had to adjust the scale speaks volumes about the FreeNAS Mini. The system is in another product category with this type of workload and pushed to maximum load.
Get Tom's Hardware's best news and in-depth reviews, straight to your inbox.
Current page: Database Server Workload
Prev Page Single-Client iSCSI Workloads Next Page File Server Workload
Chris Ramseyer was a senior contributing editor for Tom's Hardware. He tested and reviewed consumer storage.
-
Thanks for this review! I've been looking at this NAS for a while, ECC ram and ZFS where two strong points.Reply
-
DarkSable $1000 for a diskless system?Reply
How much is the case itself? That I might be interested in, but... -
hmarafi Thank you, a great review, if you can make a review how these devices can handle transcoding (Plex) Please.Reply -
colinstu Reply$1000 for a diskless system?
How much is the case itself? That I might be interested in, but...
The case is a Supermicro CSE-721TQ-250B which is $160.
A great motherboard would be the X10SDV-F which is $850 (dual GBe Intel nics, Xeon-D 8 core, check Anandtech they did a great review on it). Stronger CPU than the one in this review.
Then for $1017 you can get the X10SDV-TLN4F which includes built in 2x Intel 10GBe as well as 2x Intel GBe.
or for $?? (probably more) the X10SDV-8C-TLN4F which is the same as above but has Hyperthreading (16 threads). -
Lulzon Can someone explain what the market for these are? The form factor and limitations in expansion make it feel consumer level, but the power packed inside and price tag feel more enterprise for small teams or high workloads.Reply -
ammaross Replyutilizes the DRAM as a cache for in-flight data, you'll want to stick with ECC memory to protect that information from corruption.
Just by way of correction, ZFS has memory page checksums in addition to disk block checksums so even a memory bit corruption on non-ECC RAM can be healed on-the-fly. -
James Mason ReplyCan someone explain what the market for these are? The form factor and limitations in expansion make it feel consumer level, but the power packed inside and price tag feel more enterprise for small teams or high workloads.
Smaller businesses. I'm thinking law firms and architectural businesses, that just have a ton of documents and pictures to store. Which would fit right in at between 4-24tbs.
The price still seems kinda high, I'd like to see "real world use" as opposed to benchmarks but that's so difficult to actually do. -
BulkZerker All that processor for a nas... Asrock's avaton board still seems like a better choice IMO. Than again, I'm more looking at max storage vs max speed., esp considering how this nas can and will be set up.Reply -
photonboy Price is very reasonable for small business assuming someone with enough tech knowledge to setup properly.Reply
If the price seems high then it's not for you, but as said this is not a consumer product for home users. You want a basic, easy solution then investigate some of the WDMYCLOUD options instead. I bought a 4TB model and added a 4TB WD Elements as backup but that's for video storage and not as reliable nor as fast as a business class solution.
$2000 with drives for business is really not bad considering the cost to run a business, loss of data costs, and the fact you can probably write of some as a business expense. -
Mike Bethany FreeNAS with ZFS is a fantastic combination but the FreeNAS Mini needs one more drive for the RAID.Reply
On a side note, some guy vehemently argued against using ECC memory with ZFS. He admitted it was really stupid to *not* using ECC memory but he just couldn't admit he was wrong so he kept doubling down on dumb. His major argument? I was a few dollars off on the price of ECC memory.
You have to love the Internet.