Nvidia Shield Review: Tegra 4-Powered Handheld Gaming
We've been playing with Nvidia's Shield handheld for more than a month, but only recently got access to its killer feature: streaming PC game content. Does Nvidia's foray into the hardware world deserve your $300, or is this expensive toy impractical?
Results: Shield And Tegra 4 Platform
A device like Shield interests me for two reasons. First, there’s the product itself—the quality of its Tegra-optimized games, its ability to sustain a smooth experience while streaming PC content, how hot it gets, how long its battery lasts, and so on. Then there’s the fact that this is the first Tegra 4-based device in our lab.
So, we have two types of benchmark results to present today: those that measure Shield’s performance relative to other tablets and phones, and those that compare Tegra 4 to competing SoCs. Each step of the way I’ll do my best to explain what the results mean and why they’re significant. Let’s start with the platform-oriented tests, then.
MobileXPRT
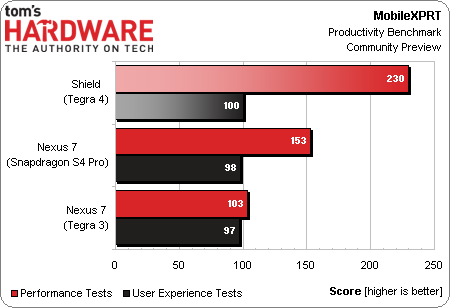
MobileXPRT, from the folks at Principled Technologies, consists of two test categories: performance and user experience.
The performance suite has five tests, applying photo effects, creating photo collages, creating slideshows, encrypting content, and detecting faces. Results are measured in seconds, and the overall score is generated by taking a geometric mean of the ratio between a calibrated machine (Motorola’s Droid Razr M) and each platform for the five tests.
The outcome isn’t even close. Shield significantly outperforms the Tegra 3 in Google’s previous-gen Nexus 7 and the newer model’s Qualcomm APQ8064. Of course, the two tablets never stood a chance. Terga 4 enjoys a big, thick form factor and active cooling. If this SoC makes it into a tablet, it won’t get those same advantages.
MobileXPRT’s UX suite attempts to quantify smoothness by measuring the frame-per-second performance of scrolling through a list view, a grid of icons/text, flicking through a photo gallery, browsing a webpage, and zooming in and out of a photo. Again, we’re looking at the geomean of five ratios.
Get Tom's Hardware's best news and in-depth reviews, straight to your inbox.
Nvidia’s Shield turns in the best score. But as you might expect, there isn’t a ton of difference between the perceived smoothness of mobile devices armed with modern SoCs.
Geekbench
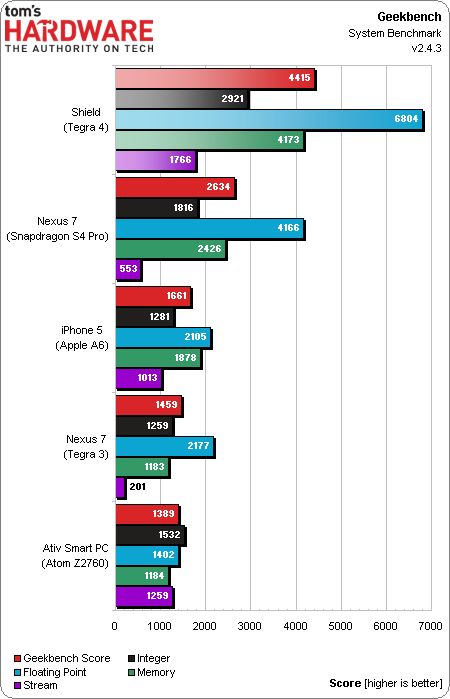
Geekbench runs a series of tests on various parts of a processor. The integer test, for example, includes 12 different tests split between single- and multi-threaded metrics. Based on the result of each benchmark, a score is assigned. Those individual scores are used to calculate a final score in each category, and then an overall Geekbench score.
Tegra 4 rises to the top across the board, again benefiting from Shield’s big chassis and active cooler to run at up to 1.9 GHz. The next-fastest contender, Google’s 2013 Nexus 7, employs Qualcomm’s S4 Pro down-clocked to 1.5 GHz.
AnTuTu
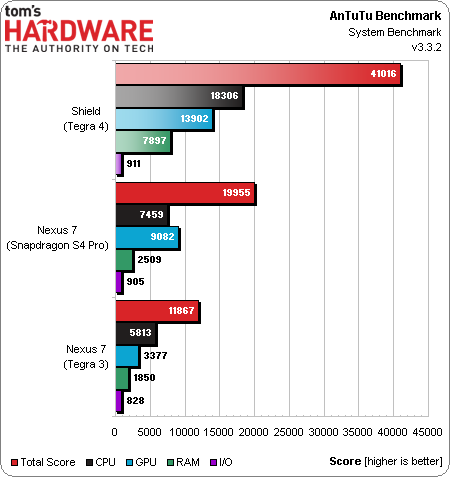
Similarly, AnTuTu 3.3.2 tests a number of different SoC sub-systems, including CPU integer and floating-point performance, memory, 2D and 3D graphics performance, and storage.
Tegra 4’s dual-channel LPDDR3-1800 memory configuration yields a particularly high RAM score (the aggregate 64-bit pathway also excelled in Geekbench, though not to the same extreme). Storage performance is fairly comparable across the board, which we’d expect.
Bear in mind that AnTuTu’s GPU test runs at the device’s native resolution. So, while Qualcomm’s APQ8064 is being benchmarked at 1920x1200, Tegra 4 is rendering to 1280x720. That reflects device performance, as opposed to each SoC’s potential.
PassMark Performance Test Mobile
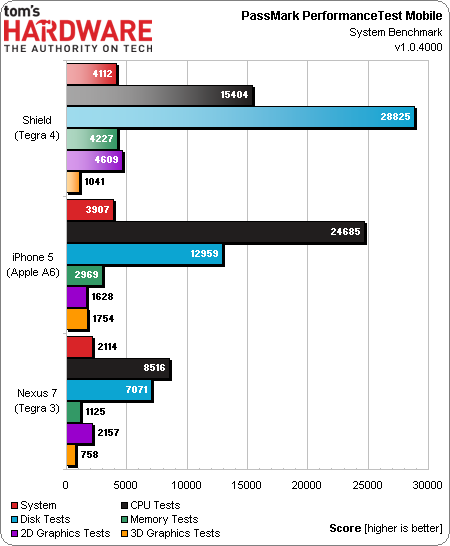
For some reason, PassMark is crashing on the Qualcomm-powered Nexus 7. Fortunately, there’s an iOS-based version we can use to get an iPhone 5 in the chart. Two numbers stand out most prominently: the Shield’s Disk test and the iPhone 5’s CPU test.
Nvidia had no explanation for why the storage test is scoring so high. Digging into our test notes, we’re seeing reads from flash approaching 1 GB/s, which definitely is not right. We’re also suspect of Apple’s 1.3 GHz dual-core A6 outperforming Tegra 4’s 1.9 GHz quad-core –A15-based SoC.
Current page: Results: Shield And Tegra 4 Platform
Prev Page Streaming PC Games To Shield Next Page Results: Shield And Tegra 4 Graphics-
Hazle impressive, especially PC streaming. but for $300, i'd rather pause the game to take a bathroom break. it's gonna take me a library of good android exclusives for me spend that amount of money, and PvsZ or Angry birds don't cut it.Reply -
beta212 Meh, with the PS4/xbox coming out , and tons of more convenient phones I don't see a market for a tegra4 shield, personally I'm saving my money for a console. The tegra is also too expensive and gimmicky to boot.Reply -
dragonsqrrl When you look purely at the performance and specs $300 unsubsidized isn't all that bad considering the hardware you're getting for the price. The problem to me isn't so much price but the target market. How many people are willing to spend that much on a second or potentially third mobile device meant specifically for gaming and entertainment?Reply -
bryonhowley Looks nice but I can find things better to spend $300 on. In truth I can't see ever streaming my PC games to a 5" screen when I use 3 Asus 27" monitors on my desktop PC. Going from 5760x1080 to 720p does not sound like something I am ready to do. And if I want to game from my recliner I just use my Xbox 360 wireless controller and play the game on my Panasonic 50" 3D Plasma.Reply -
vaughn2k for U$180, I can get a nice Lenovo Phone. For U$ 500, a good Xbox.. not sure if I need a Shield where I could play anywhere..Reply -
slomo4sho Not sure why most of your benchmarks were just between the shield and the Nexus 7. I understand that the Nexus 7 utilizes Tegra 3 but the iPhone 5, Note 2, or some other tertiary figues should have been included to provide a better comparison between this device and other current generation products.Reply
This device feels like a universal Wii U game pad and there is almost zero reason to own one. -
cats_Paw Considering that Oculus rift will cost somewhere around 300 dollars as well, id rather wait for that to spend my cash.Reply
Streaming is nice but if you are close toy our pc why not use the PC itself?
-
shikamaru31789 I'm just not seeing much reason to get one right now, not when I'm saving for the Xbox One and PS4. If it was at a lower price and if it supported AMD GPU's for PC streaming, I might get one. But they also need to get some developers to make some good Android exclusives, not just your typical mobile time wasters and ports of older console/PC titles, but some actuallAAA exclusives that are optimized for Tegra 4.Reply


