AMD CPU Efficiency Compared
Get Tom's Hardware's best news and in-depth reviews, straight to your inbox.
You are now subscribed
Your newsletter sign-up was successful
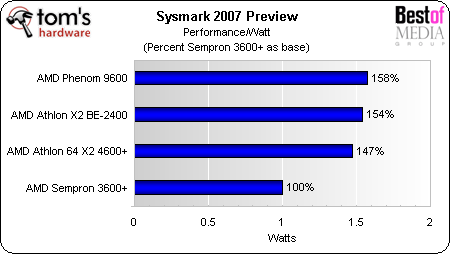
Performance Per Watt Normalized
Here is the normalized result, showing the improvement in performance per watt in percent.
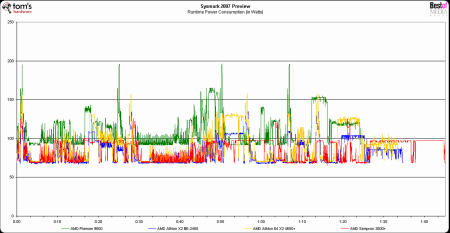
Performance Vs. Power Consumption Diagram
I particularly like these power/performance diagrams, as they show the power requirements during the entire SYSmark 2007 Preview run at any given point of the benchmark, as well as the time it took to complete the benchmark. You can see clearly that the Phenom system does indeed require the most power while it is working (including the peaks), but it also completes the benchmark suite in one hour and 23 minutes. The dual core processors required one hour and 35 minutes, while the single core Sempron took one hour and 45 minutes to complete the workload. A processor running under full load for approximately 20 minutes will of course stress your electricity meter.
Get Tom's Hardware's best news and in-depth reviews, straight to your inbox.
Current page: Performance Per Watt Normalized
Prev Page Total Power Required For SYSmark 2007 Preview Next Page Conclusion
Patrick Schmid was the editor-in-chief for Tom's Hardware from 2005 to 2006. He wrote numerous articles on a wide range of hardware topics, including storage, CPUs, and system builds.

