Does Power-Saving Technology Kill SSD Performance?
Features
By
Patrick Schmid and Achim Roos
published
Add us as a preferred source on Google
Results: Read/Write Transfer Diagrams
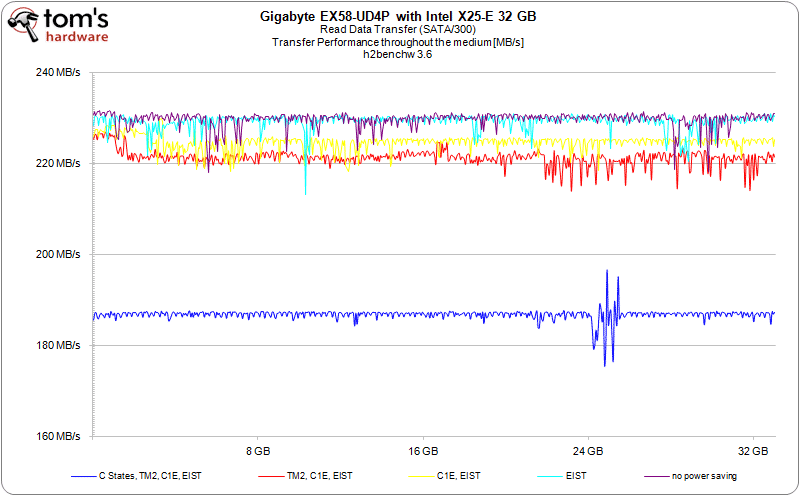
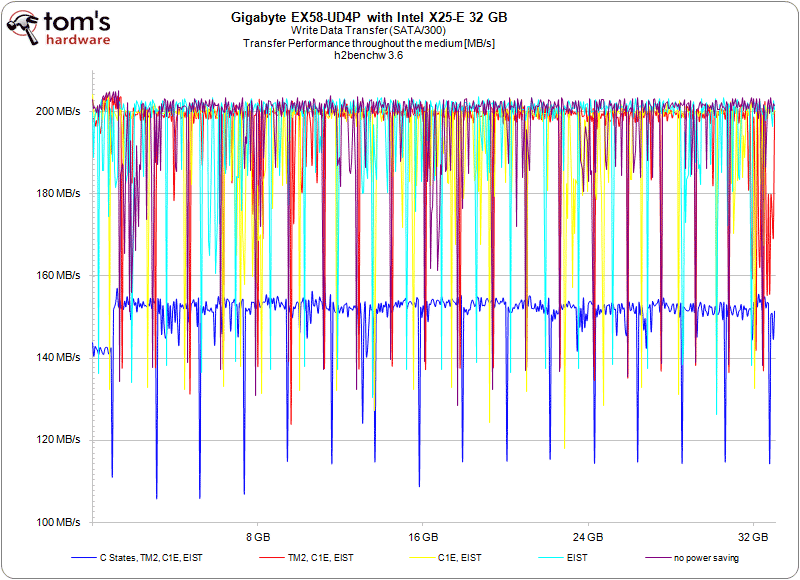
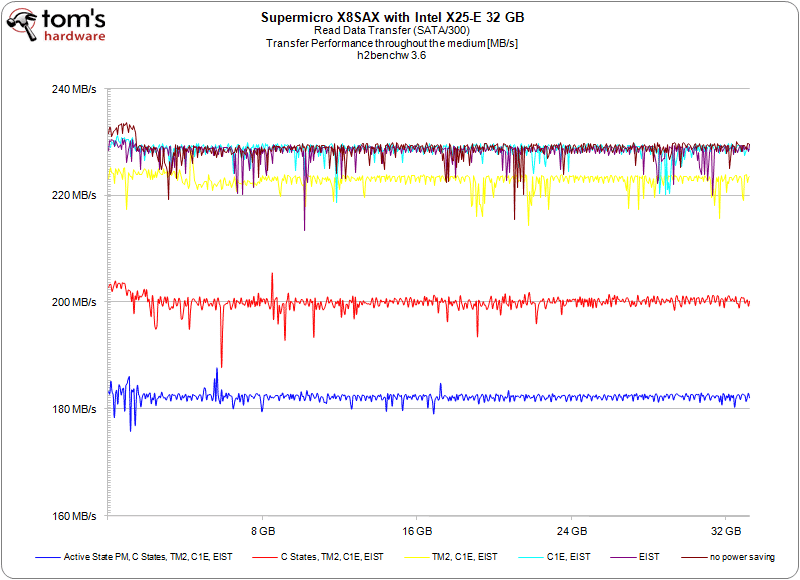
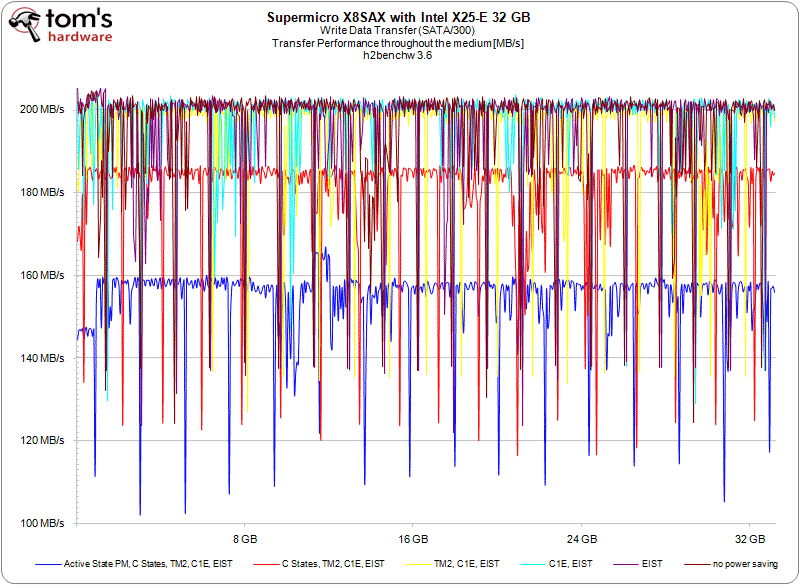
The diagrams on the previous page represent the average results, to give you hard numbers. But we decided to also add transfer diagrams. These visualize the performance difference between the different test runs with different power saving options added. We also decided to change the scale of the diagrams and not have them start at 0, so the differences become more obvious.
Stay On the Cutting Edge: Get the Tom's Hardware Newsletter
Get Tom's Hardware's best news and in-depth reviews, straight to your inbox.
Current page: Results: Read/Write Transfer Diagrams
Prev Page Results: Read/Write Throughput Next Page Outlook, Conclusion And Remaining Questions & AnswersTOPICS


