Gaming And Streaming: Which CPU Is Best For Both?
Test Setup
How We Tested
Repeatability is one of the most important components of any useful benchmark methodology. All tests have some degree of uncertainty, but we're looking for a minimal and consistent amount of variability. Results plagued by wild swings in performance from one run to the next aren't usable as accurate benchmarks.
As an example, we've yet to develop any reliable multi-tasking benchmarks. In response to reader requests, we have worked diligently to create a series of tests that measure gaming performance with background applications like Web browsers, email clients, media players, Discord, and Skype open. Windows' prioritization appears to be based on fickle and unexplained factors. The operating system suspends various background processes unpredictably during one scripted sequence, then leaves them fully active during the next (even when the test environment hasn't changed). This unpredictability becomes more, well, unpredictable, as the number of open applications increases. Switching Windows into Game Mode only complicates matters further. So far, we have no solution. Our multi-tasking experiments yield deltas from 5 to 15 FPS between successive runs, which means they land nowhere near our expectations for a reliable benchmark.
Luckily, game streaming is much easier to control. Encoding is a CPU-intensive task that chews up plenty of cycles, so Windows doesn't suspend or otherwise interfere with it. This allows us to create repeatable benchmarks without extreme outliers.
What We're Measuring
Evaluating game streaming performance works across two axes: game quality and stream quality. Of course, we'll measure average, minimum, and 99th percentile frame rates with and without streaming in the background. We'll also include our usual frame time and variance results, which become more important once we start streaming.
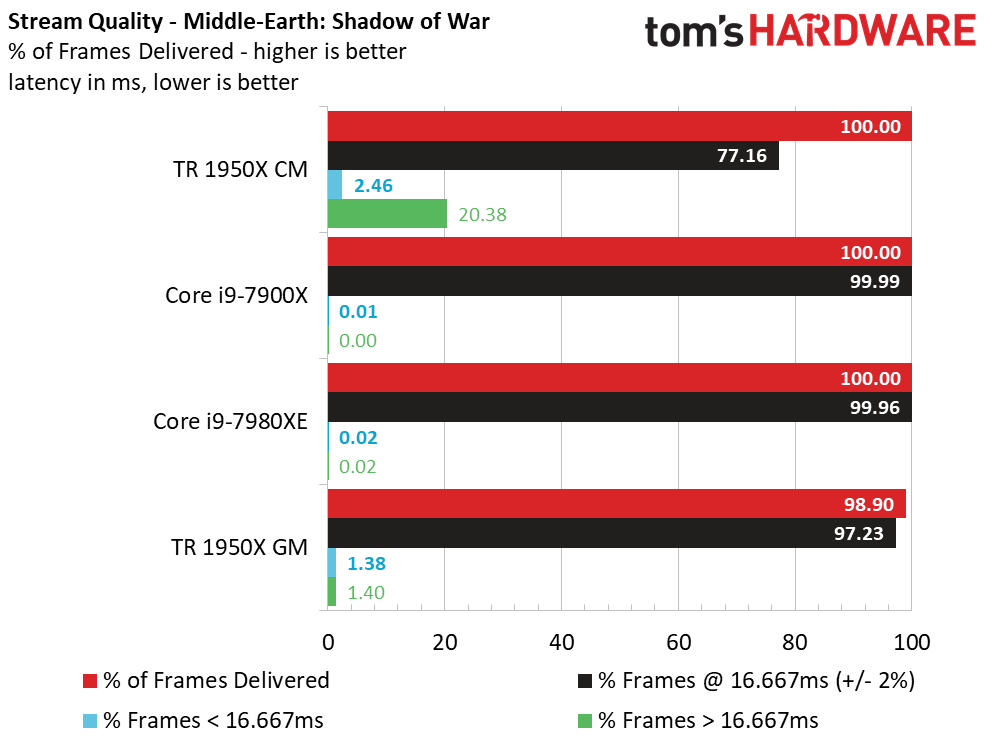
We also need to account for stream quality. That means recording the percentage of frames encoded. Each processor pushes different frame rates, so each run correspondingly generates a different number of frames. As such, we measure the percentage of frames successfully encoded as "% of Frames Delivered." In the test below, a Threadripper 1950X CPU encoded 98.9% of the frames generated by our gaming session, meaning it skipped 1.1% of the frames due to encoding lag.
We're streaming at 60 FPS, so we also measure stream quality by listing the percentage of frames encoded within the desirable 16.667ms (60 FPS) threshold. We also include the percentage of frames that land above and below the 60 FPS threshold, which helps quantify the hitching and stuttering a viewer would see on the stream. Subjective visual measurements are still important, so we'll call out tests that generate a bad-looking stream.
Open Broadcaster System
There are several software encoding applications, but we chose Open Broadcasting System (OBS) due to its flexible tuning options, detailed output logs, and broad compatibility with streaming services. We're using the x264 software encoder, along with YouTube Gaming for our streaming service. Any run that reports frames dropped due to networking interference is discarded.
Get Tom's Hardware's best news and in-depth reviews, straight to your inbox.
Our ultimate goal is to develop a test that measures CPU performance, so we select parameters that remove the most obvious bottlenecks. Gaming at 1920x1080 with an EVGA GeForce GTX 1080 FE side-steps a GPU limitation (as much as possible). Encoding overhead isn't as high with lesser video cards that generate fewer frames per second. We also test with a 10 Mb/s upload rate, though you can stream at 6 Mb/s or less. Our Internet connection would accommodate up to 35 Mb/s uploads. To vary game selection, we chose Grand Theft Auto V, Middle-earth: Shadow of War, and Battlefield 1 for our tests.
There are several other scenarios we could have added to increase the complexity of our testing, such as a simultaneous video stream from a webcam, recording the game to the host system, or streaming to multiple services at once. We went with just one service to reduce the number of variables...at least for now.
Finding the best streaming options requires some tuning for every game and hardware configuration. There is a delicate balance between game performance on the host system and stream quality for the remote viewer, so fine-tuning is needed to yield the best mix. We picked somewhat general settings that offered a good range of performance by our subjective measure. We also stuck with options that'd establish a level playing field for a wide range of test systems. Just be aware that there are plenty of knobs to turn, some of which could offer better performance than the ones we use (lowering the stream to 30 FPS, for instance, cuts encoding overhead significantly)
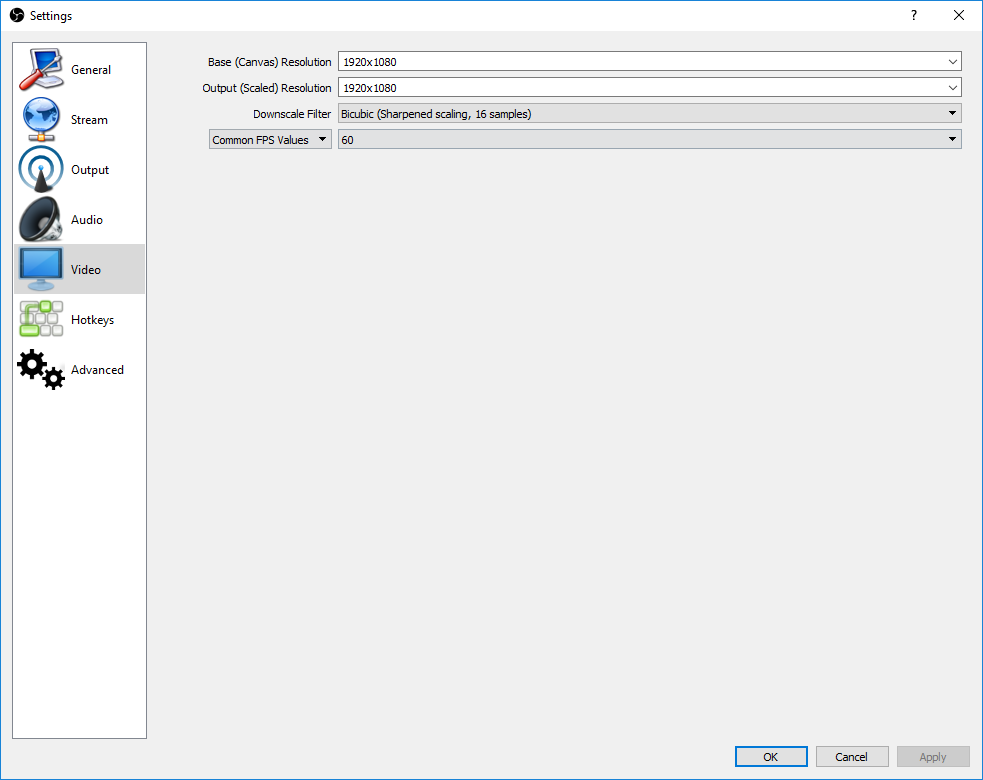
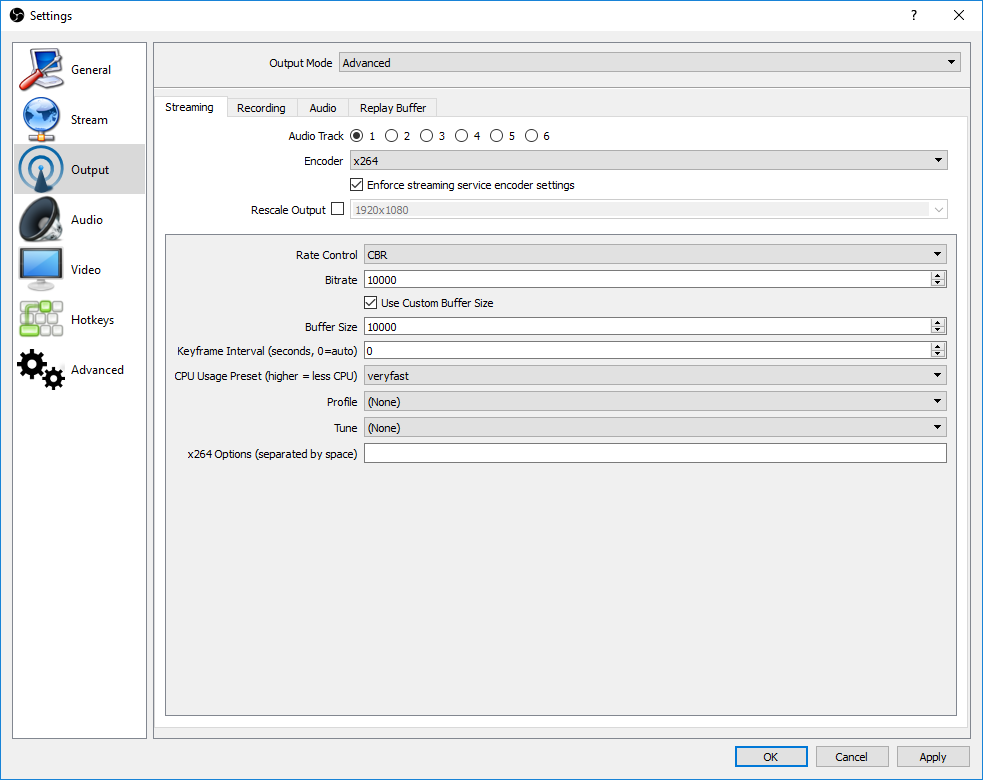
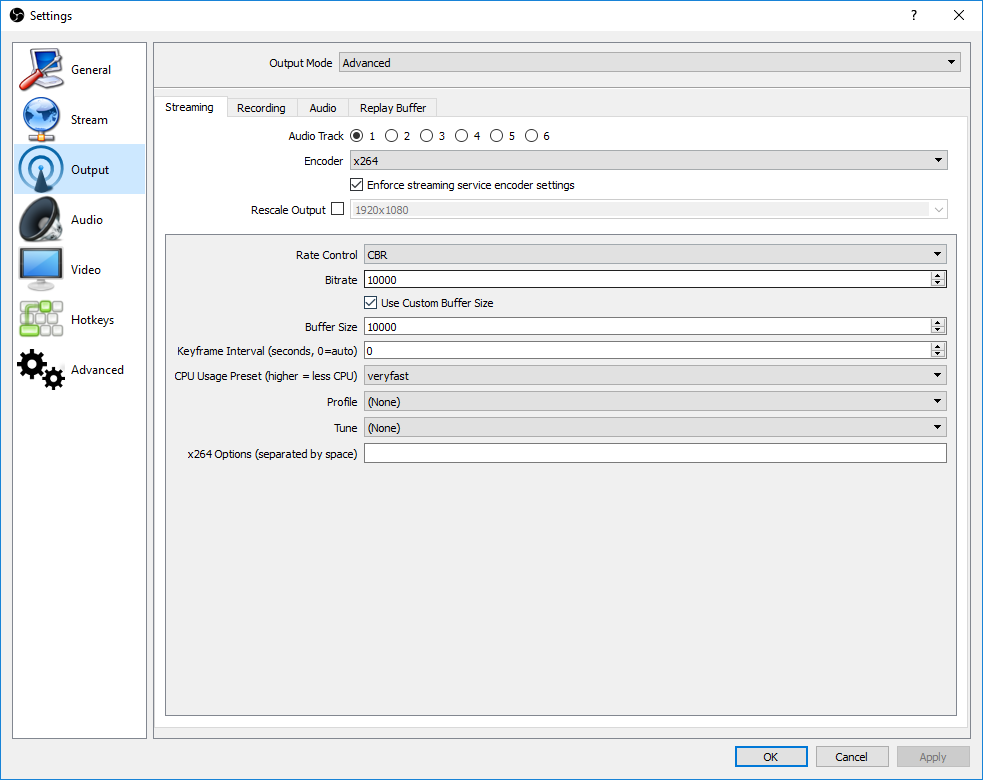
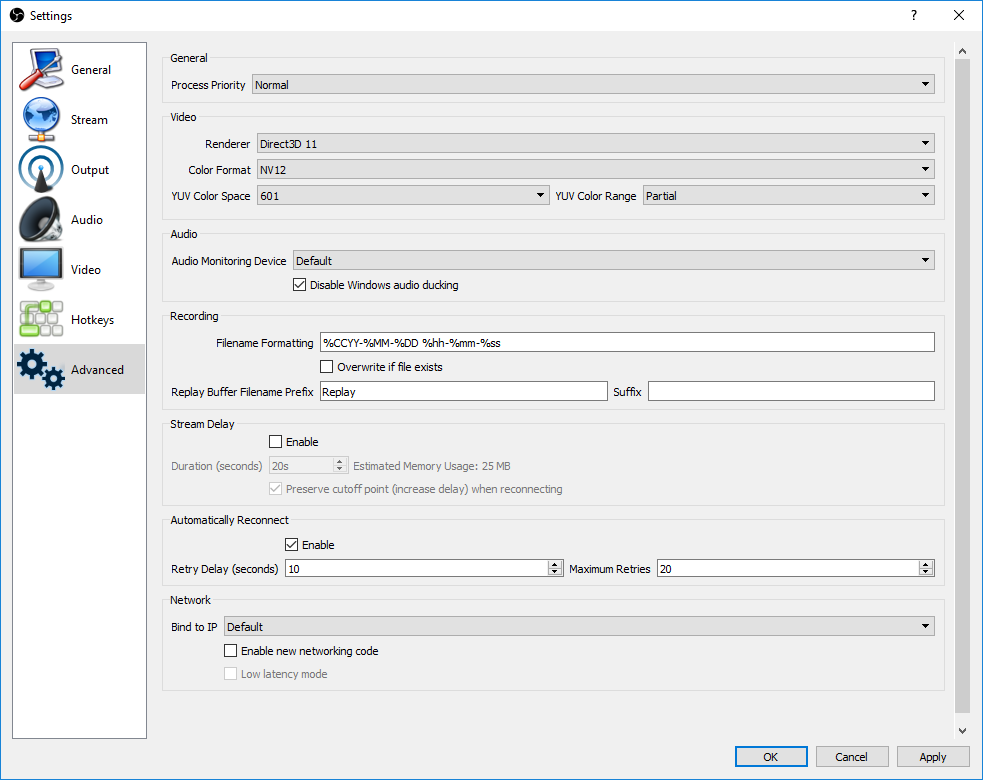
Tuning the encoding presets is one of the most direct ways to adjust streaming performance and quality for your system's capabilities. Slower encoding increases compression efficiency, which provides better output quality and reduces compression artifacts. OBS has 10 presets ranging from "ultrafast" (the lowest-quality setting with the least computational overhead) to "placebo" (offering the best streaming quality and consuming the most host processing resources). The placebo setting is aptly named; there is certainly a rapidly diminishing rate of return on stream quality after passing the "slower" preset (two ticks before placebo). More strenuous settings can quickly cripple even powerful processors, particularly if you are streaming from a single host system. Placebo with care.
We split our test groups into three different classes. After evaluating a few Core i3- and Ryzen 3-class processors and determining that they can't stream effectively at our settings, we chose Ryzen 5 and Core i5 models for our entry-level systems. We used the "veryfast" encoding setting for this class of CPU. Naturally, higher-end processors, such as our Ryzen 7/Core i7 and Threadripper/Core i9 chips, offer more performance, so we use the "faster" and "fast" settings, respectively, for brawnier CPUs.
Because we're testing with different encoding presets, you cannot compare test results for the different classes directly.
| Test System & Configuration | |
|---|---|
| Hardware | Intel LGA 1151 (Z370)Intel Core i5-8600K, Core i7-8700KMSI Z370 Gaming Pro Carbon AC2x 8GB G.Skill RipJaws V DDR4-3200 @ 2666 and 3200 MT/sAMD Socket AM4AMD Ryzen 5 1600X, Ryzen 7 1800XMSI Z370 Xpower Gaming Titanium2x 8GB G.Skill RipJaws V DDR4-3200 @ 2667 and 3200 MT/sIntel LGA 1151 (Z270)Intel Core i5-7600K, Core i7-7700K MSI Z270 Gaming M72x 8GB G.Skill RipJaws V DDR4-3200 @ 2666 and 3200 MT/sAMD Socket SP3 (TR4)AMD Ryzen Threadripper 1950XAsus X399 ROG Zenith Extreme4x 8GB G.Skill Ripjaws V DDR4-3200 @ 2666 and 3200 MT/sIntel LGA 2066Intel Core i9-7900X, Core i9-7980XEMSI X299 Gaming Pro Carbon AC4x 8GB G.Skill Ripjaws V DDR4-3200 @ 2666 and 3200 MT/sAll EVGA GeForce GTX 1080 FE 1TB Samsung PM863 SilverStone ST1500-TI, 1500W Windows 10 Creators Update Version 1703Corsair H115i |
MORE: Best CPUs
MORE: Intel & AMD Processor Hierarchy
MORE: All CPUs Content

Paul Alcorn is the Editor-in-Chief for Tom's Hardware US. He also writes news and reviews on CPUs, storage, and enterprise hardware.
-
SonnyNXiong Core i7 7700k is the best, can't get any better than that except for a high OC speed and high core clock speed on that core i7 7700k.Reply -
InvalidError This benchmark will need a do-over once the patch for Intel's critical ring-0 exploit comes out and slows all of Intel's CPUs from the past ~10 years by 5-30%.Reply -
mcconkeymike Sonny, I disagree. I personally run the 7700k at 4.9ghz, but the 8700k 6 core/12 thread is a badass and does what the 7700k does and better. Please do a little research on this topic otherwise you'll end up looking foolish.Reply -
AndrewJacksonZA Reply
Yeah. It'll be interesting to see the impact on Windows. Phoronix ( https://www.phoronix.com/scan.php?page=article&item=linux-415-x86pti&num=2 ) shows a heavy hit in Linux for some tasks, but apparently almost no hit in gaming ( https://www.phoronix.com/scan.php?page=news_item&px=x86-PTI-Initial-Gaming-Tests )20553340 said:This benchmark will need a do-over once the patch for Intel's critical ring-0 exploit comes out and slows all of Intel's CPUs from the past ~10 years by 5-30%.
Although gaming in Linux, seriously?! C'mon! ;-) -
ArchitSahu Reply20553303 said:Core i7 7700k is the best, can't get any better than that except for a high OC speed and high core clock speed on that core i7 7700k.
What about the 8700k? i9? 7820X? -
AgentLozen What a great article. It really highlights the advantage of having more cores. If you're strictly into gaming without streaming, then Kaby Lake (and Skylake by extension) is still an awesome choice. It was really interesting to see it fall apart when streaming was added to the formula. I wasn't expecting it to do so poorly even in an overclocked setting.Reply -
Soda-88 A couple of complaints:Reply
1) the article is 10 months late
2) the game choice is poor, you should've picked titles that are popular on twitch
Viewer count at present moment:
BF1: ~1.300
GTA V: ~17.000
ME - SoW: ~600
Personally, I'd like to see Overwatch over BF1 and PUBG over ME: SoW.
GTA V is fine since it's rather popular, despite being notoriously Intel favoured.
Other than that, a great article with solid methodology. -
guadalajara296 I do a lot of video encoding / rendering in Adobe cc premier proReply
It takes 2 hours to render a video on Skylake cpu. would a Ryzen multi core improve that by 50% ? -
salgado18 Reply20553388 said:20553303 said:Core i7 7700k is the best, can't get any better than that except for a high OC speed and high core clock speed on that core i7 7700k.
What about the 8700k? i9? 7820X?
Please, don't feed the trolls. Thanks. -
lsatenstein To be able to respond to Paul's opening comment about reputability testing, the rule is to have at least 19 test runs. The 19 runs will provide a 5 percent confidence interval. That means or could be understood to be 19/20 the results will be within 5 percent of the mean, which is about 1 standard deviation.Reply
