Plextor M6S And M6M SSD Review: Revving Another Marvell Engine
Plextor is launching two new SSDs under its M6 banner. The M6S and M6M lean on Toshiba's A19 flash and Marvell's updated 9188 silicon. Together, both components (plus some custom firmware work) should augment value and speed in a couple of form factors.
Storage Consistency: The Adobe Photoshop (Heavy) Trace
Storage Consistency With PCMark 8's Adobe Photoshop (Heavy) Trace
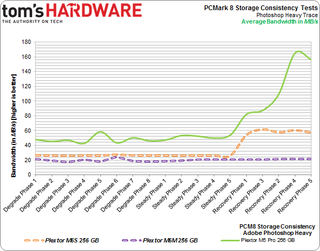
Because there are 18 individual rounds packed with 10 traces each, we need to focus. We'll choose one trace, Adobe Photoshop (Heavy), and keep tabs on it through the entire extended run.
Bandwidth

Most of the data accumulated for Plextor's M5 Pro is based on older firmware. We ran the PCMark tests after flashing to version 1.06 though, and it appears to enjoy much better resiliency. Apparently, Plextor made some solid improvements to the technology it calls TrueSpeed, which includes better algorithms to keep write amplification low and performance high when the drive is out of available blocks for writes. The M6es fare well enough, but the M5 Pro handles PCMark 8 much better.
These drives are already in a steady state by the time PCMark 8 gets to the Photoshop trace in round one, so performance starts low. Already, though, the M5 Pro sustains two times more read and write throughput than the M6es. Once we get to the Recovery Phases, it establishes an even greater advantage. We're currently looking into why Plextor's M6S regains some of its performance, while the M6M does not.
Latency
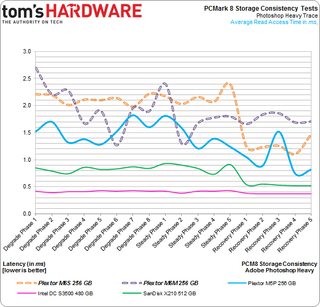
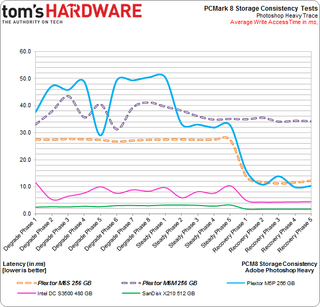
In this test, we take the same Adobe Photoshop (Heavy) trace and use average read and write latency to compare a handful of other notable SSDs.

We shouldn't see read latency suffer due to write degradation. And that's partially why drives like Intel's DC S3500 yield flat lines; no amount of writing upsets it.
Plextor's M6es do improve as the Recovery Phase begins. I actually think that the degraded latency measurements have to do with the controller working through garbage collection and data rotation schemes, rather than a direct result of heavy write activity.
Stay on the Cutting Edge
Join the experts who read Tom's Hardware for the inside track on enthusiast PC tech news — and have for over 25 years. We'll send breaking news and in-depth reviews of CPUs, GPUs, AI, maker hardware and more straight to your inbox.
Just look at those SanDisk and Intel drives, though. This story gets even better in the next chart...

Intel's SSD DC S3500 and SanDisk's X210 are simply exquisite. Meanwhile, Plextor's M6M doesn't get a lift in average write latency, even when it's given a chance to recover. The M6S does, however, clean up well.
Despite the impressive bandwidth shown in the previous chart, the M5 Pro demonstrates interesting latency. At the end of the day, both it and the M6S finish in roughly the same place.
The Bottom Line
As we know, there is no one number able to convey the totality of an SSD's performance. PCMark 8's Storage Consistency test simply reinforces that fact. Drives don't deserve to be avoided for struggling in this benchmark, nor should any SSD be given an award for doing well. Rather, this becomes yet another tool in our suite for evaluating storage, even if it's something you might not want to mess with at home.
Why not? Well, the process isn't a simple one. There are 10 traces, and one play-through (plus round-specific preconditioning) is one phase. After 18 phases, you're presented with a shocking amount of data. That makes illustrating the information fairly difficult. I believe focusing on the Adobe Photoshop (Heavy) trace gives us a happy medium, though if you'd like to see us do something different than the above three metrics, feel free to reach out in the comments section.
Current page: Storage Consistency: The Adobe Photoshop (Heavy) Trace
Prev Page PCMark 8's Storage Consistency Test: New For Tom's Hardware Next Page Results: Power Consumption-
bjaminnyc I know there are slight performance differences between models and manufacturers, for the home user the discrepancies matter very little other than lifespan. It all comes down to price point for non-commercial application, not sure where this really fits in the product stack.Reply -
WithoutWeakness The Marvell 88SS9188 controller in the M6S is only capable of addressing 4 NAND channels at a time whereas the 88SS9187 (Crucial M500, Plextor M5Pro) and 88SS9189 (Crucial M550) are capable of addressing a full 8 channels. I would expect the Plextor M6Pro to use the newer 88SS9189 found in the M550 to be able to address 8 channels of NAND and support up to 1TB drives using 128Gbit NAND.Reply -
Ipatinga Clean looks... ok update for the M5S... here hopping M6P will have something on its sleeve performance wise. I liked the Plextor software (its like a bonus for some people... ).Reply
But I still have the Samsung 840 EVO on my list, after all, when the dust settles, they both perform very well in a notebook for a regular joe, but the EVO has the price to beat.
Since my Crucial m4 is not dead... I will wait... mainly for prices to go even lower so I can get a higher capacity model instead of the best of the best. -
cryan Reply13069953 said:The Marvell 88SS9188 controller in the M6S is only capable of addressing 4 NAND channels at a time whereas the 88SS9187 (Crucial M500, Plextor M5Pro) and 88SS9189 (Crucial M550) are capable of addressing a full 8 channels. I would expect the Plextor M6Pro to use the newer 88SS9189 found in the M550 to be able to address 8 channels of NAND and support up to 1TB drives using 128Gbit NAND.
So we weren't able to get confirmation from Plextor or Marvell, but it's probably the case that the 9188 is a cut down four channel version of the 9189. It's all the more annoying, because this is the third review in a row with new Marvell silicon but no actual info from Marvell.
We have a pretty good idea of this from looking at the 9174 4 channel used in the UltraPlus vs the 8 channel 9175 used in.... pretty much everything else ever made... that the 9188 is a four channel version of the 9189. But we don't know how many CEs per channel it has, or much else for that matter.
However, we do know Plextor's M6 Pro will have a 1 TB version, also with A19 flash. Plextor reps told me as much at the 2013 Flash Memory Summit. That was last August though, so I think there have been some delays -- either with Marvell, Toshiba, or both.
Regards,
Christopher Ryan -
cryan Reply13071551 said:Why not compare the Samsung EVO 840?
If you're referring to the 128 KB sequential and 4 KB random performance, I'm trying to keep those clean. I'd much rather throw down on matchups like this in more important metrics. However, with TRIM testing out this go around, the EVO v. M6 angle got downplayed. It's an oversight.
Regards,
Christopher Ryan
-
cryan Reply13073455 said:I really wish write speeds would actually make a jump.
For sequential writes, you can't do much better than 500 MB/s. The fastest M6M/M6S hits 440 MB/s, and so there just isn't much room left to grow unless you switch to PCIe-based storage or add a couple drives in RAID.
Regards,
Christopher Ryan
-
michaelrhaley Great article! I'd like to see a summary comparison of your top ten drives listed in Tom's best SSDs for the money using your new benchmark. Most important is your omission of Samsung 256G Pro which has been your leader for 8 months cited now as "face meltingly fast". Any performance benchmark must include the Samsung leader. Love to see this right away from you!Reply
Sincerely, Michael -
kalmquist Currently, the 128GB M6S is selling for $100 on Newegg, the 256GB M6S is selling for $165. The 512GB M6S is not listed.Reply
Hard to justify buying these over the Samsung 840 EVO ($85 and $154). Actually, for most uses my first thought would be the Crucial M500 ($75 and $120). The M500 doesn't win on either performance or power consumption, but it is good enough that these will not be major issues for the typical user.
Most Popular


