System Builder Marathon Q1 2015: System Value Compared
More Money, Performance, Surprises?
System Builder Marathon, Q1 2015: The Articles
Here are links to each of the five articles in this quarter’s System Builder Marathon (we’ll update them as each story is published). And remember, these systems are all being given away at the end of the marathon.
To enter the giveaway, please fill out this SurveyGizmo form, and be sure to read the complete rules before entering!
Day 1: Budget Gaming PC
Day 2: The Mainstream Enthusiast PC
Day 3: Our $1750 Performance PC
Day 4: System Value Compared
Day 5: Alternative $1750 PC
Ask any performance enthusiast what a reasonable sacrifice might look like, and you'll likely get a blank stare rather than a consistent answer. We all demand plenty of system memory, a fast graphics card and a capable host processor. Moreover, our desires evolve as we realize we might have more money to spend.
Readers overwhelmingly responded to last quarter’s high-end build with a demand for more RAM and a better motherboard, reasoning that anyone spending over $1600 wouldn’t be willing to cut corners in those areas. The next biggest change sounded fairly reasonable: a $60 graphics upgrade. What’s $60 when you’re spending $1600, right?
My competitors responded with a quick “yes” when I asked them if we could increase our budgets. It turns out that they wanted to try out a few upgrades too. But that’s where the agreement fell apart.
Get Tom's Hardware's best news and in-depth reviews, straight to your inbox.
I see these machines as $550, $1100 and $1650 configurations, plus the cost of an operating system. The other builders in this contest agreed to treat those numbers as core component limits, allowing an extra $50, $100 and $150 to be spent on parts that don’t make the machine run. That final disagreement is how we end up with $700, $1300 and $1750 budgets—including Windows—and me leaving $150 on the table.
| Q1 2015 System Components | |||
|---|---|---|---|
| Row 0 - Cell 0 | $700 Budget Gaming PC | $1300 Enthusiast PC | $1750 Performance PC |
| Processor | Intel Core i3-4150: 3.5GHz, Two Cores, 3MB Cache | Intel Core i7-4790K: 4-4.4GHz, Four Cores, 8MB Cache | Intel Core i7-4790K: 4-4.4GHz, Four Cores, 8MB Cache |
| Graphics | Sapphire Dual-X 100373L Radeon R9 280 3GB | Asus STRIX-GTX970-DC2OC-4GD5 GTX 970 4GB | 2x PNY VCGGTX9704XPB GeForce GTX 970 4GB, SLI |
| Motherboard | ASRock H81M-HDS: LGA 1150, Intel H81 Express | MSI Z97 PC Mate: LGA 1150, Intel Z97 Express | Gigabyte Z97X-Gaming 5: LGA 1150, Intel Z97 Express |
| Memory | G.Skill Ripjaws X DDR3-1600 C9, 8GB (2 x 4GB) | G.Skill Ripjaws X DDR3-2133 C9, 8GB (2 x 4GB) | G.Skill Ares DDR3-1866 C10, 16GB (2 x 8GB) |
| System Drive | WD Blue WD10EZEX: 1TB, 7200 RPM, SATA 6Gb/s HDD | PNY Optima SSD7SC240GOPT-RB: 2.5" 240GB SATA 6Gb/s SSD | Crucial MX100 CT256MX100SSD1 2.5" 256GB SATA 6Gb/s SSD |
| Power | EVGA 100-W1-0500-KR: 500W, 80 PLUS (standard) | EVGA 600B 100-B1-0600-KR: 600W, 80 PLUS Bronze | Rosewill Capstone-750: 750W, 80 PLUS Gold |
| CPU Cooler | Intel Boxed Heat Sink and Fan | Zalman CNPS9900MAX-B | Corsair Hydro H100i Closed-Loop Liquid-Cooler |
| Platform Cost | $519 | $1029 | $1554 |
| Storage Drive | Uses System Drive | WD Blue WD10EZEX: 1TB, 7200 RPM, SATA 6Gb/s HDD | None |
| Optical | Asus DRW-24B1ST 24x DVD±R | Pioneer BDC-207DBK 8x BRD Reader, 16x DVD±R | Asus DRW-24B1ST 24x DVD±R |
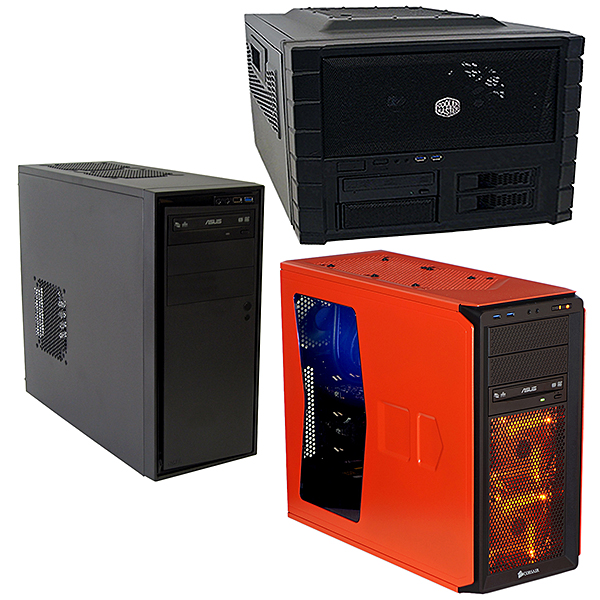
| Case | NZXT Source 210 Elite Black | Cooler Master HAF XB Evo | Corsair Graphite 230T Orange |
| Total Hardware Cost | $589 | $1224 | $1654 |
| OS | Windows 8.1 x64 OEM | ||
| Complete System Price | $689 | $1324 | $1754 |
The consequence of my stubbornness is that this month’s high-end build doesn’t have a storage drive, even though the winner of this machine will probably need more capacity than my 256GB SSD affords. I gave the mechanical disk up while pursuing the upgrades demanded by readers, while sticking to my original budget plan. Different enthusiasts have different goals though, and it’s time for me to admit that both budgeting methods are equally valid as long as you have the cash for a pricier setup.
Leaving out a $55 hard drive feels a little like cheating when I’m going up against two cheaper machines sporting at least 1TB of total capacity. Then again, could a 3% cost savings on one component really cost one of my competitors their value victory? Let’s find out!
Current page: More Money, Performance, Surprises?
Next Page Overclock And Benchmark Settings-
cknobman So my conclusion from this is that SLI is not worth the investment when gaming @1080p even across 3 monitors.Reply
Unless you are going to do 4k gaming the current crop of CPUs combined with the current graphics engines out there are more than capable of 1080p multi monitor gaming at high or even the highest settings.
-
sumarongi I think the performance of your GTX 970 SLI is completely out of line in comparison with the single GTX 970. A quick look around shows most reviewers reported much better scaling than you are showing??Reply -
Crashman Reply
Pandering perhaps? A reviewer can use a limited range of high settings to find up to 80 or 85% performance gains from the second card. You'll see SOME of those results in this article.15386669 said:I think the performance of your GTX 970 SLI is completely out of line in comparison with the single GTX 970. A quick look around shows most reviewers reported much better scaling than you are showing??
On the other hand, maybe we're pandering to the low-end system by not removing the low-end settings. Look at BF4's 200 FPS cap, and Grid2's DRAM performance bottleneck, both at lower-than-optimal settings for the GTX 970.
Or maybe we just balance out the pandering-to-the-high and the pandering-to-the low. But if it's balanced, we're no longer pandering. Anyway, these details explain the difference between what you've seen there and what you're seeing here.
Edit: Or maybe pandering to the top and bottom cancel each other out to boost the middle. Don's $1300 PC wins!
-
sumarongi Reply15386727 said:
Pandering perhaps? A reviewer can use a limited range of high settings to find up to 80 or 85% performance gains from the second card. You'll see SOME of those results in this article.15386669 said:I think the performance of your GTX 970 SLI is completely out of line in comparison with the single GTX 970. A quick look around shows most reviewers reported much better scaling than you are showing??
On the other hand, maybe we're pandering to the low-end system by not removing the low-end settings. Look at BF4's 200 FPS cap, and Grid2's DRAM performance bottleneck, both at lower-than-optimal settings for the GTX 970.
Or maybe we just balance out the pandering-to-the-high and the pandering-to-the low. But if it's balanced, we're no longer pandering. Anyway, these details explain the difference between what you've seen there and what you're seeing here.
Edit: Or maybe pandering to the top and bottom cancel each other out to boost the middle. Don's $1300 PC wins!
Fair enough, I understand what you are saying. The rating system you are using creates it's own viewpoint on the world that you need to remain consistent within. Maybe value needs to be addressed from the point of view of each individual system and what a real end-user that would buy that system would expect and experience. No one runs SLI GTX 970 on 1600 x 900 resolution so the fact that performance is not great at that resolution has no value at all - negative or positive - and those data points just distort things when it comes down to comparisons.....
-
Crashman Reply
We have some of that in the final chart, 5760x1080 gaming. I could further refine it to include only 5760x1080 at the highest quality test settings, but it already makes that point.15387046 said:Fair enough, I understand what you are saying. The rating system you are using creates it's own viewpoint on the world that you need to remain consistent within. Maybe value needs to be addressed from the point of view of each individual system and what a real end-user that would buy that system would expect and experience. No one runs SLI GTX 970 on 1600 x 900 resolution so the fact that performance is not great at that resolution has no value at all - negative or positive - and those data points just distort things when it comes down to comparisons.....
Perhaps another value chart at 1920x1080 for the low-end system would help, and another for non-gaming if I'd used an X99 system with a cheaper graphics card. I'll toss ideas like that back to the other guys and see what they think.
-
Onus A system has value in the context for which it was built. Even if I were to put a tuner card into it, I'm not likely to judge the value of my PC on its ability to receive broadcast TV, or my TV on its ability to add up numbers. "Is it fit for purpose," though limited, is a fair question, especially on a tight budget.Reply
-
Crashman Reply
Yes, we can't have any of that. TIME TO REPLACE DON!!!15387451 said:Whelp that explains the flying pigs I seen today, Paul lost.
-
Kulamata You're tying yourself up in knots. Instead of setting an arbitrary limit for each category, I'd suggest designing a build for each category, and then listing the costs, and then, from that, suggesting changes to meet various cost thresholds, with a discussion of why those changes deviate from the "ideal".Reply
This would prevent some of the significant limitations that can occur for want of a nail, or a few dollars. I'd regard a machine with only an SSD, and a smallish one at that, to be crippled, and to not kick the system cost from ~$1750 to ~$1800 to provide a hard drive makes the system a victim of misplaced priorities.
That's bean-countin' son! -
OhSnapWord Personally, I'm getting tired of seeing all Intel in the SBMs. I would like to see all AMD for an SBM as it would help give a real nice comparison between the two platforms.Reply


