SK Hynix Canvas SC300 SSD Review
SK Hynix is the least well-known NAND flash manufacturer. Most of the company's flash sells directly to the mobile market, but with increased manufacturing capacity we'll see more SK Hynix on the market.
Why you can trust Tom's Hardware
Performance Test Results
Data Type Comparison
The LAMD Amber controller's programming isn't subject to performance loss when it's presented with incompressible data. This was one of the processor's big selling points when it launched. It was also an expensive controller compared to the SandForce SF-2281 and second-generation Marvell SATA 6Gb/s hardware. Fast-forward a few years, mix in modern 1xnm flash and we finally have a more competitive mainstream SSD.
Sequential Write Performance Degradation
For years, consumer-grade SSDs were divided into two groups: high-performance and mainstream products. With greater access to three-bit-per-cell flash and low-cost MLC, the stratification is increasing. TLC is starting to dominate the entry-level market, while planar MLC NAND on a SATA bus fits between the TLC-based and high-end NVMe-attached drives. The SK Hynix Canvas SC300 sits in the middle, delivering good sustained sequential write performance at a reasonable price.
Most TLC-based products can deliver similar write speed, but only for a short period of time. After their emulated SLC layers are filled, you're exposed to the native performance of triple-level-cell memory. On a 512GB SSD, that's somewhere between 100 and 130 MB/s.
Sequential Read Performance
To read about our storage tests in-depth, please check out How We Test HDDs And SSDs. Four-corner testing is covered on page six of our How We Test guide.
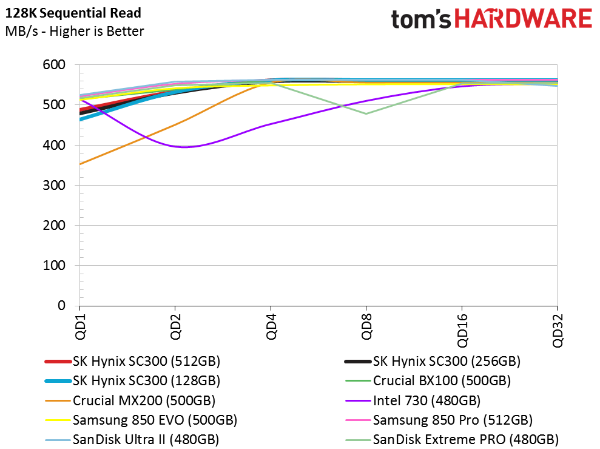
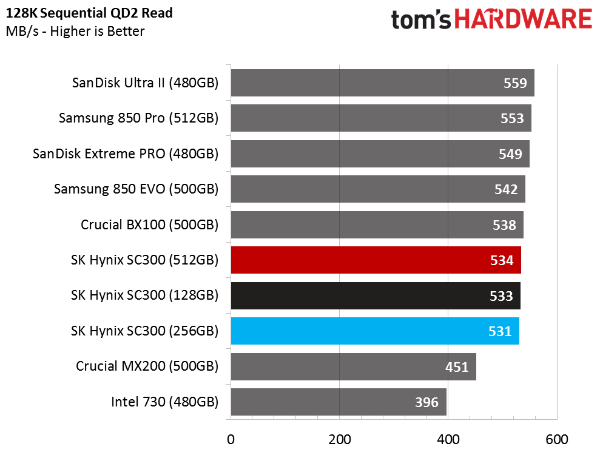
We're testing all three SK Hynix Canvas SC300 drives, putting them up against other mainstream and a few premium SATA SSDs from the 512GB capacity class. All of our comparisons will be to the 512GB Canvas SC300, though the other two capacities are included for reference (their performance will be lower due to less interleaving).
Sequential Write Performance
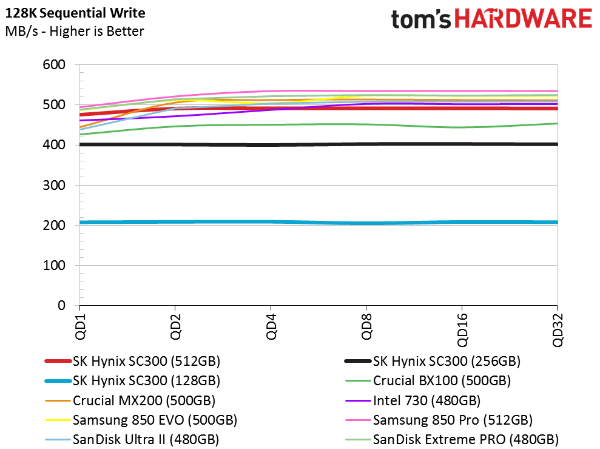
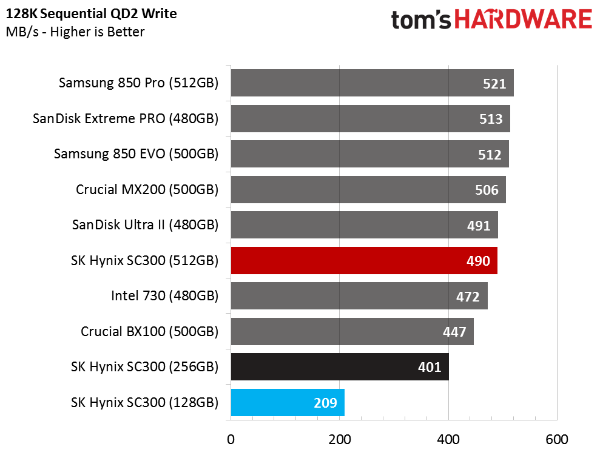
The 512GB Canvas SC300 fits in with the other mainstream SSDs when we benchmark sequential write performance. The SATA interface limits flash performance, so all of the 512GB drives are artificially constrained to start with. Samsung's 950 Pro (equipped with the same V-NAND as the 850 Pro) shows just how much a 6Gb/s link holds modern SSDs back.
Ultimately, the SC300 falls toward the bottom of the list, but lands among the other mainstream drives.
Get Tom's Hardware's best news and in-depth reviews, straight to your inbox.
Random Read Performance
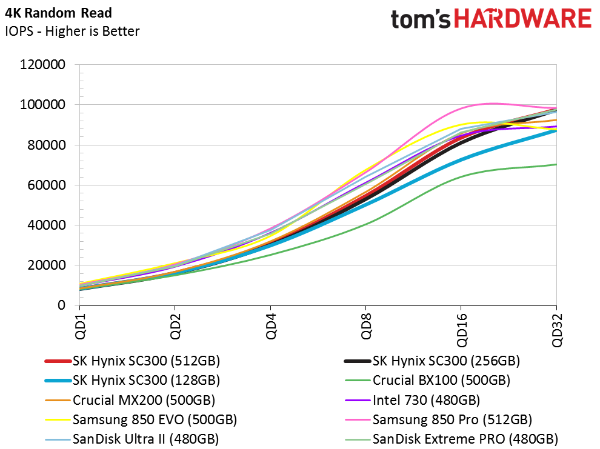
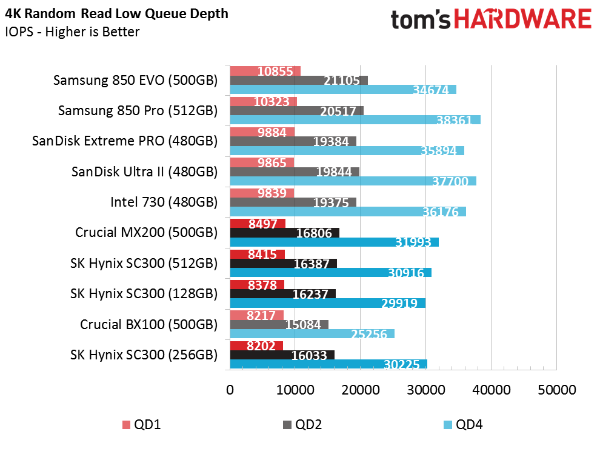
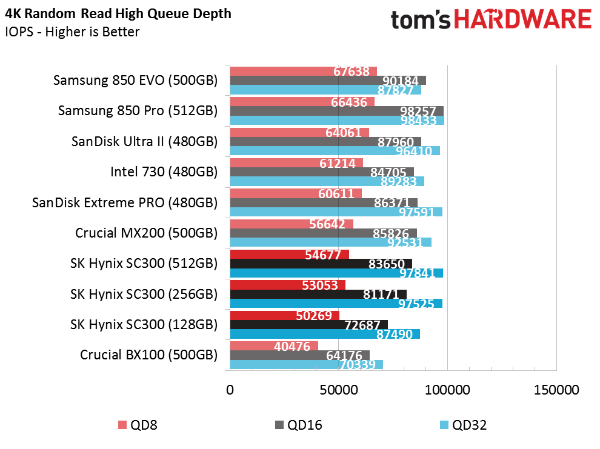
The difference between mainstream and high-end SSDs is clear in our random read tests. The high-end drives deliver 9000 or more IOPS at a queue depth of one. As you can see, only a few examples qualify. Notably, the mainstream-priced standout -- Samsung's 850 EVO -- is in this distinguished group.
SK Hynix's SC300 doesn't quite make it, but does outperform the Silicon Motion SM2246EN controller in Crucial's BX100. The SC300 also comes close to the 500GB MX200. At low queue depths, the comparison is really a draw.
Random Write Performance
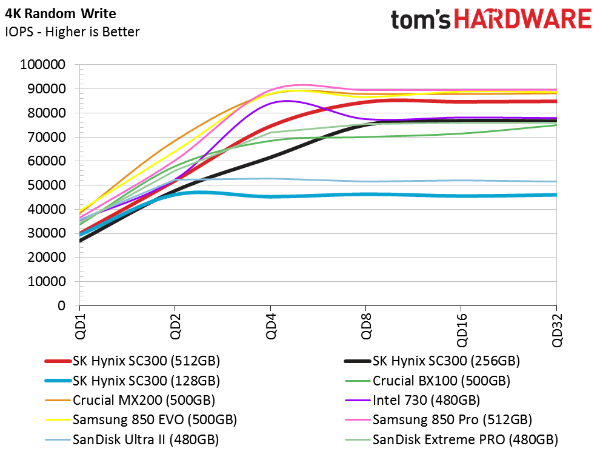
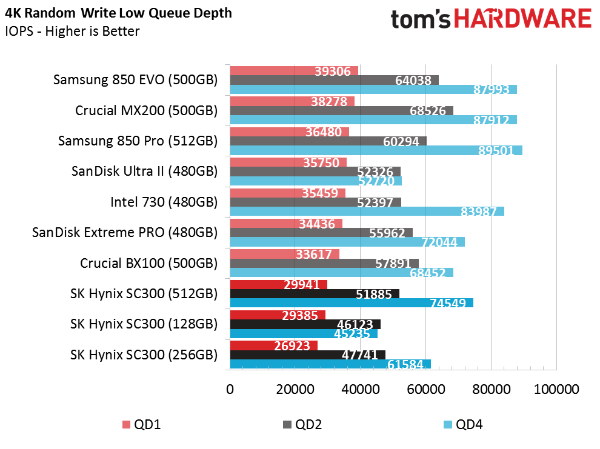
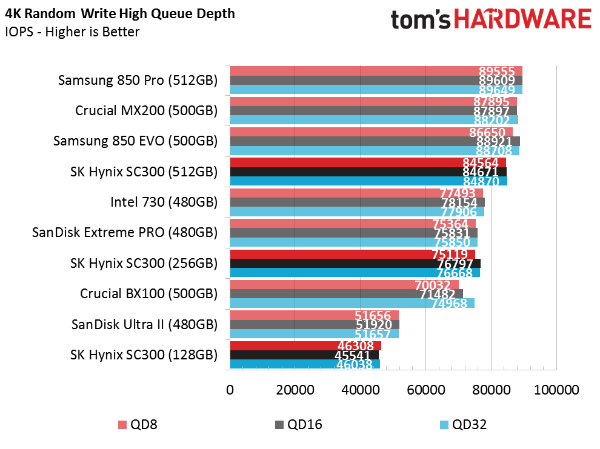
Normal random write workloads rarely stretch above a queue depth of four, though multi-tasking can cause more commands to stack up. The Canvas SC300 drives fall to the bottom of our chart in random write performance at low queue depths. Despite this, the 512GB model isn't too far away from Crucial's competing BX100.
80% Read Mixed Workloads
Our mixed workload testing is described in detail here, and our steady state tests are described here.
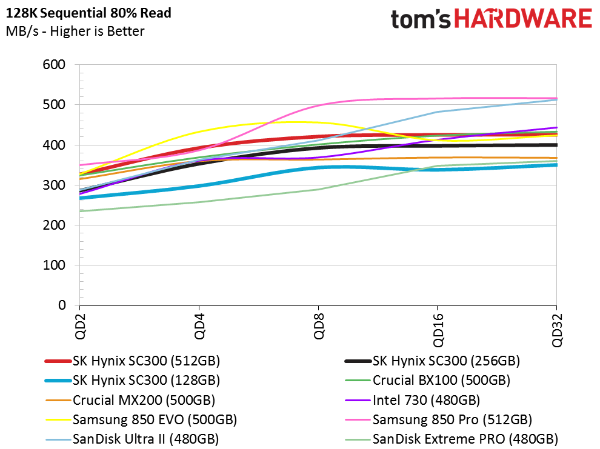
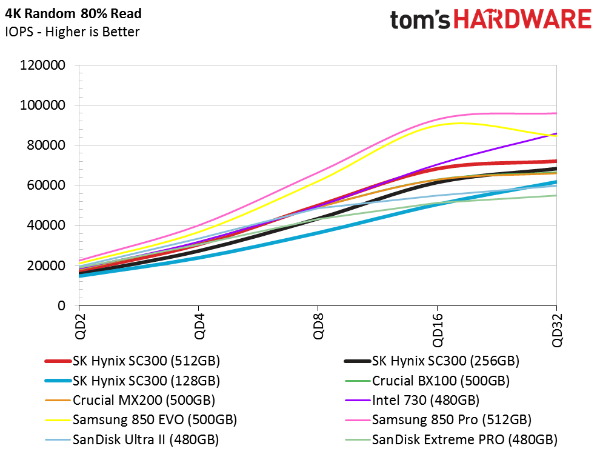
The two mixed workload tests scale according to queue depth, giving us an alternative method of reporting performance. Boot drives rarely read or write data exclusively. Small transfers from background activity almost constantly work your drive while you run applications in the foreground.
SK Hynix's Canvas SC300 512GB performs well in the face of this mixed data metric. In both tests, it delivered nearly identical performance to that of Intel's SSD 730 480GB. Only the two Samsung 850 SSDs do better.
Sequential Mixed Workloads in Steady State
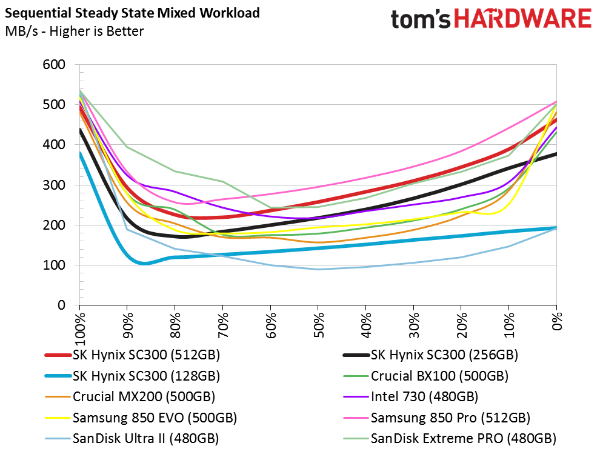
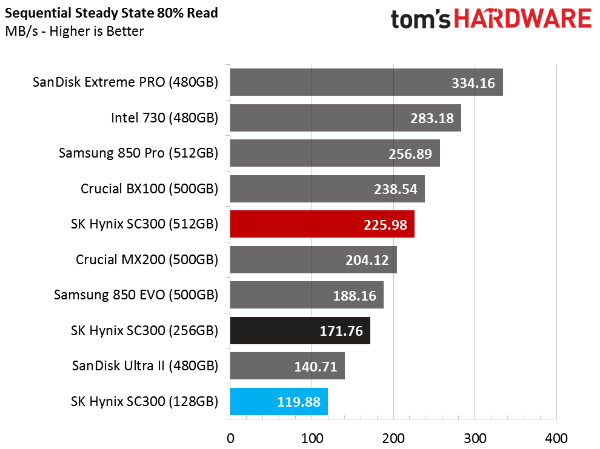
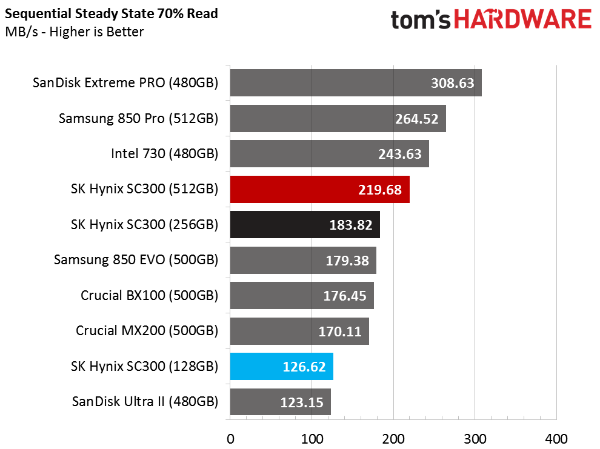
Our steady state sequential tests start with pure sequential writes and slowly shift to reads. We emphasize two specific workloads: 80 percent read/20 percent write (the traditional client workload) and 70 percent read/30 percent write (a common workstation workload).
Again, the 512GB SC300 lands in the middle of our comparison field. It's a mainstream offering, so that's a good place for the drive to be. As we shift to the 70/30 mix, the SC300 does a bit better. In short, this SSD offers good sequential steady state write performance.
Random Write Steady State Performance
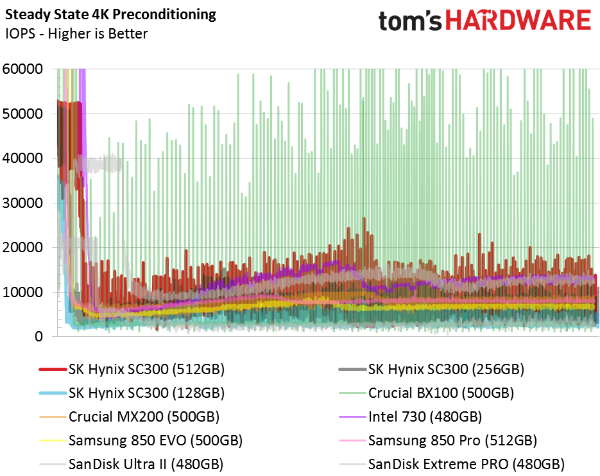
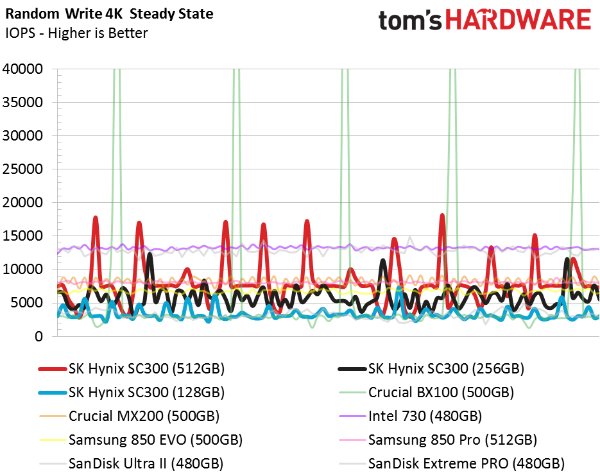
Under normal conditions, you'll never get an SSD down into steady state using random writes. Even in the enterprise, it's rare to push a drive this hard. More than anything, we run the test in order to evaluate performance consistency.
Intel's 480GB SSD 730 is a stellar example of the behavior we're looking for. It demonstrates very little variance; the line is nearly straight and its random 4KB writes are high. The 512GB Canvas SC300, on the other hand, exhibits high peaks and low valleys. Those are amplified in RAID as drives are added to the array. Although the SC300 is better than many competitors, it still isn't consistent enough for RAID in a workstation environment.
Current page: Performance Test Results
Prev Page A Closer Look Next Page Real-World Software Performance
Chris Ramseyer was a senior contributing editor for Tom's Hardware. He tested and reviewed consumer storage.
-
mavikt One question that pops up when reading SSD benchmarks nowadays, especially the Real world software performance, is how much the SSD's are hamstrung by the SATA interface?Reply
I know I'll be aiming for an M.2 NVMe model when I get a new rig next year. -
CRamseyer The sequential write test at QD1 and QD2 show your large file transfers. The QD1 and QD2 random tests show what to expect when transferring many small files.Reply
We like to look well beyond simple file transfers. PCMark 8's Storage Tests are traces of actual workload. The trace is replayed in the software and does a very good job representing what you would reasonably expect in a real world environment. -
mavikt The rational for my question was that when looking at the "PCMark 8 Real-World Software Performance", World of Warcraft, Battlefield 3, Adobe, etc. all of them results are so alike across all the SSD's that it seems they're 'artificially' capped. Is that a SATA interface bottleneck we're seeing?Reply -
CRamseyer Mavikt - There is more to it than just the SATA 6Gbps bus but you are on the right track. Sequential transfers (copy and paste type operations) can be limited by SATA with large block size loads.Reply
Most applications use small block size loads so performance can be limited by SATA's efficient overhead and Window's file system. This is why we test 4KB blocks and measure in IOPS.
