Tested: X570 Motherboards Can Overjuice Ryzen, But Rarely Do
HWinfo claims that X570 motherboards from a variety of manufacturers are guilty of underreporting power to Ryzen CPUs so the chips will go faster at stock settings, but at the possible expense of chip longevity. It doesn't appear that AMD condones the power misreporting, and in response, AMD said that it was investigating the issue but doesn’t believe the chips will suffer excessive wear during the warranty period. So, after we wrote an article about the software vendor’s claims and its new feature (designed to detect the problem), we set out to determine if the new test was accurate and if there was any imminent danger to the health of Ryzen CPUs from motherboard makers cooking the books.
After testing three different X570 motherboards, using a variety of settings, cooling solutions and even firmware, we found that, while HWinfo does shine a light on some issues, it can output inflated values that aren't representative of actual power misreporting. Of the three motherboards -- an ASRock X570 Taichi, MSI X570 Godlike and an Gigabyte X570 Aorus Master, only the Taichi showed a huge delta between reported and actual power that resulted in increased performance. Those settings resulted in higher clock rates, voltages, and heat output. And that issue, which happened with the reviewer BIOS, largely disappeared once we installed the latest firmware. The remaining relatively small variances of 10 to 15 percent are easily explained by factors such as VRM variations, though. We even found a few motherboards that misreport power in a way that reduces performance.
HWinfo says its new power deviation measurement, which is built into its free to download and use utility, provides a means for users to determine if their motherboard is lying to their Ryzen chips. You simply have to put your CPU under load by using any common multi-threaded test (Cinebench R20 is recommended), and then monitor the value to see its relation to 100%. The 100% value represents that the motherboard is feeding correct values to the Ryzen processor so it can modulate performance within expected tolerances, while lower values can indicate false power telemetry data.
Be sure to read the forum thread for a more detailed description of the firm’s recommendation on how to test your own processor with the tool, but until further adjustments to the software are made, you should take the results with a grain of salt.
Testing for Motherboard Cheats
After hearing the report that some motherboards were misreporting key power telemetry data to Ryzen processors, my mind immediately went to the ASRock X570 Taichi motherboard we evaluated for our Ryzen 7 3900X and 3700X review.
At the time, the Taichi was our lone X570 motherboard in the lab, so I put it through the paces to assess whether or not the motherboard was suitable for CPU testing. I spent several days testing with the motherboard and encountered a few problems, such as drastically inaccurate power readings from software monitoring applications and lower performance with the auto-overclocking PBO presets than I recorded at 'stock' settings.
Encountering difficulties with motherboard firmwares is certainly not an exception during an NDA period—in fact, it's often the rule. Both Intel and AMD platforms tend to suffer from these bugs early in the review process, and communication with either the chipmaker or the motherboard vendor usually helps iron out the initial missteps.
Get Tom's Hardware's best news and in-depth reviews, straight to your inbox.
However, the issues we encountered with the Taichi remained unresolved after speaking with ASRock, so we switched to a late-arriving MSI X570 Godlike motherboard a few days before the NDA expired, spinning up the tests you see in our review today. That wasn't fun, but having to switch test hardware happens more than you might imagine.
We prefer to use software monitoring tools like AIDA64 and HWinfo for our power measurements, as they scrape the power consumption measurements directly from the sensor loop, thus removing VRM inefficiencies from the values and showing us exactly how much power the processor itself consumes. That allows us to derive in-depth power consumption and efficiency metrics.
Software monitoring is also great because we can trigger it during our scripted tests, thus simplifying and speeding the process for our large test pools that often include 15 different processors/configurations. Unfortunately these measurements can be gamed by motherboard vendors, so due diligence is key if you rely on software-based polling, especially in light of the misreported power telemetry issue with some AM4 motherboards.
Intercepting power at the EPS12V connectors (the eight-pin CPU connectors on the motherboard) is a good method for measuring power consumption. However, it doesn't measure the true amount of power flowing into the processor because VRM inefficiencies, typically in the range of 15% on high-end motherboards, come into play.
Modern processors also draw power from separate minor rails on the 24-pin connector for various functions, like memory controllers, graphics, and I/O interfaces. Those measurements aren't included in the measurements from the EPS12V connectors. The 24-pin also supplies power to the rest of the system, making it impossible to split out the amount of power dedicated to the CPU. We also don't have software-triggerable hardware that would enable scripting the measurements into our automated test suite.
In an attempt to get the best of both the hardware- and software-logging worlds, we use either Powenetics hardware or Passmark's In-Line PSU tester to measure power consumption at the EPS12V connectors (i.e., the two EPS12V connectors that supply the lion's share of power to the processor). As part of our usual evaluation process of a new motherboard for CPU testing, we validate that the sensor readings obtained from the logging software, like AIDA64 or HWinfo, plausibly aligns with the power readings that we intercept at the EPS12V connectors.
This can involve a bit of fuzzy math, as VRM inefficiencies can create deltas between the power delivered to the VRMs and the power that's fed to the processor. These deltas vary based on the components in each motherboard's power delivery subsystem (typically ~10% to ~15%), but massive inaccuracies aren't hard to spot, especially like those we charted out below.
The Overclocking Connection
First, we need to determine what would stand out as unsafe behavior. AMD doesn't provide an 'unsafe voltage' specification, instead defining three key limits for stock operation. The list below is reproduced word-for-word from AMD's CPU reviewer's guide:
- "Package Power Tracking (“PPT”): The PPT threshold is the allowed socket power consumption permitted across the voltage rails supplying the socket. Applications with high thread counts, and/or “heavy” threads, can encounter PPT limits that can be alleviated with a raised PPT limit.
a. Default for Socket AM4 is at least 142W on motherboards rated for 105W TDP processors - Thermal Design Current (“TDC”): The maximum current (amps) that can be delivered by a specific motherboard’s voltage regulator configuration in thermally-constrained scenarios.
a. Default for Socket AM4 is at least 95A on motherboards rated for 105W TDP processors. - Electrical Design Current (“EDC”): The maximum current (amps) that can be delivered by a specific motherboard’s voltage regulator configuration in a peak (“spike”) condition for a short period of time.
a. Default for Socket AM4 is 140A on motherboards rated for 105W TDP processors."
-- AMD CPU Reviewer's Guide
You can override those settings either manually or with AMD's auto-overclocking Precision Boost Overdrive. You can access this feature via either the BIOS or Ryzen Master software. Given the allegations of reliability implications due to increased voltages at stock settings, we set out to use this warranty-invalidating feature as a comparison point to the voltage and power thresholds that come as a byproduct of erroneous power telemetry.
Unfortunately, PBO typically doesn't deliver huge performance gains if you adhere to the basic presets. Motherboard vendors define these profiles, and some users have opined that the slim auto-overclocking margins could be due to the misreported power telemetry eating into the available overclocking headroom. The answer isn't quite that straightforward, but it does make sense that altered power consumption at stock settings could chew into the available overclocking margin.
At stock settings, AMD's Precision Boost 2 automatically exposes the most performance possible given the capabilities of your motherboard's power delivery subsystem and your cooler. Premium components unlock more performance, but that doesn't qualify as overclocking because these algorithms are constrained by the PPT, TDC and EDC settings during stock operation.
Engaging PBO overrides the stock settings for these variables. The basic "enabled (PBO on)" preset enables significantly higher PPT/TDC/EDC limits, but doesn't change two important settings: PBO Scalar or Clock.
PBO Scalar overrides the AMD default health management settings and allows increased voltage at the maximum boost frequency and lengthens boosting duration. Changing the PBO Scalar setting unlocks the best auto-overclocking performance, so the basic preset can be lacking.
You can also use the "PBO Advanced" profile that defines the limits of each motherboard based on the capabilities of the power delivery subsystem (as defined by the motherboard vendor). This setting exposes the highest PPT, TDC and EDC settings for the motherboard, but also doesn't change the PBO Scalar and Clock settings. However, this setting does allow you to change the PBO Scalar and Clock settings manually, with the former usually unlocking much higher auto-overclocking potential.
We used three profiles for our testing below. The 'Stock' settings consist of an explicit disablement of all PBO features, while 'Advanced Motherboard ('Adv. Mobo') means the profile that sets the highest preset PPT, TDC and EDC values for each motherboard, but doesn't change the PBO Scalar value.
Some motherboard vendors also include custom presets in the BIOS that include scalar manipulations, but those aren't available on all motherboards. To keep things consistent, we also manually adjusted all motherboards with the same settings that we've marked on the charts as 'Recommended.' This setting includes a manually defined Scalar and AutoOC Clock setting, as listed in the table below.
Unlike in our reviews, we also kept memory settings consistent between the various configurations to eliminate that as a contributor to higher performance.
| Ryzen 9 3900X | PPT | TDC | EDC | PBO Scalar | AutoOC | Memory |
| Stock | 142W | 95A | 140A | Not assigned | Not assigned | DDR4-3200 |
| Adv. Mobo | 1000W:ASRock,MSI 500W:GB | 540A:ASRock 540A:GB 245A:MSI | 540A:ASRock 600A:GB 280A:MSI | Not assigned | Not assigned | DDR4-3200 |
| Recommended | 190W | 120A | 160A | 10X | 200MHz | DDR4-3200 |
A Tale of Two "Reviewer BIOSes"
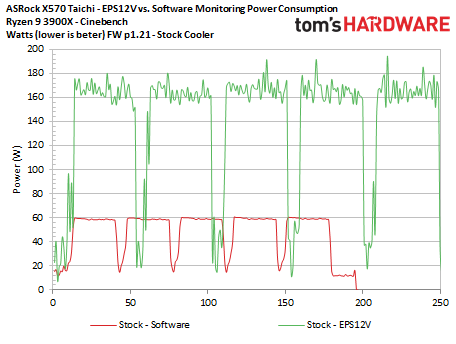
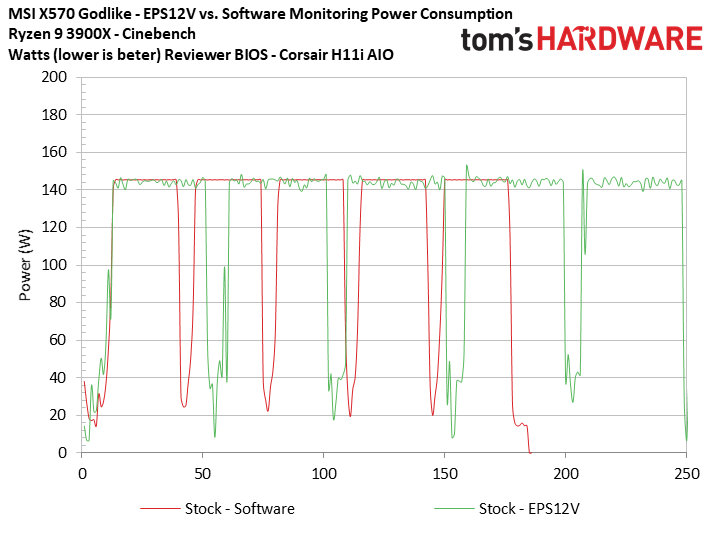
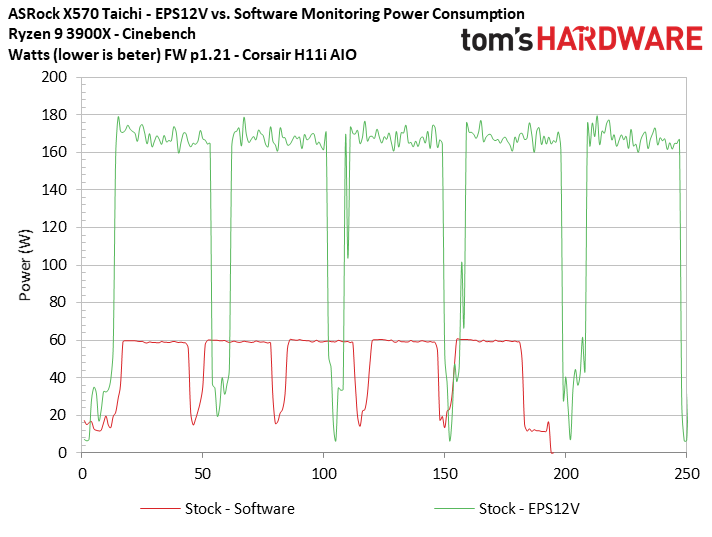
The first chart in this series plots the amount of power reported by the SMU. This reflects the amount of total power the processor believes it is consuming, compared to the amount of power we recorded at the EPS12V connectors during five consecutive runs of the multi-threaded Cinebench benchmark on the ASRock X570 Taichi motherboard.
We measured these values at stock settings with the firmware provided to reviewers (p1.21) and the included stock Ryzen cooler for this first test, as AMD specs the processor for operation with its own cooler. The measurements from HWinfo, marked as 'Software,' don't align perfectly with the measurements from the Passmark In-Line PSU tester (marked as EPS12V) on the time axis due to differing polling, but it gives us a good-enough sense of the difference between the two measurements.
The first chart shows that the 3900X's SMU reports ~60W during the Cinebench renders, while our physical measurements record peaks around 180W. The CPU averaged ~165W under load. That's a massive ~3X delta between the amount of power coming into the EPS12V and the software-monitored values, which shows exactly why we chose not to use this board for our review.
The second slide in the album contains measurements from the reviewer BIOS (1015) included with MSI's X570 Godlike, and the software measurements align nearly perfectly with the observed power draw from the EPS12V connectors. We expect some losses from VRM inefficiencies, so this result is almost too good. Given that some power is fed from the 24-pin that we're not measuring, the results are far more believable than the values we received from the Taichi motherboard, though.
We spoke with MSI about the too-perfect measurements, and the company tells us that, for its initial BIOS, it used a reference CPU VDD Full Scale value derived from an AMD-provided test kit/load generator. This is the setting at the heart of the matter: the processor uses it to determine how much power it consumes.
The reference value resulted in the X570 Godlike over-reporting the power fed to the processor, which can actually result in slightly lower performance. Later, the company tested the parameter with a real CPU to fine tune it for the X570 Godlike's power delivery subsystem, so changes were made in newer BIOS revisions to bring the reporting more in line with the motherboard's capabilities. You'll see the impact of those changes when we test the new BIOS below. The HWinfo deviation measurement, which we aren't using for these tests, doesn't appear to take those rational changes into account.
The third slide measures performance with the Taichi motherboard, but this time we swapped out the stock cooler for an 280mm Corsair H115i AIO watercooler. This cooler gives the processor more thermal headroom, and you'll see the results of AMD's innovative Precision Boost 2 and PBO algorithms in the next series of tests.
The overarching conclusion from this first look is that ASRock's reviewer BIOS for the X570 Taichi vastly under-reported power information to the processor, thus allowing it to draw more power than the X570 Godlike, which actually over-reported its power use. As you'll see below, that equates to more voltage, heat, and performance from ASRock.
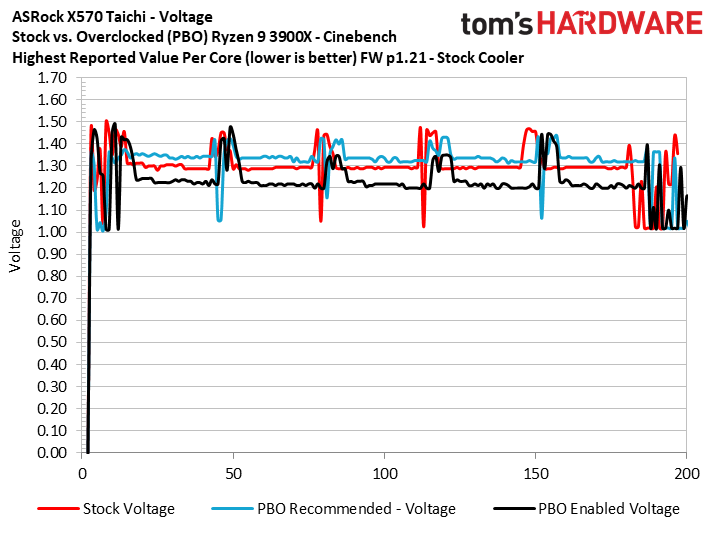
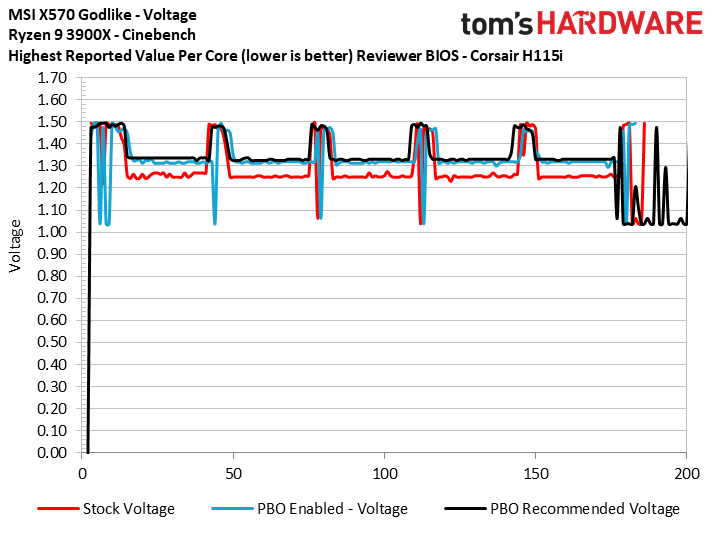
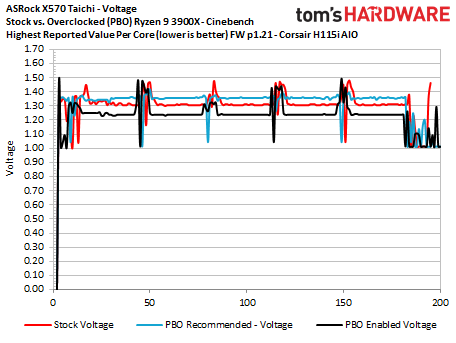
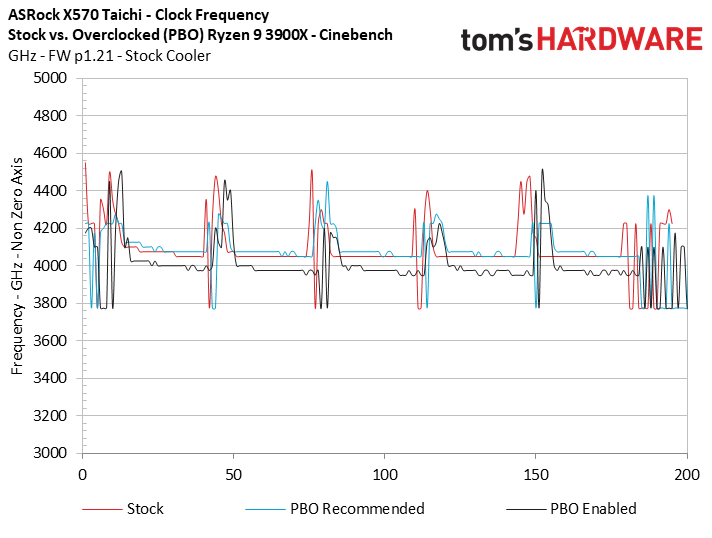
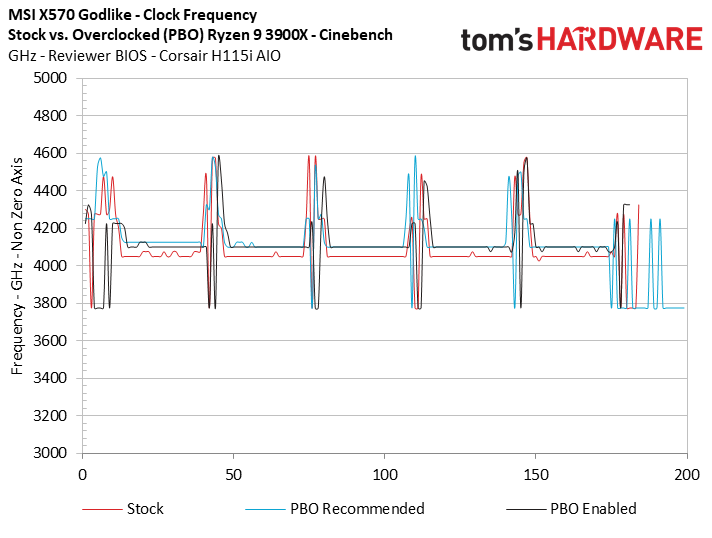
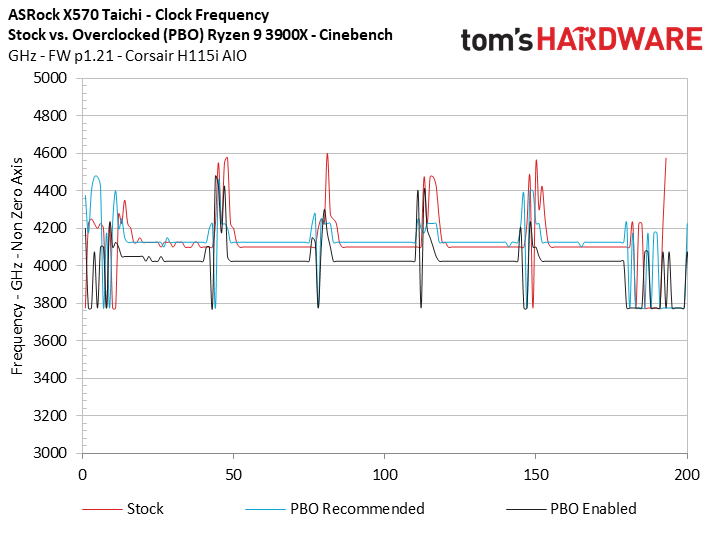
Given that all of the cores can run at different voltages at the same time, we plotted the maximum value recorded across the cores for each measurement to simplify the charts. We used the same approach for clock speed and use a non-zero axis for more granularity. When the processor is under load, most of the voltage and frequency values remain consistent among the cores.
The first three charts above outline the voltage applied to the Ryzen 9 3900X with the reviewer firmware. Luckily, the voltage scale is fixed, so these measurements are accurate regardless of any adjustments to the full scale current value that's at the heart of the issue. The first slide shows that the X570 Taichi, at stock settings, applies 1.3V to the processor while it's under load, while the X570 Godlike feeds the chip ~1.25V. That isn't much of a variation despite the ~20W delta in the cumulative measurements shown above, but there are obviously a lot of variations between how the respective motherboards handle power.
You'll notice that the preset PBO settings (PBO Enabled) result in lower voltage and clocks frequencies with the Taichi. However, when we adjust the PBO Scalar setting with our 'PBO Recommended' alterations, voltages rise along with clock speeds. In contrast, the MSI X570 Godlike operates to our expectations, with more performance coming as a result of the overclocked settings.
The original Taichi reviewer BIOS offers similar all-core boost speeds of around 4.125 GHz at stock settings with the H115i cooler, compared to the Godlike's 4.05 GHz. With the air cooler, clocks are mostly similar for the Taichi between its stock and PBO Recommended settings, while using the liquid cooler exposes more headroom for a slightly higher clock.
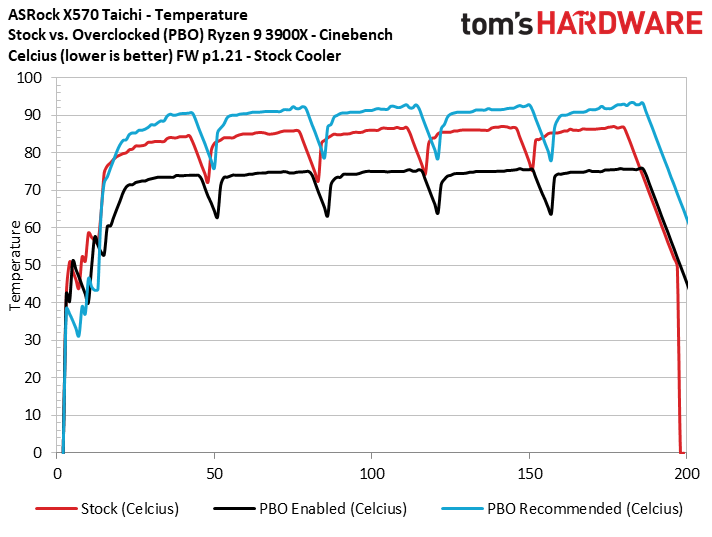
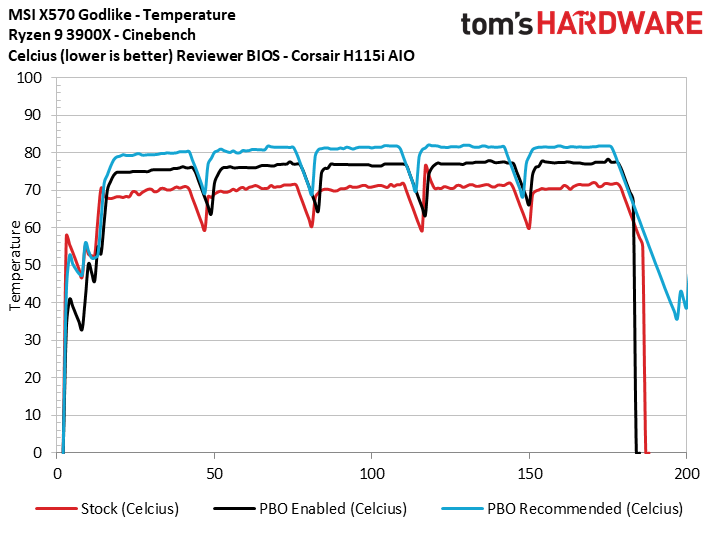
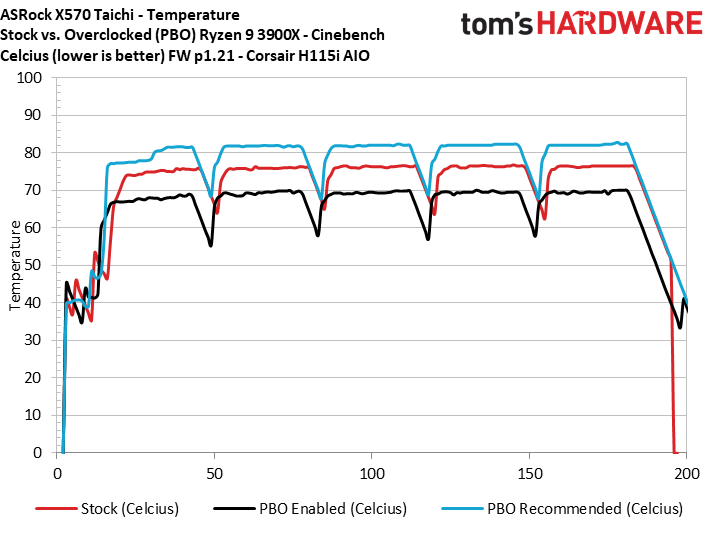
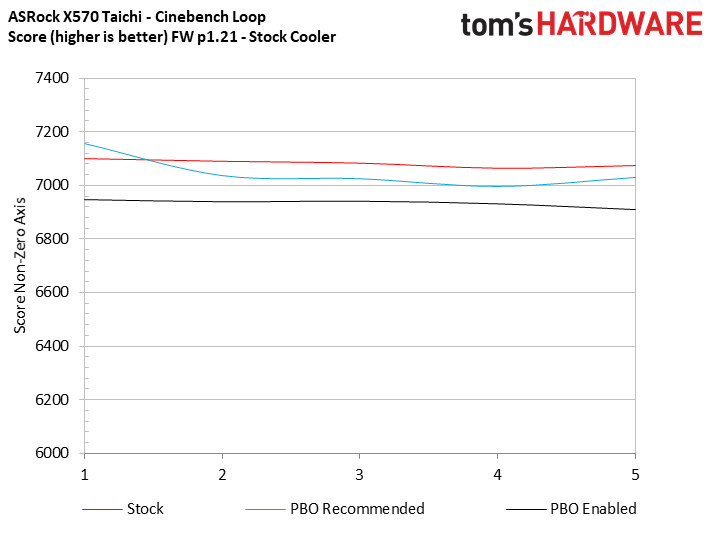
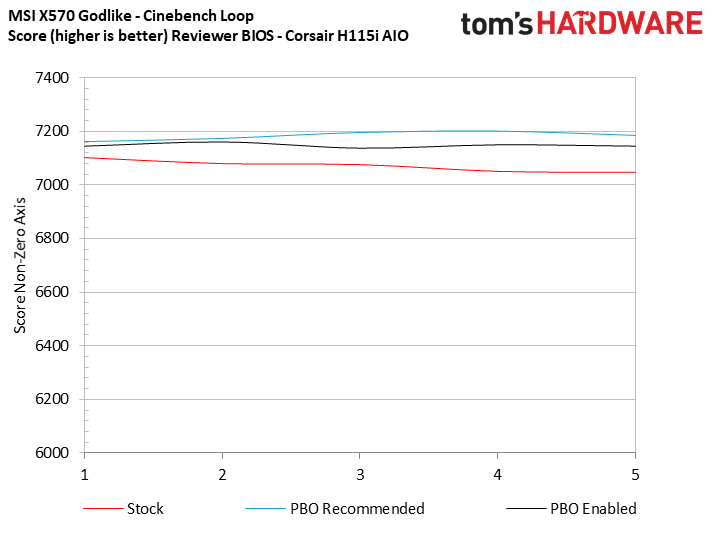
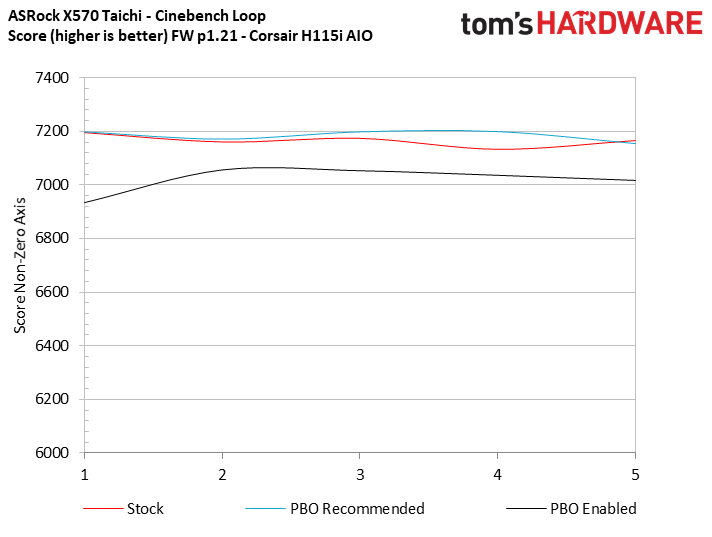
The impact to thermals is immediately obvious, with the PBO Recommended configuration producing far more heat (up to 92C) during the test with the stock cooler than the processors' stock settings. The 'PBO enabled' preset actually generates less heat on the ASRock board. It's noteworthy that the test with stock settings peaks in the 87C range during this test, but we'll outline lower temperatures with the Taichi motherboard in a series of tests with the latest available firmware.
Despite the higher heat and voltages from the PBO Recommended settings, the Taichi motherboard delivers less performance during the Cinebench run at stock settings. Now, PBO performance does vary based on the thermal headroom available to the chip, but it runs counter to our expectations to receive lower performance with overclocked settings.
For the Taichi, topping the 3900X with the Corsair H115i rectifies the disparity and provides the slimmest of performance gains with the tuned settings, but be aware that we're using a non-zero axis for the chart due to the remarkably slim deltas. There's an average uptick of 19 points, or a mere 0.24%. That surely isn't worth the increased voltage and thermals.
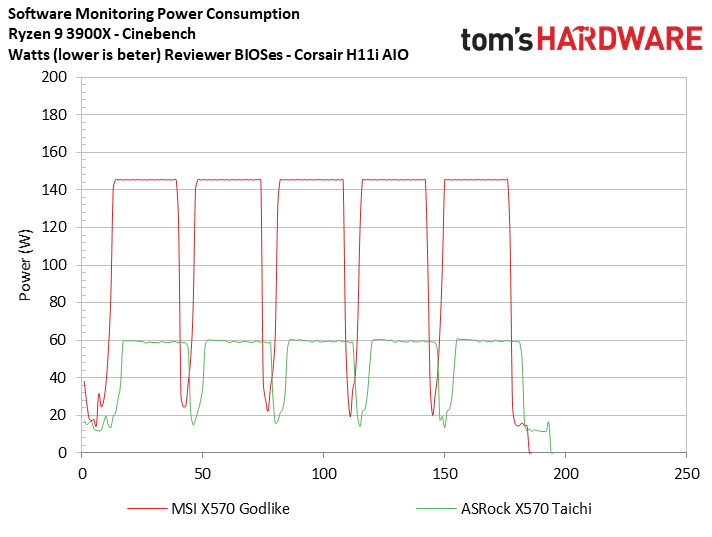
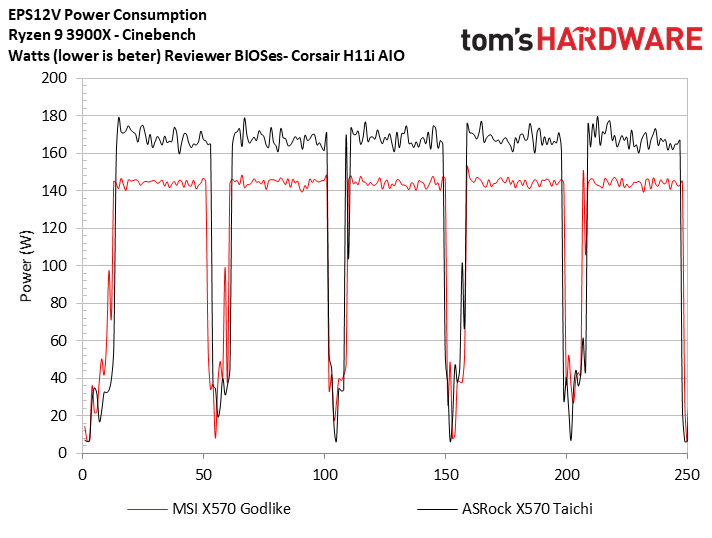
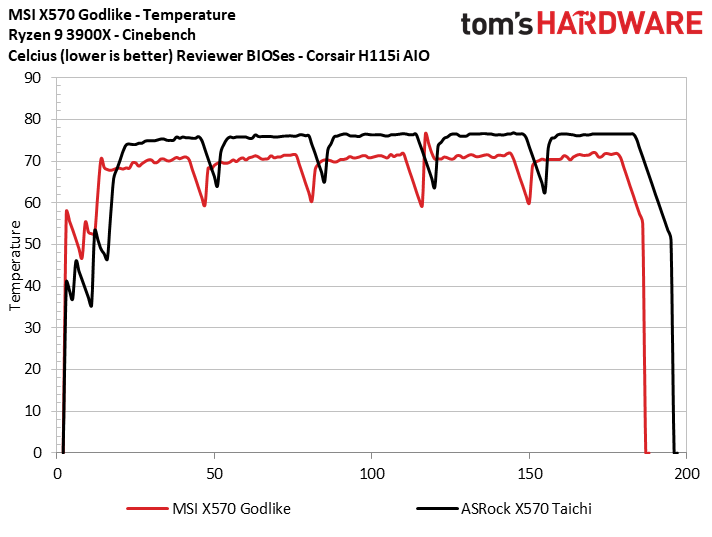
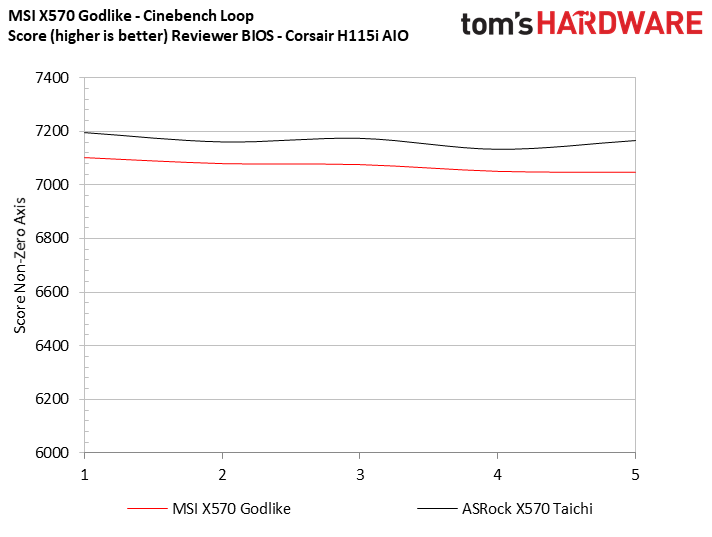
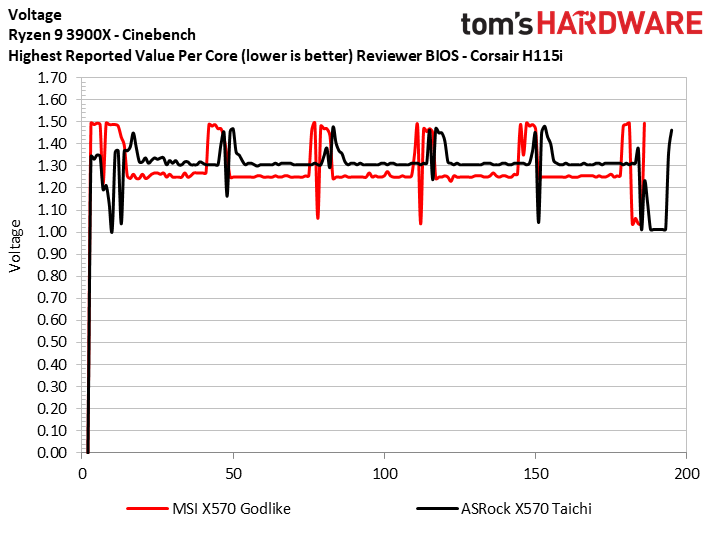
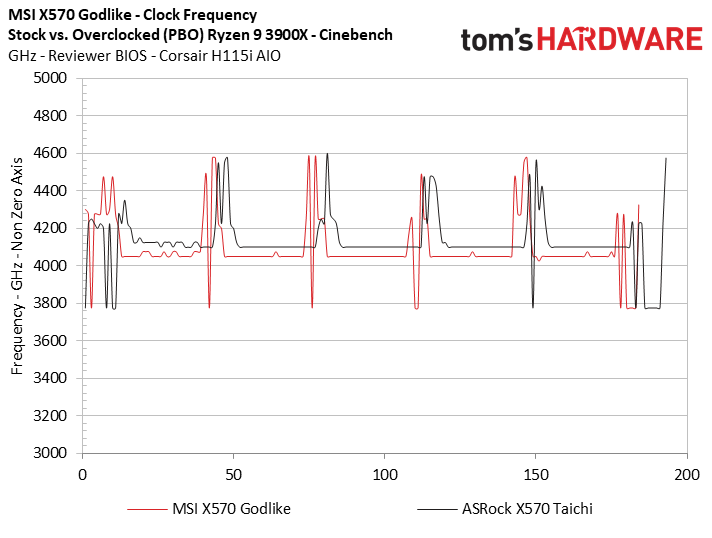
In this series of charts, we plotted the respective stock measurements with the reviewer BIOSes for both the MSI X570 Godlike and the ASRock X570. While each vendor obviously tunes its respective motherboard using many parameters, it's clear that the Taichi enjoys a performance benefit due to the misreported power telemetry. As a result, voltages, clocks, thermals and performance are all higher for the Taichi motherboard. Whether this is the result of an honest mistake or just overzealous tuning for the sake of a performance edge is debatable, but the misreporting appears to have been corrected in later BIOS revisions, as we'll see below.
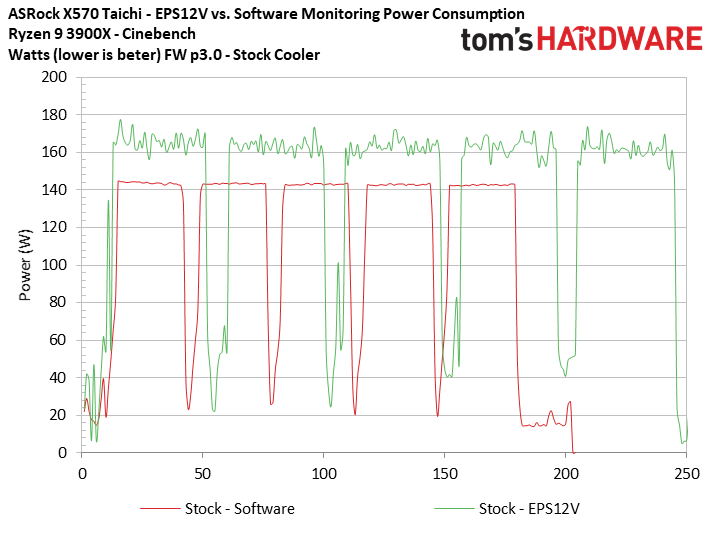
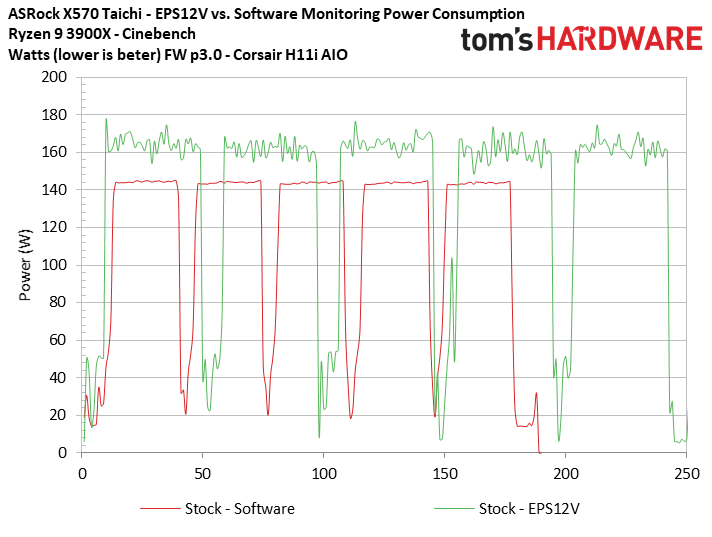
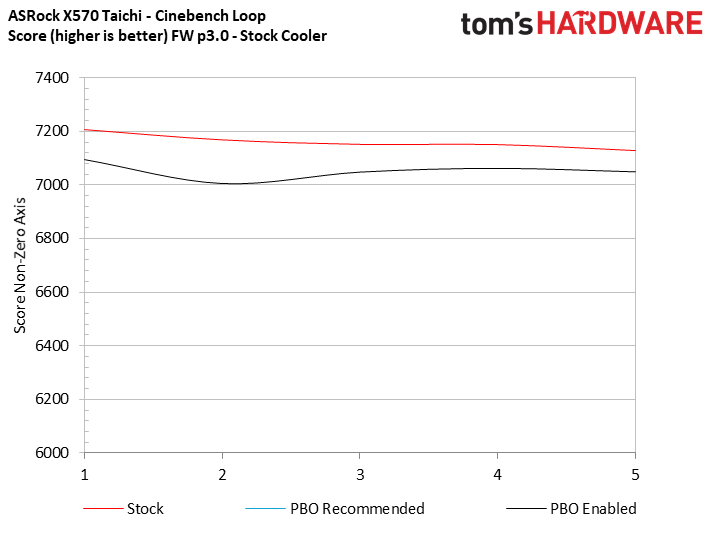
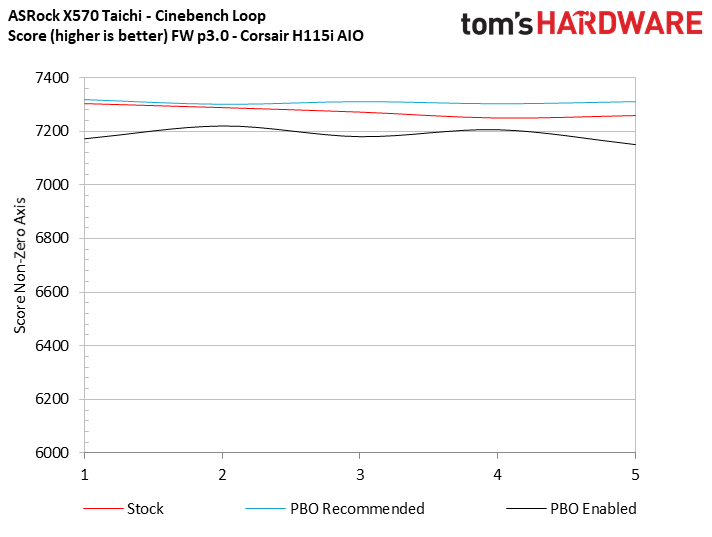
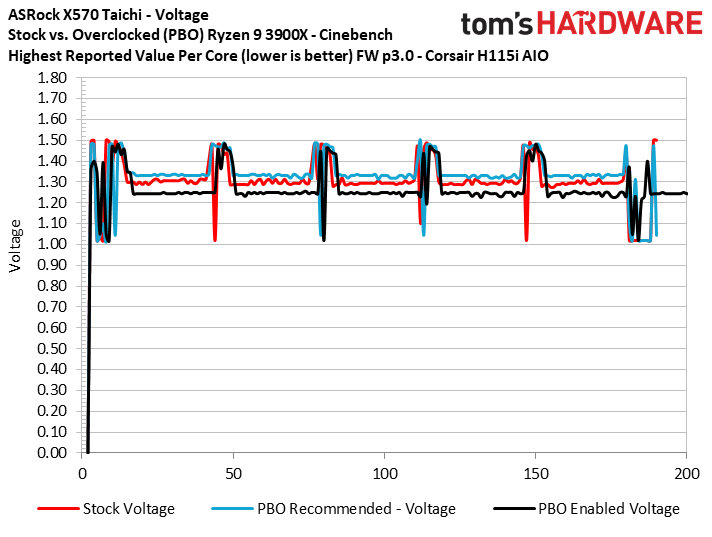
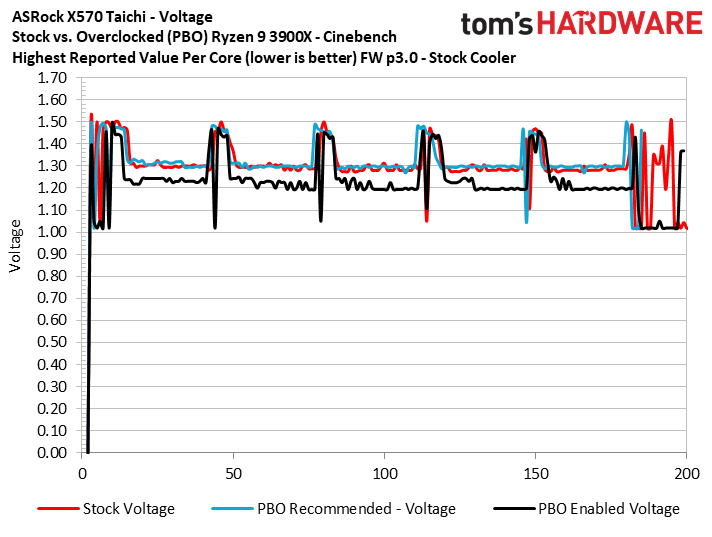
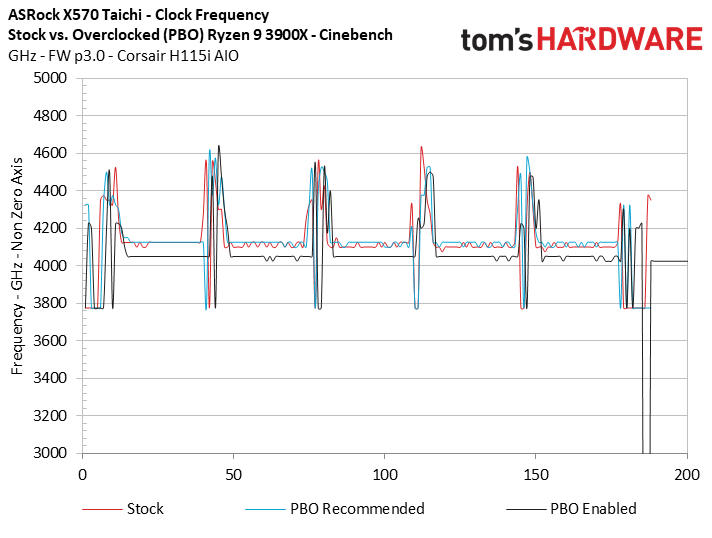
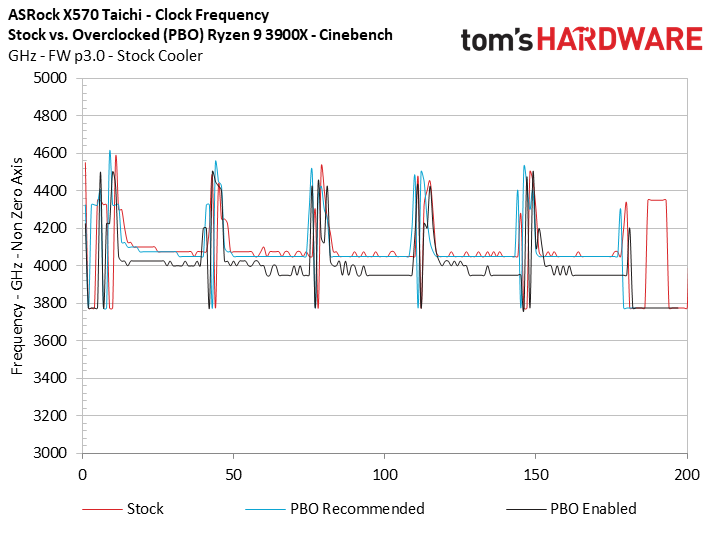
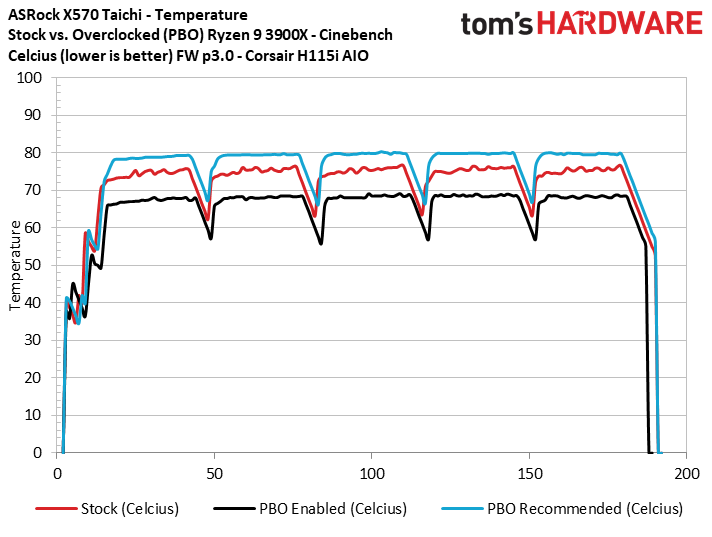
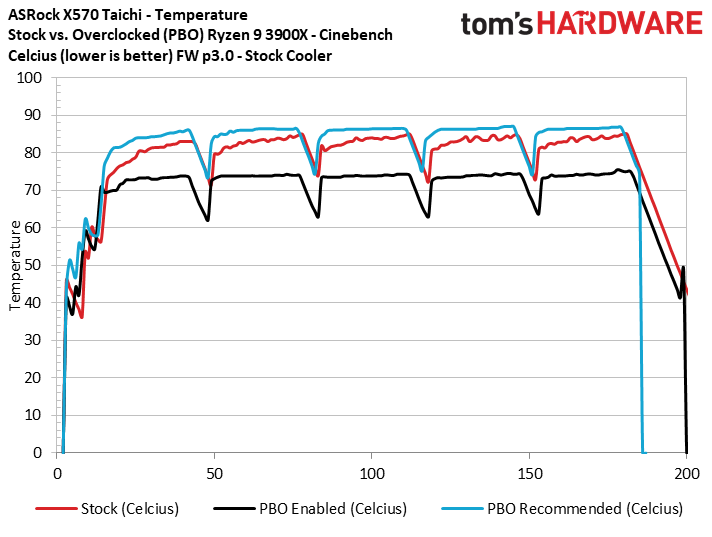
Here's a series of charts for the Taichi with the latest firmware available on its public site. Again, we used both the stock cooler and an H115i AIO for the two configurations.
The deltas between the power consumption reported by the SMU and the EPS12V connectors has been reduced tremendously. The chip still consumes up to 160W under load compared to the reported value of 142W, but we can chalk that up to the expected VRM losses from this particular motherboard.
According to the HWinfo utility, the Taichi motherboard is still feeding incorrect power telemetry data to the SMU—the utility lists the deviation at ~7%. However, our measurements align more with our expectations of VRM losses, so the HWinfo data could be a misreport. (It's still unclear exactly how HWinfo determines deviation.)
The reduced Cinebench performance with the PBO settings when paired with the stock cooler also remain (the two PBO results overlap one another in the chart), while topping the chip with the H115i produces similar slight wins for the PBO Recommended configuration. The PBO Enabled configuration remains slower in all cases.
It's important to note that even with the adjusted power telemetry data, the power consumption we measured at the EPS12V connector remains in the low 160W range, which is fine given the expected VRM losses.
Gigabyte X570 Aorus Master
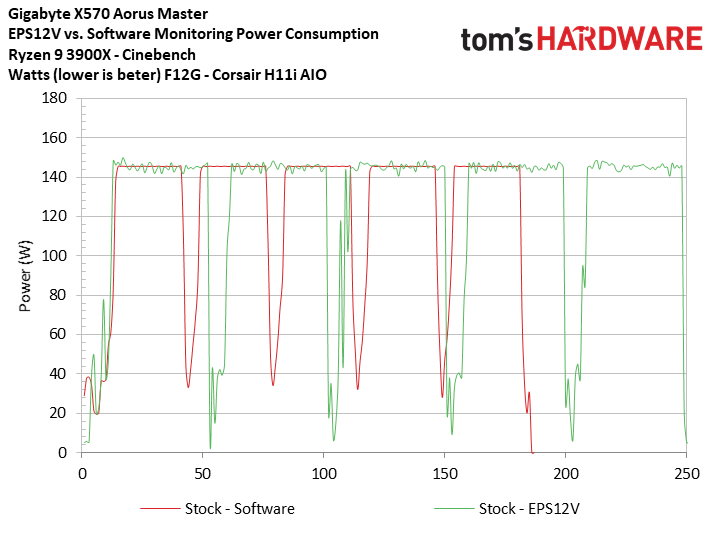
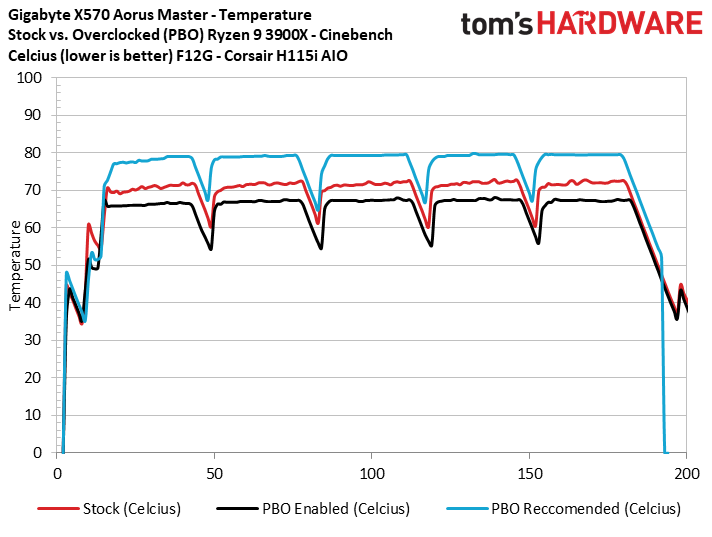
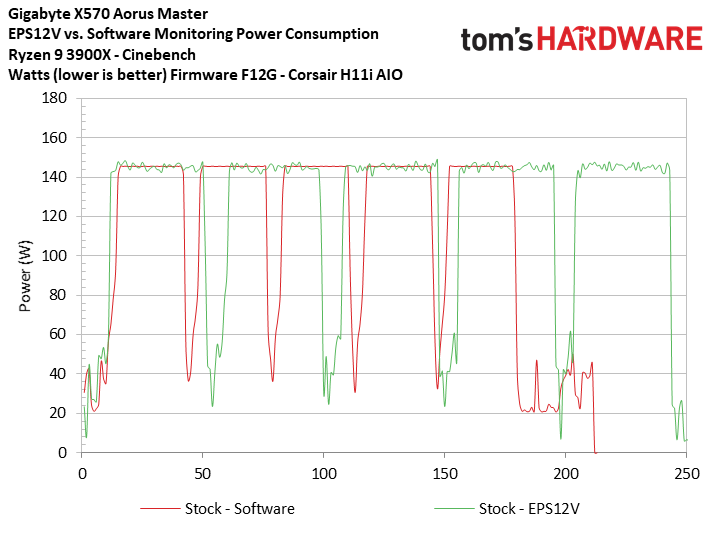
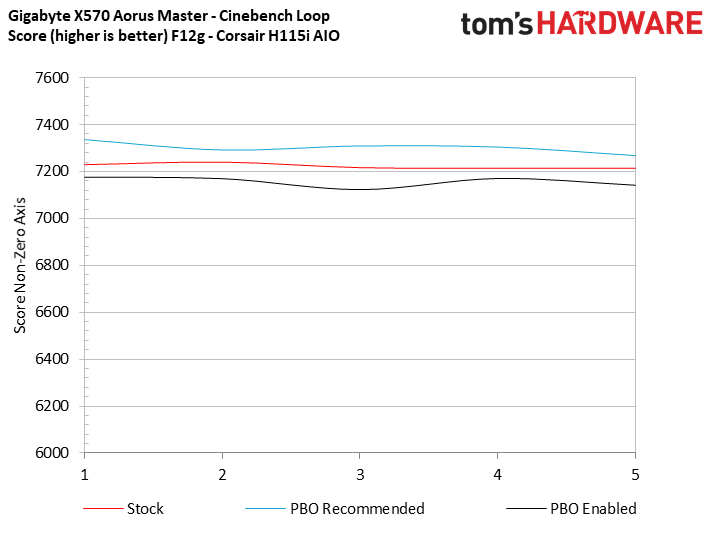
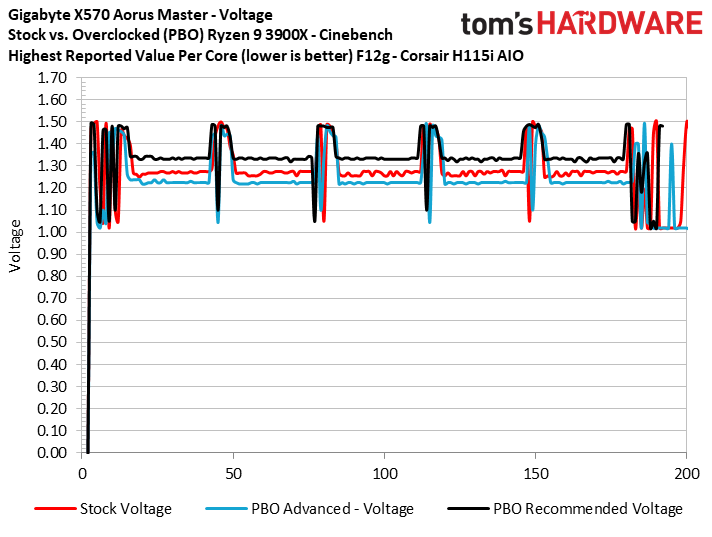
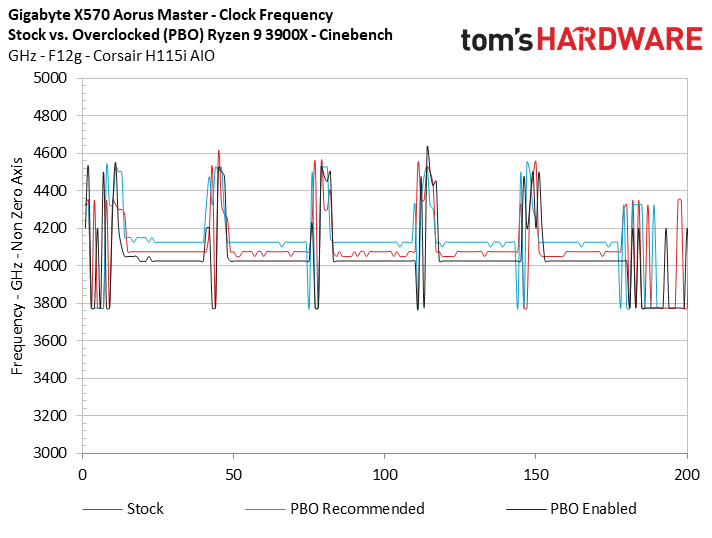
We have one other X570 motherboard in the lab, the Gigabyte X570 Aorus Master, so we gave it a spin through the same series of tests to gauge how it lands on the accuracy scale with the latest BIOS. We also wanted to see if it exhibits the same performance trends with the various PBO settings. The Aorus Master also tops out near 142W of power consumed, which aligns nearly perfectly with the software measurements. Given that we don't expect perfect efficiency figures from the power delivery subsystem, this implies the power reporting isn't optimized on the Aorus Master, creating a situation much like what we saw with the Godlike X570 - over-reporting that can actually lead to slightly reduced performance. We've pinged Gigabyte on the matter.
However, even without an obvious misreporting (probably over-reporting) of the power telemetry data, we still encounter the same condition of reduced performance when activating the PBO Enabled preset. It is noteworthy that the Aorus Master responds well to manipulating the Scalar variable and delivers more performance. We've also outlined the issues with the standard PBO profile to Gigabyte. The company has replicated the condition and is investigating further.
The "Control": MSI X570 Godlike
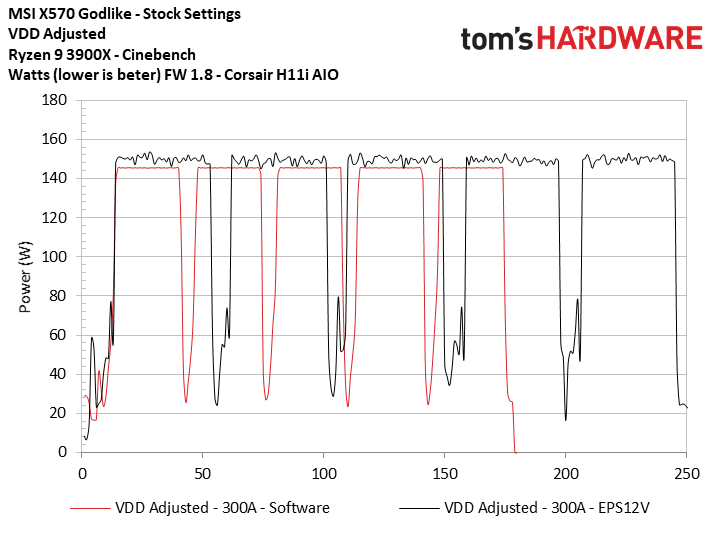
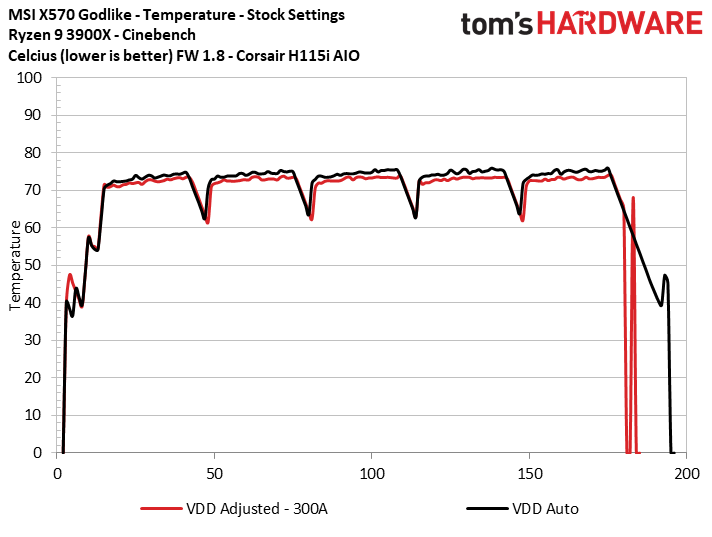
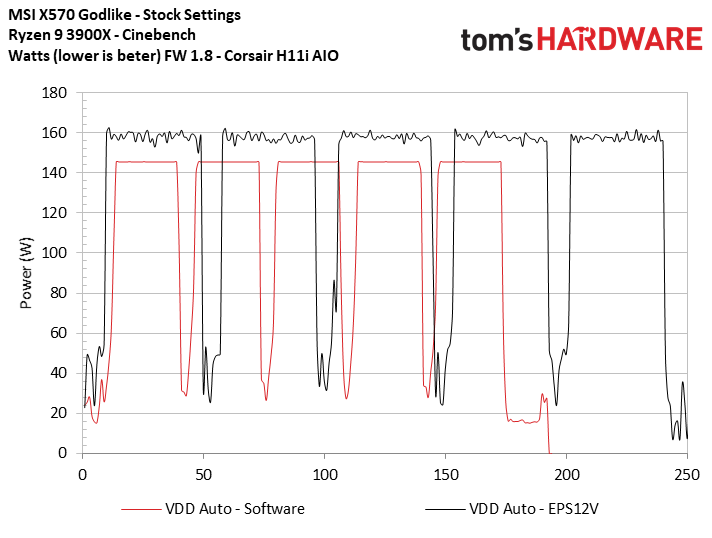
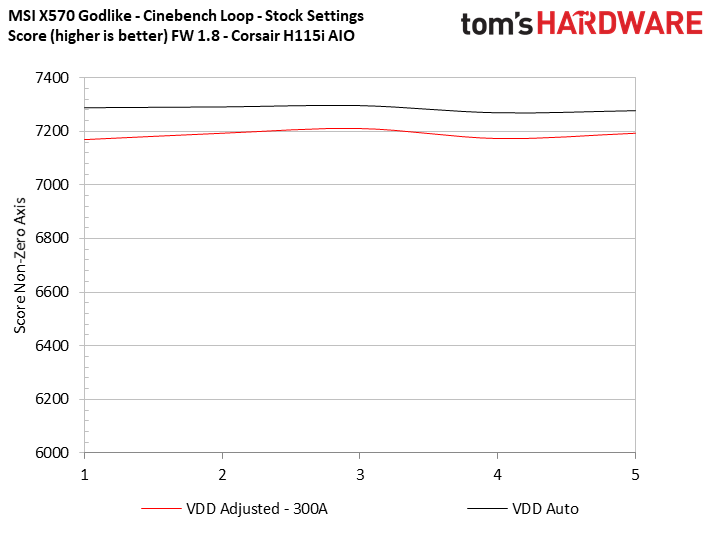
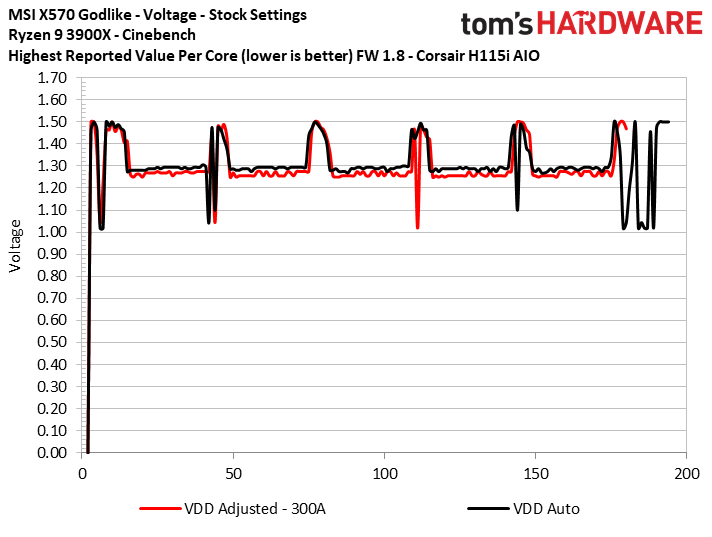
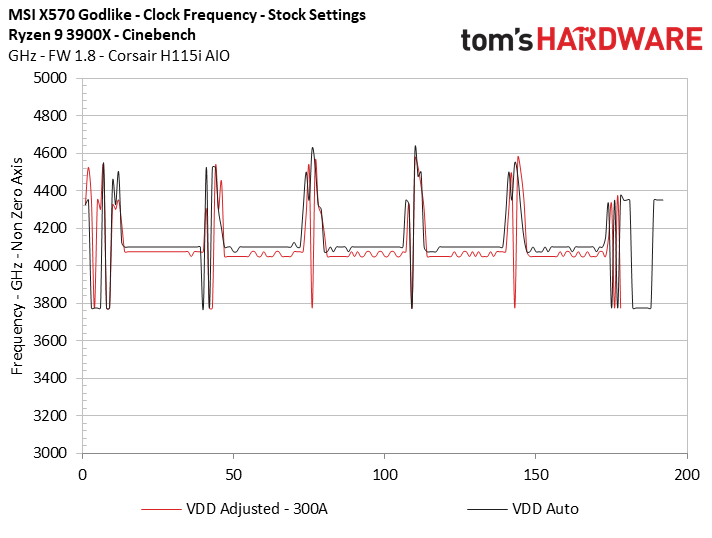
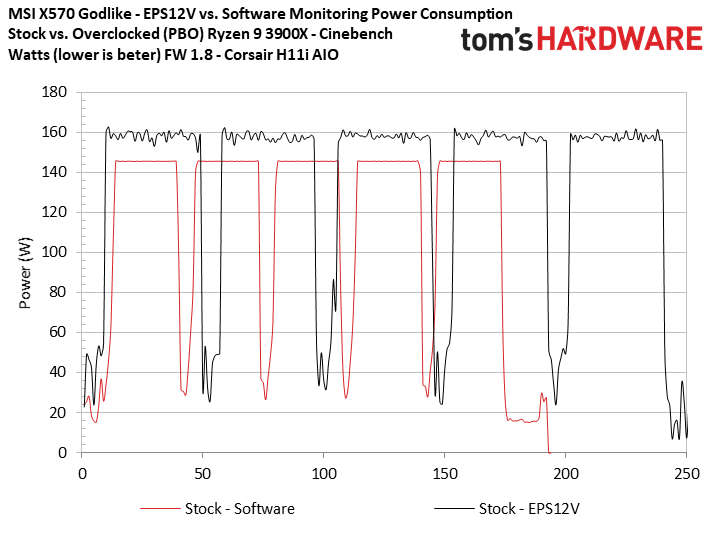
The MSI X570 Godlike is the lone motherboard we have in the lab that allows us to adjust the parameter that is responsible for altering telemetry data: CPU VDD Full Scale Current. This setting appears to default to 280A on the Godlike with the latest publicly available non-beta BIOS (1.8). Remember, the company says its value is accurate given fine tuning for its power delivery subsystem, so we tested by adjusting the 300A (listed as VDD Adjusted in the charts) value recommended by The Stilt in his forum post.
The SMU-reported and EPS12V measurements align closely in the first chart, which outlines the results of our 300A adjustment. The second chart, measured at stock settings with no VDD adjustment, clearly shows a delta between our recorded values and the reported power consumption, which now pegs at roughly 160W as opposed to roughly 140W with the adjusted VDD value. The behavior with the default 'Auto' setting is more in line with an expected result than the adjusted 300A values. In contrast, the adjusted 300A value shows almost no losses due to VRM inefficiency, which would be nice if true. But it isn't.
HWinfo hasn't shared information with us to clarify how it measures deviation, so the tool is a bit of a black box. The HWinfo tool reports a variance of 12% with the auto VDD settings above, implying that the tool makes its decisions based on reference full scale current values, and not those optimized by vendors.
In the third slide, the adjusted 300A VDD setting results in lower heat, and the successive charts cover reduced voltages, frequencies, and performance associated with the adjustment. We're more inclined to believe that, based on the physical measurements we've taken and the normal amount of expected VRM efficiency losses, MSI's auto VDD settings are closer to reality than suggested by the HWinfo deviation metrics.
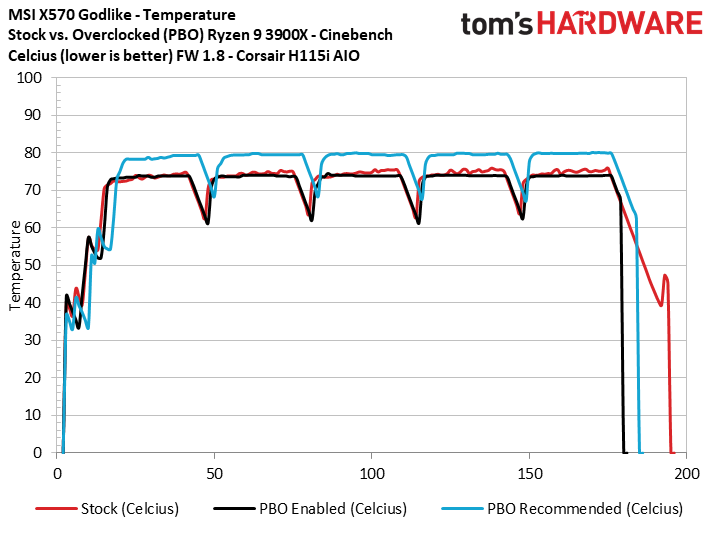
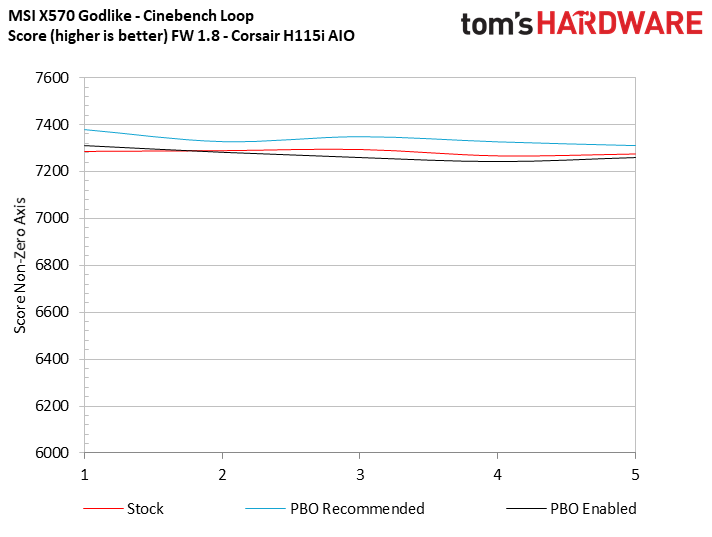
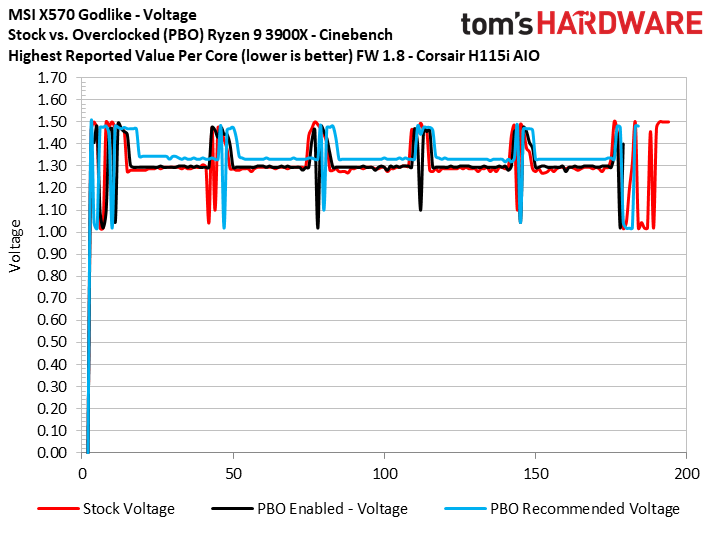
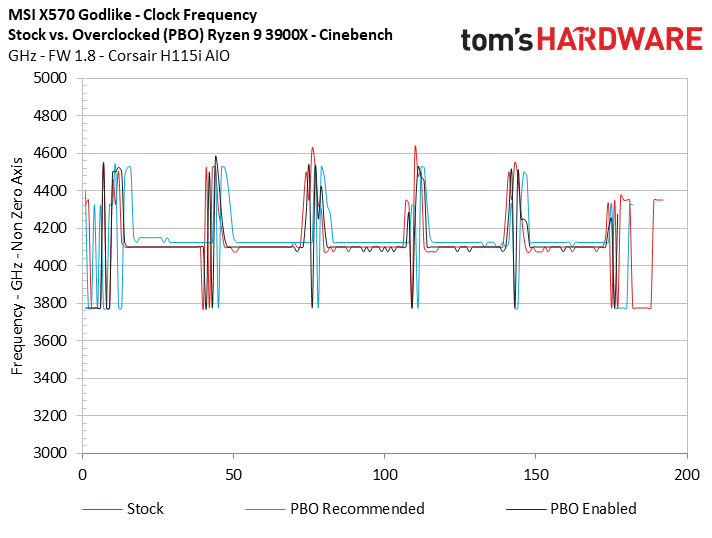
We went ahead and plotted our now-standard battery of tests with the new Godlike firmware, leaving the VDD setting to Auto. The motherboard exhibits many of the same tendencies we see with the other boards with AMD's PBO presets. However, it does fare considerably better than other boards with the PBO enabled profile, merely matching the stock settings in most metrics.
Final Thoughts (For Now)
Modern chips rely upon accurate telemetry data, and HWinfo's new deviation feature helps shine a light on how some motherboard vendors have found a way to misreport power telemetry. Unfortunately, the inner workings of the tool aren't entirely clear, and HWinfo doesn't specify how it assigns the deviation value. From our testing, it appears the tool doesn't take what we would consider legitimate adjustments to the full scale current into account, which causes inflated deviation readings.
According to our sources, AMD has load generation tools that help motherboard vendors define reference values for power telemetry reporting, but those are more general settings that assume a ~5% overhead for the tolerance of VRM components. In practice, the tolerance can be up to 10%. As a result, motherboard vendors can fine tune the telemetry reporting for their unique power delivery systems, thus ensuring the correct amount of power delivery to the chip. The HWinfo deviation metric doesn't appear to take into account what we consider rational adjustments to power telemetry reporting. It appears, at least on the surface, that HWinfo's tool measures from some understanding of the reference values, but its method is unclear. The deviation metric is still a work in progress, but we noticed quite a bit of variation with some measurements, so your mileage may vary.
It's possible that intentionally manipulated power telemetry reporting can expose an extra performance edge and go undetected by both reviewers and common users alike, leading them to post erroneous power consumption results. We saw a pretty egregious example of incorrect reporting in our testing with a BIOS provided to reviewers that is also available to the public, so it remains important for reviewers to use physical power measurements to validate the results they get from software utilities. In fairness, we'd expect a more subtle change than what we observed with the Taichi reviewer BIOS if the company was out to trick reviewers, so it's debatable whether or not the changes to reporting were intentional. We even found a few motherboards that misreport power in a way that reduces performance.
AMD's auto-overclocking Precision Boost Overdrive (PBO) feature often causes performance losses in some workloads if you use the vendor-defined basic preset values, but the severity varies from motherboard to motherboard. We set out to use the PBO values as a reference for what unsafe settings look like (it does invalidate your warranty), but in many cases found the basic PBO presets resulted in lower performance. They need some work and currently aren't a good measuring stick. Even on motherboards that correctly report power, the basic PBO presets didn't provide any tangible benefit.
In contrast, manual changes (which we covered above) to the Scalar setting provide performance gains, and those are the better reference point for unsafe settings. The Taichi reviewer BIOS suffered from the worst misreporting, but it didn't result in power settings that match or exceed the settings imposed by our PBO profile with higher Scalar settings.
Misreported data can cause the CPU to run a bit harder (and hotter) during normal operation, but you shouldn't be too worried about the amount of power applied to your chip if your board is misreporting the telemetry data, though it does result in higher power consumption, voltage, heat, and clock speeds.
It's best to leave the assessment of the impact on Ryzen chip longevity to AMD or other semiconductor professionals that work in the reliability field, as a wide array of factors impact those metrics. Reliability metrics are based on modeling and information that we'll never see, and a complex matrix of factors also work into the equation. In fact, we aren't aware of any publicly available information of even the workloads or duty cycles that AMD and Intel use to spec reliability metrics - and we've asked.
Some factors increase the rate of wear and trigger electromigration (the process of electrons slipping through the electrical pathways) faster, such as higher current and thermal density, but the impact of the two on one another doesn't scale linearly, and it varies depending on how long the processor stays in a heightened state.
A chip will age, and transistors will eventually wear out, even under optimal operating conditions. Still, while the increased power consumption we see due to the erroneous telemetry data could have an impact with heavily-used processors and reduce longevity, it boils down to how much the increased power and heat output speed the aging process.
It is plausible that there could be at least some impact to chip longevity due to manipulated power telemetry, but AMD's initial assessment is that it won't have a meaningful impact during the warranty period. We didn't find any glaring problems that would be cause for immediate alarm, and AMD's internal mechanisms work well to protect users from settings that would cause catastrophic failures. The company's engineering teams have also obviously studied the matter to some extent and haven't yet seen any adjustments that could result in significant degradation during the warranty period.
AMD's statement seemingly confirms that it wasn't aware of the manipulations. It will be interesting to see if motherboard makers end the practice, or if AMD finds that because the adjustments don't impact longevity in a meaningful way, the practice can continue. We'll keep an eye on newer BIOS releases as they trickle out for any significant changes to power telemetry reporting.

Paul Alcorn is the Editor-in-Chief for Tom's Hardware US. He also writes news and reviews on CPUs, storage, and enterprise hardware.
-
escksu The test is done with PBO enabled. Since PBO itself is overclocking, users do know that the CPU is being overclocked. However, the forum post claimed that this happens even without clocking done....Reply -
Gillerer Replyescksu said:The test is done with PBO enabled. Since PBO itself is overclocking, users do know that the CPU is being overclocked. However, the forum post claimed that this happens even without clocking done....
Did you read the article? (And not just skim thru a couple of slides?)
Stock tests are there. The two PBO test sets are used to provide a reasonable high-power comparison point, to gauge the "dangerousness" of voltage under-reporting at stock. -
TJ Hooker I may have missed them, but are there any results (specifically temperature) for the X570 Godlike or Aorus with stock cooler? I'd be interested to see how the temperatures compare for boards with accurate power reporting vs those that fudge the numbers. If you slap on a 280mm AIO it seems you'll be fine either way, but I think that one area where this could have a real negative impact on users is if you're trying to use a stock cooler but your CPU keeps overheating (because unbeknownst to you your motherboard is cheating and circumventing regular power/TDP).Reply -
Gillerer AMD CPUs will dial back frequency and voltage if the temperatures become too high - even before throttling. You'll just get less boost.Reply
That means that with the standard cooler, you'd see less extra power - regardless how low power numbers the motherboard reported. -
escksu Replyescksu said:The test is done with PBO enabled. Since PBO itself is overclocking, users do know that the CPU is being overclocked. However, the forum post claimed that this happens even without clocking done....
My bad, stock = PB2. Thanks for pointing out to me!! -
bgunner "AMD said that it was investigating the issue but doesn’t believe the chips will suffer excessive wear during the warranty period."Reply
Now with it written like this it seems that AMD only cares what happens during the warranty period but I don't know about y'all but I can't rebuild my system every year when the CPU goes out of warranty. -
Gillerer Replybgunner said:"AMD said that it was investigating the issue but doesn’t believe the chips will suffer excessive wear during the warranty period."
Now with it written like this it seems that AMD only cares what happens during the warranty period but I don't know about y'all but I can't rebuild my system every year when the CPU goes out of warranty.
I don't know how it's where you live but here all AMD (and Intel) processors come with a 3 year warranty.
I read that statement not as "we don't care what happens after warranty expires", but rather "we're confident the increase in degradation is negligible within the warranty period". The fact that this doesn't dramatically increase failure rates within the warranty period will carry over beyond that.