How To Check RAM Usage in Windows
Find out how much of your memory is free and what is taking it up.
Get Tom's Hardware's best news and in-depth reviews, straight to your inbox.
You are now subscribed
Your newsletter sign-up was successful
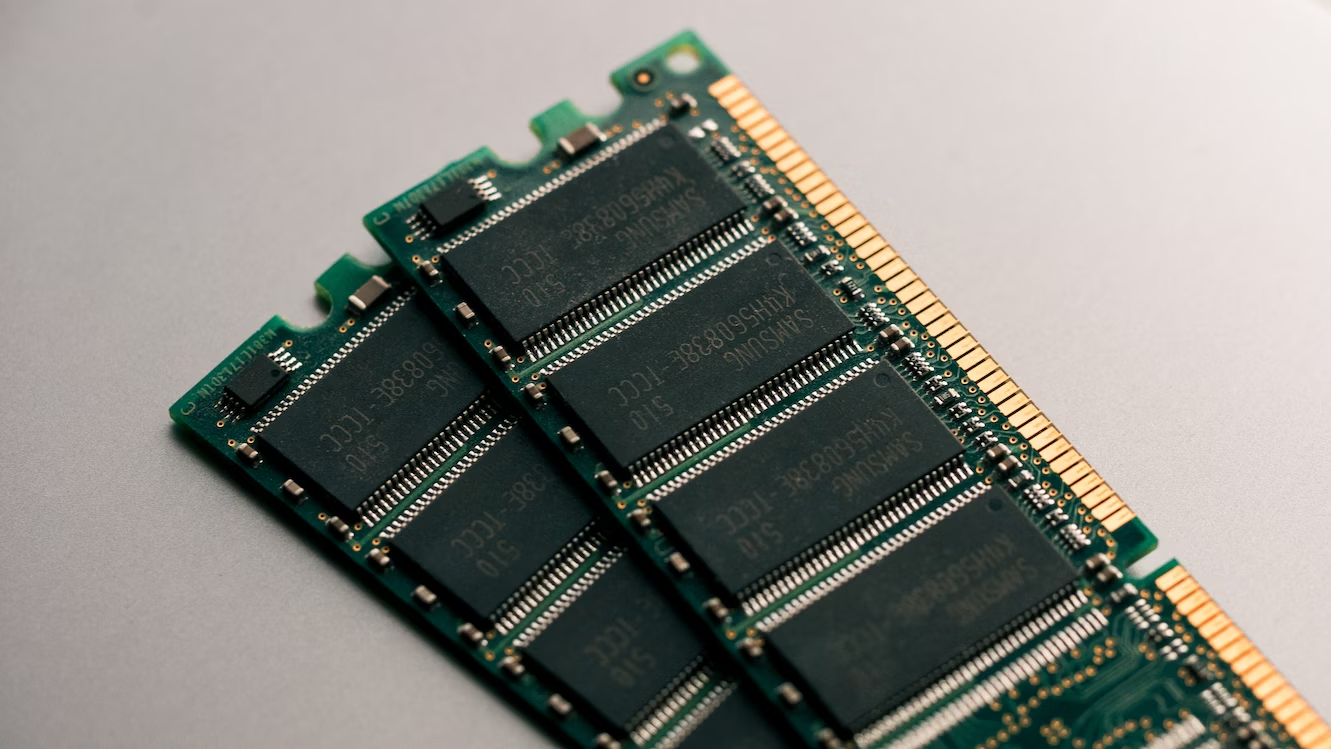
A computer's RAM or Random Access Memory provides a crucial middle ground between the (relatively) slow SSD or (definitely) slow HDD, and the CPU (Central Processing Unit). As long as your computer can fit all the software you’re using into your RAM capacity, you’ll get the best performance, but when you go over that allotment, things grind down to a halt.
That’s because once your computer’s memory is full, it’s forced to swap information between RAM and your slower secondary storage (e.g. an SSD or HDD). If you’re having performance issues and think it might be thanks to memory issues, or if you’ve been getting memory full error messages, or app crashes, here’s how you can check if your RAM is actually fit to burst or if the problem is somewhere else. If you’re also interested to see how your CPU is doing, you’ll want to read How to Check CPU Usage.
Check Memory Usage With Task Manager
Task Manager is the nerve center of Windows, where you can see how much memory each app is using on your system, and what your overall RAM usage looks like. Here’s how:
1. Press Ctrl + Shift + Esc. This will instantly open Task Manager. You can also use Ctrl + Alt + Del and then choose to open Task Manager, but this way is faster. If this is the first time you’re opening Task Manager, it will be in “simplified” view. Click on “More Details to expand it.
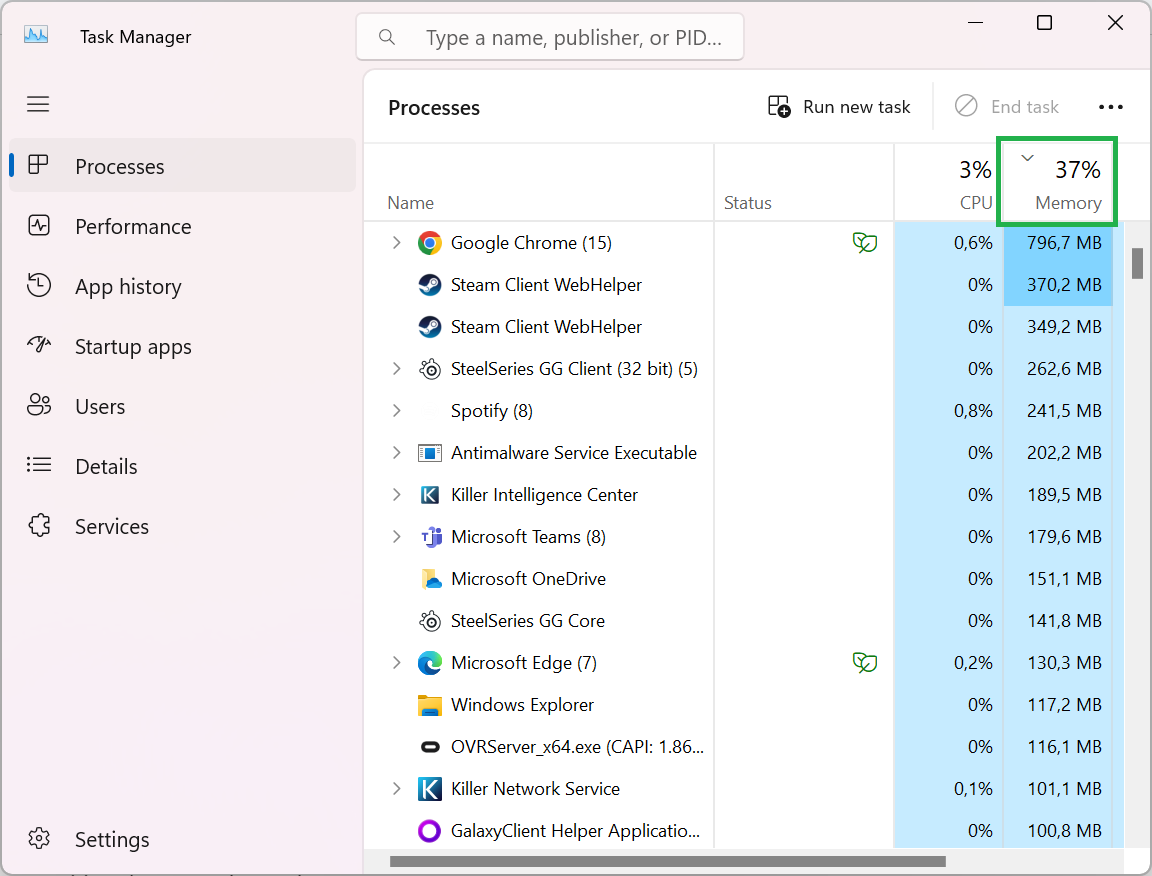
2. Look at “Memory” under the “Processes” tab. This will give you a global percentage of memory usage. If that number is at 100%, your RAM is overflowing.
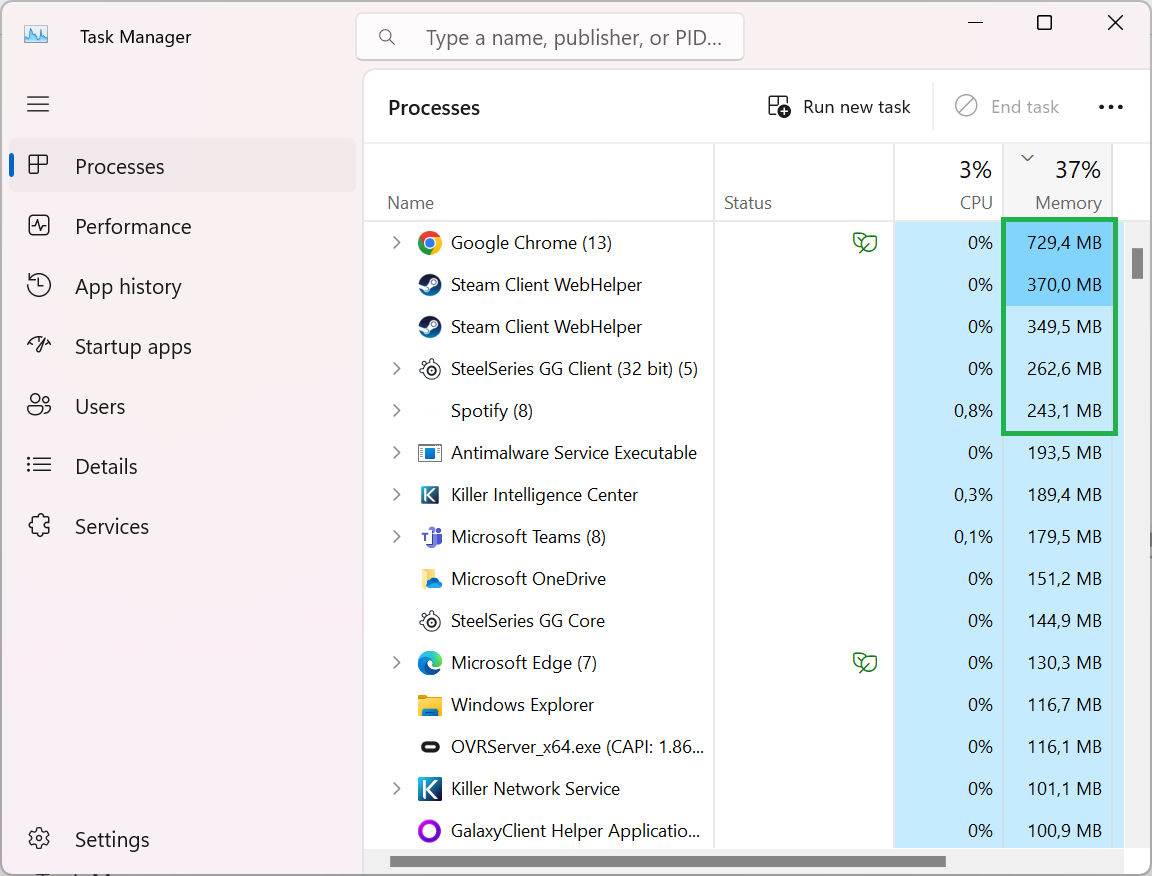
3. Click on “Memory”. This will arrange your processes in ascending or descending order depending on their current memory usage. This will put the biggest memory hogs at the top of the list. Bear in mind, that a program with lots of processes that add up to large memory amounts won’t be easy to spot this way. You’ll have to scroll down the list of processes and look for a bunch that are named similarly.
This is the quick and easy way to check your memory, but we can tease a little more detail from Task Manager:
Get Tom's Hardware's best news and in-depth reviews, straight to your inbox.
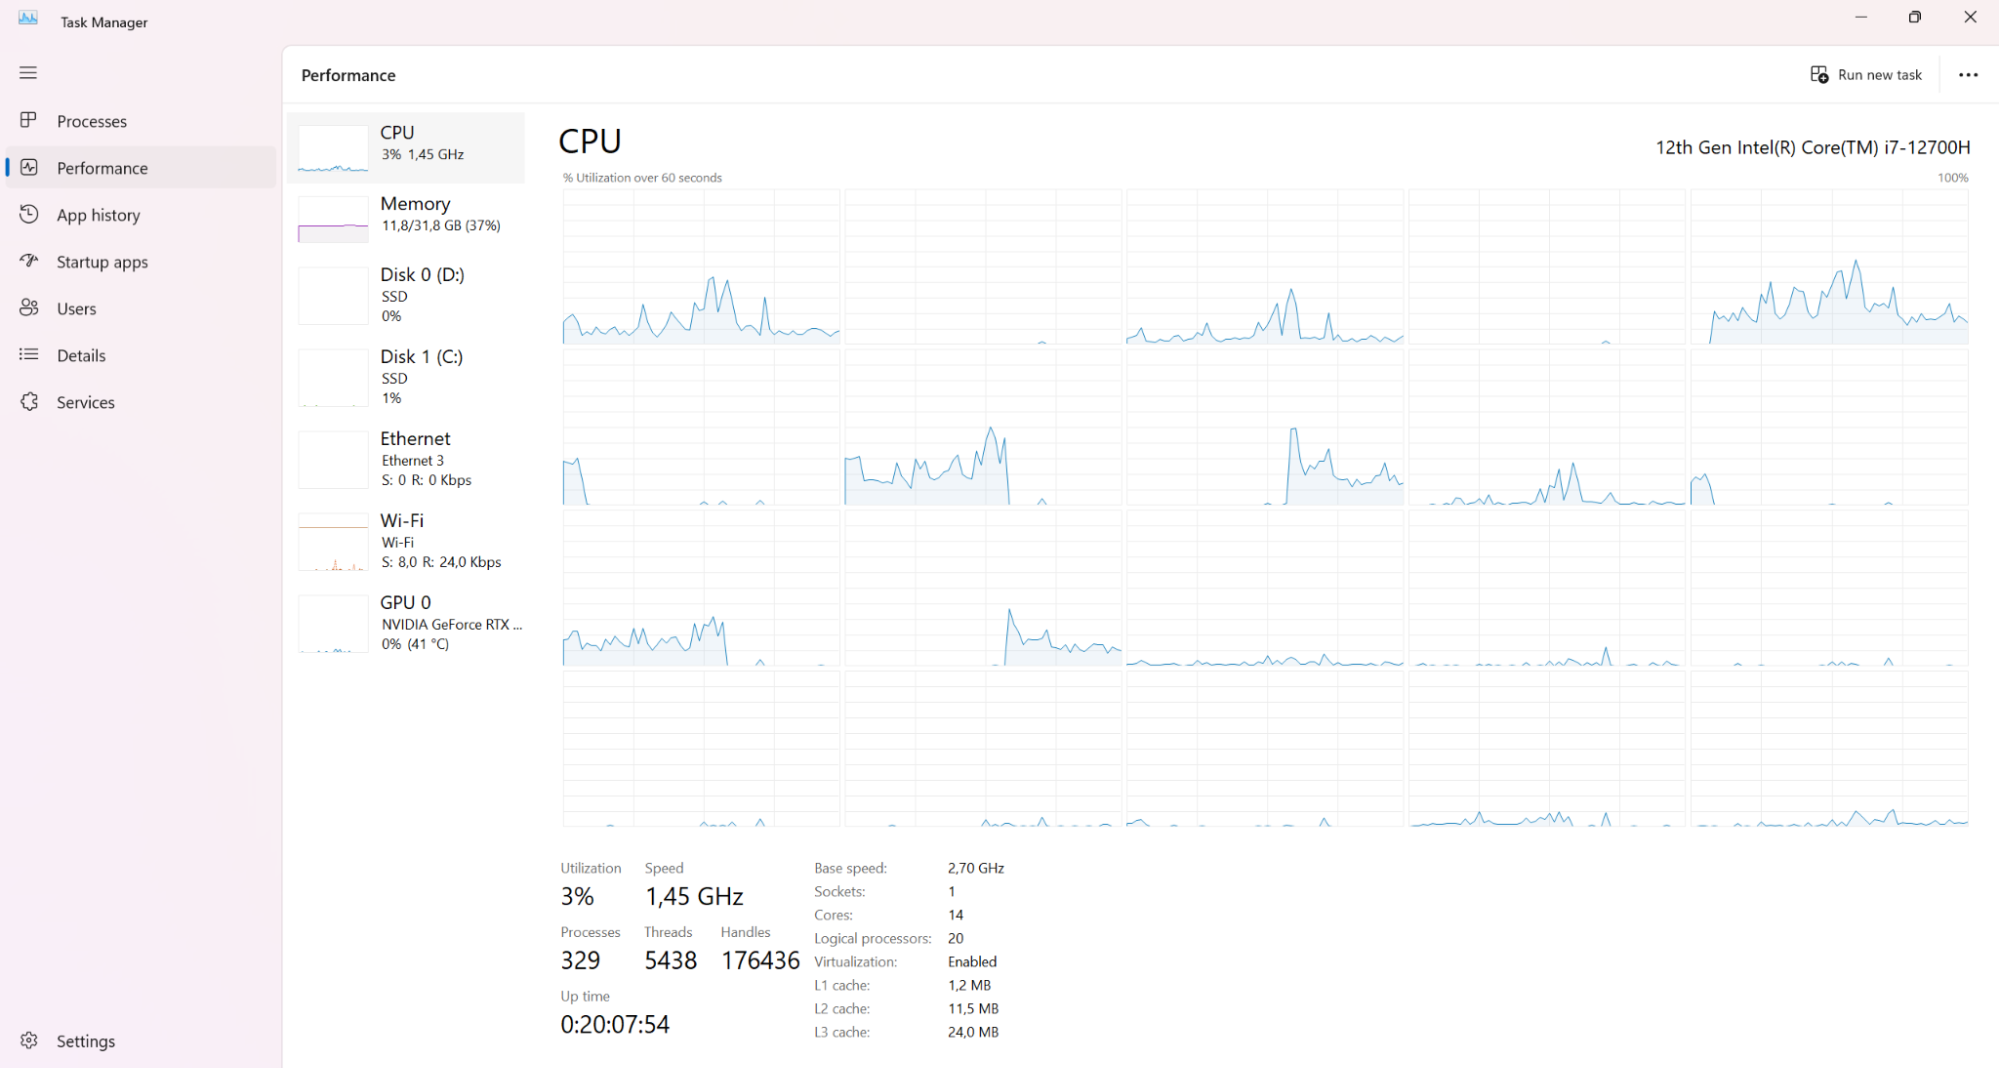
1. Click on “Performance”. This will open up detailed performance metrics.
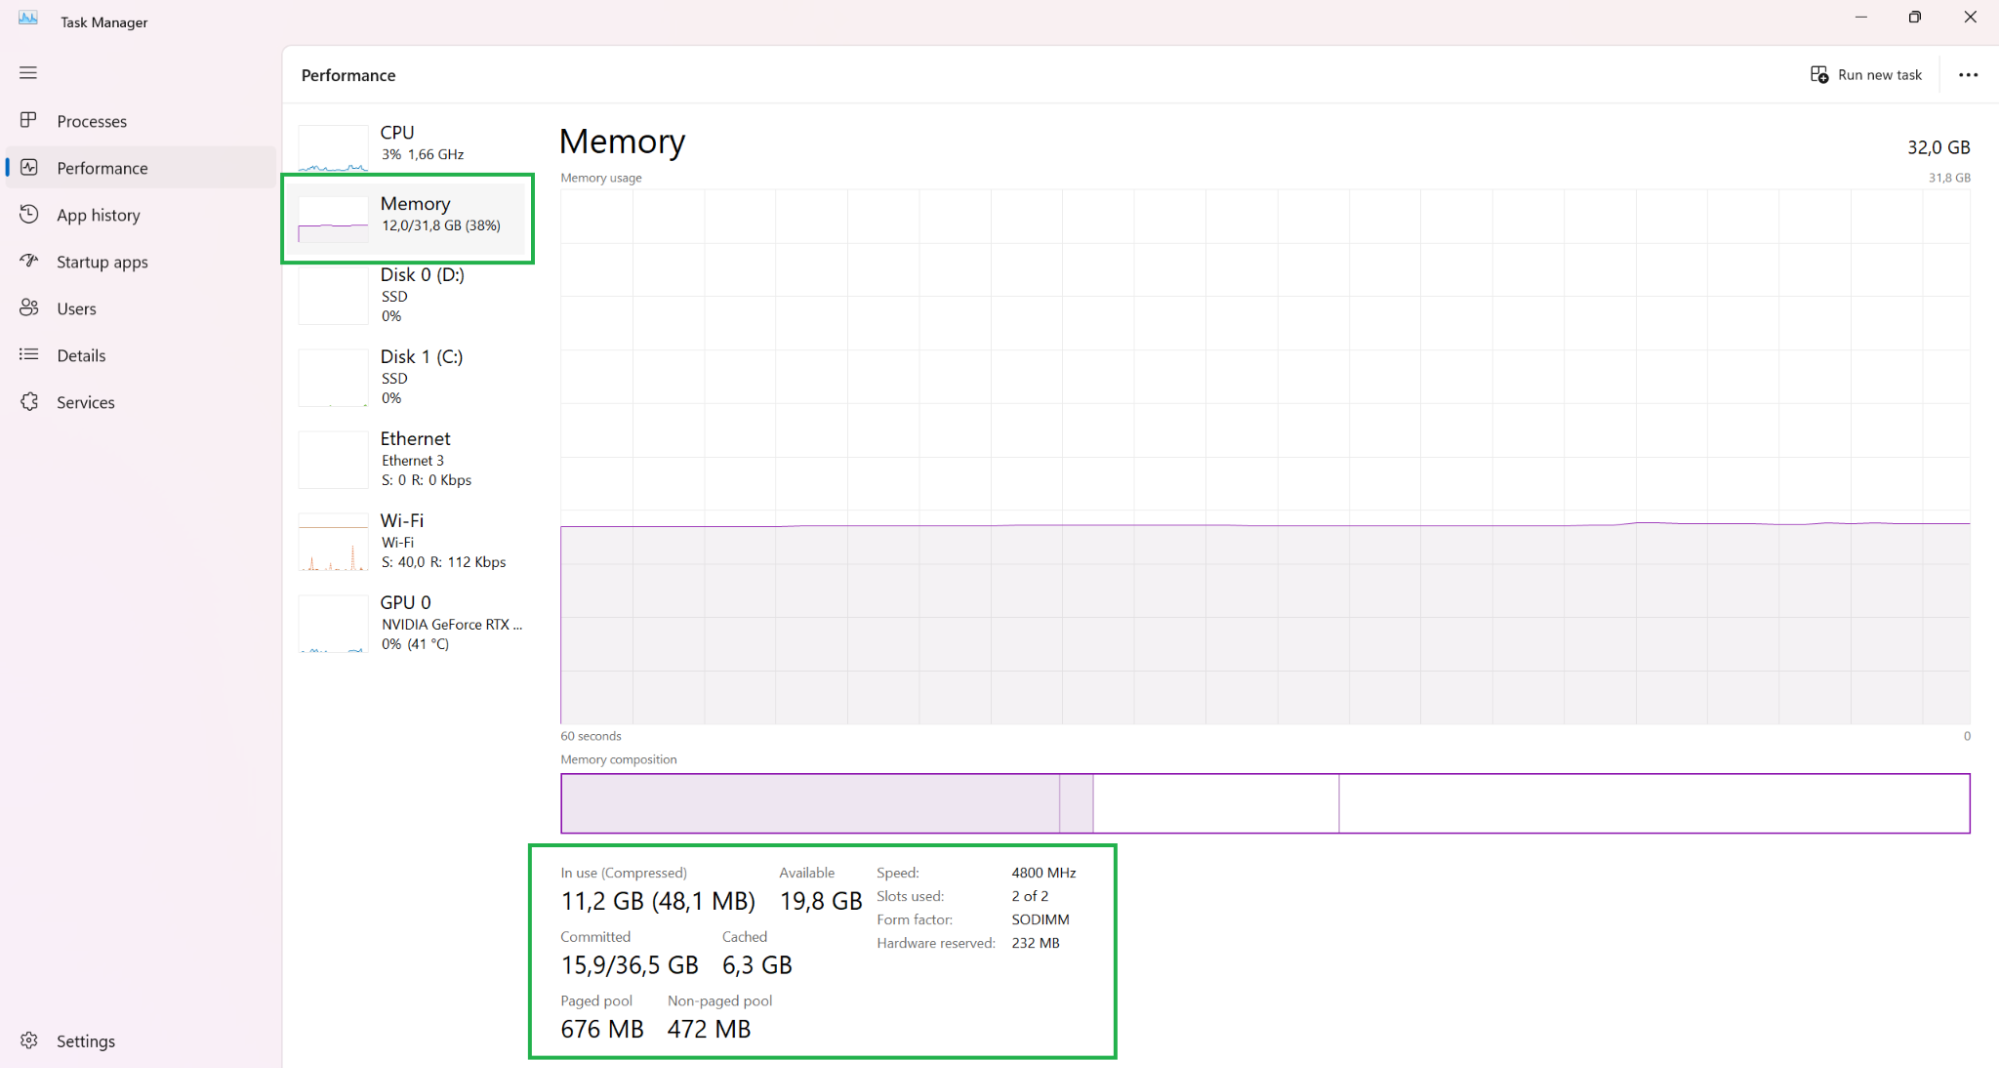
2. Click on “Memory”. This will show you a graph of memory usage over the last 60 seconds, as well as a breakdown of how the memory is allocated. E.g. “in use”, “available”, “paged pool”, and so on.
This is the way most people check memory usage is they want to know if their RAM is being hammered, but if you want to check memory usage while in game, there’s a better way to do it.
Check Memory Usage With Xbox Game Bar
If you want to check your memory usage while playing a video game, there are numerous utilities you can download that will do the job. However, Windows 10 and Windows 11 have a built-in utility that you can access in seconds - the Xbox Game Bar. Here’s how:
1. Open your game. We can’t use the Game Bar until you are in-game, so load up your level, hit pause, and then we can proceed.
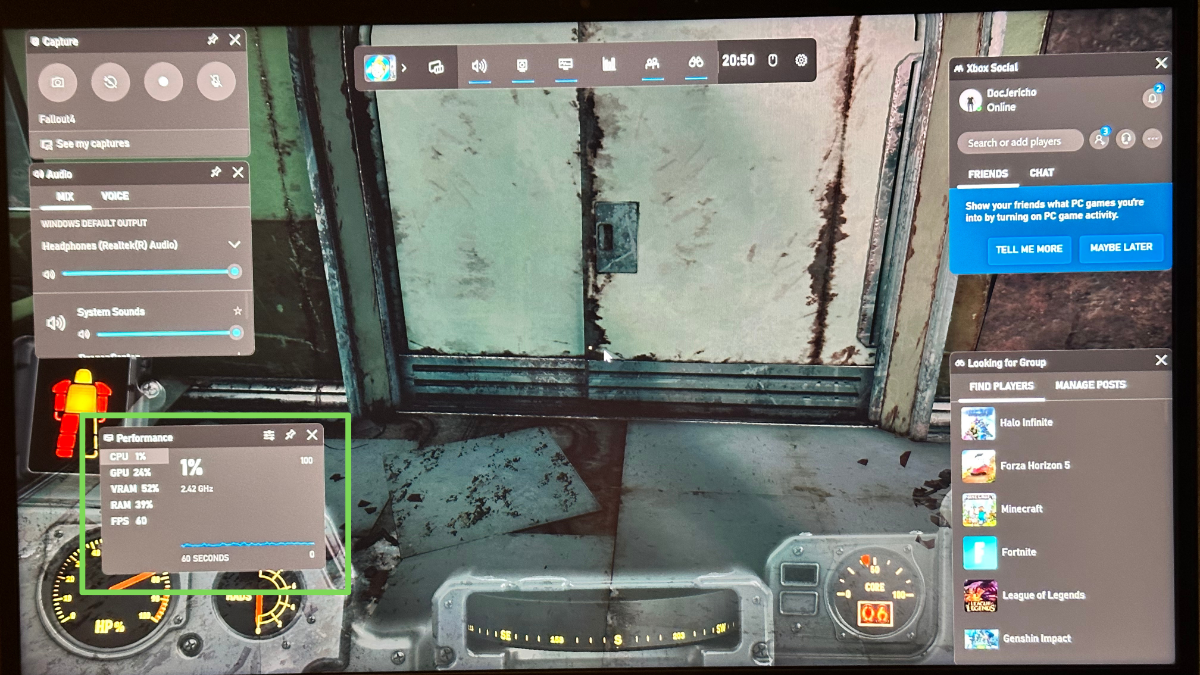
2. Launch Xbox Game Bar by Pressing Win + G.
3. Move the widget, if you prefer. Pick a spot where it won’t get in the way of gameplay.
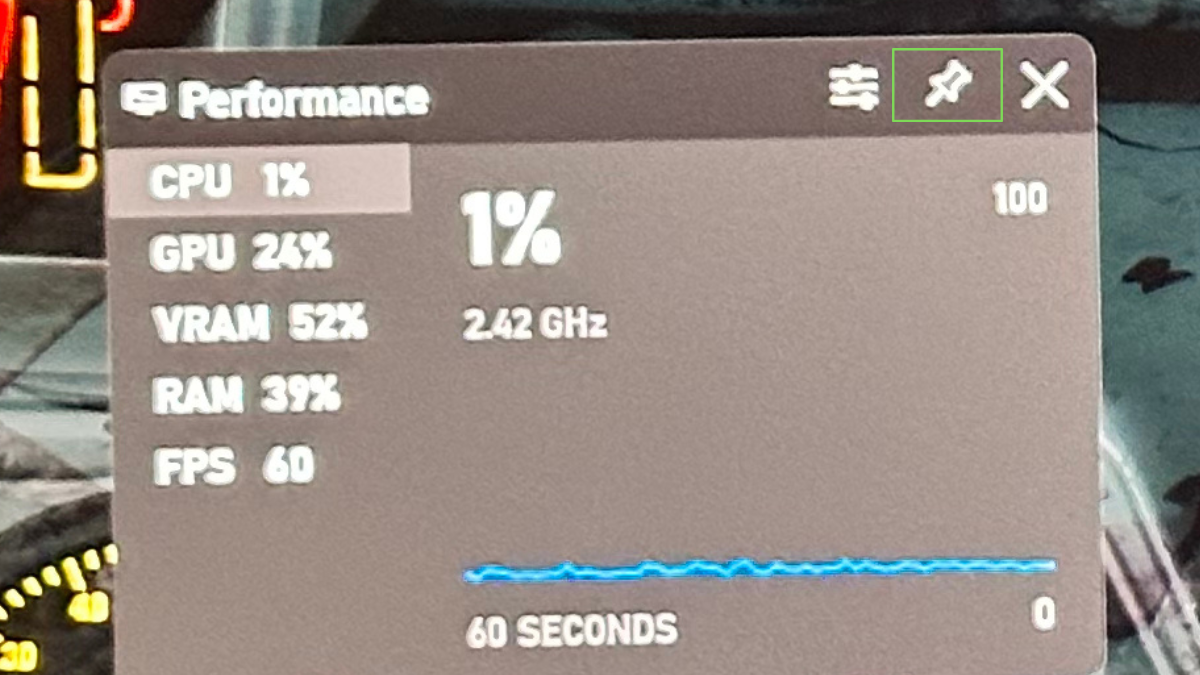
4. Click the Pin icon. Any widget you pin like this will stay on screen when you close the Game Bar.
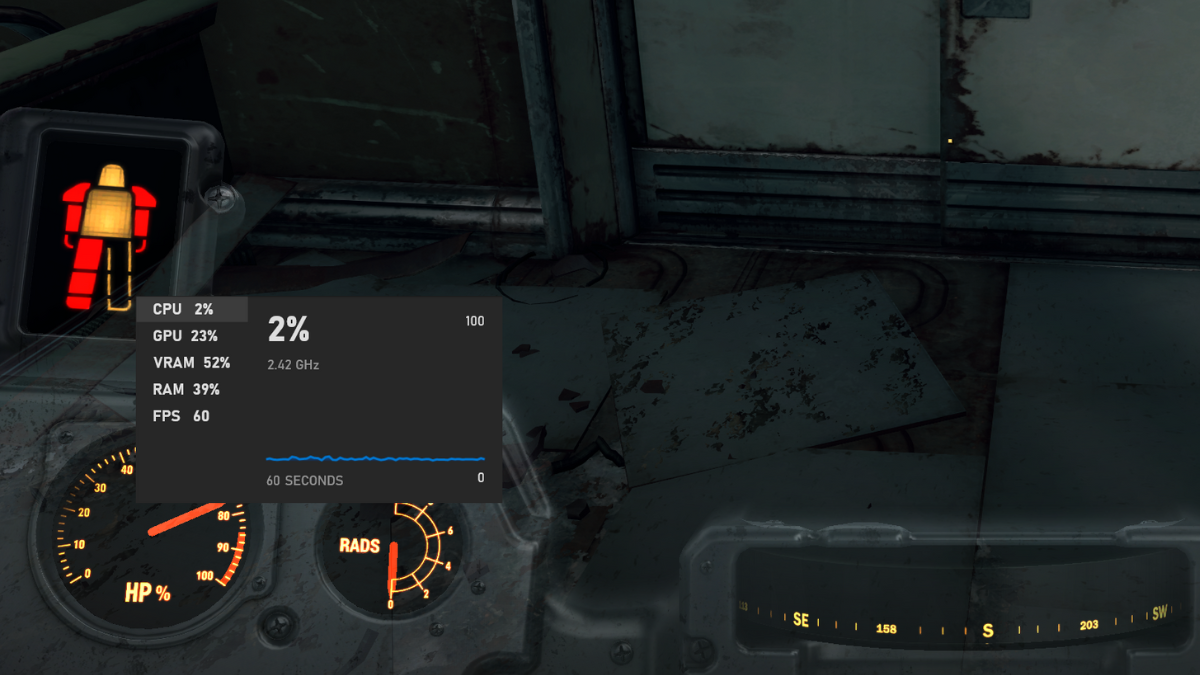
5. Close the Game Bar by pressing Win + G. If you’ve pinned the widget correctly, it should still stick around.
On the widget, you can see how much memory is in use (in total) next to “RAM.” You can also keep an eye on how much VRAM (GPU memory) is in use, and how hard your CPU and GPU are working. Handy!
Use Performance Monitor To Check Memory Usage Over Time
If you want to record your memory usage over time so that you can figure out if it may be scheduled applications that are eating memory at certain times of day, you can use the Windows Performance Monitor:
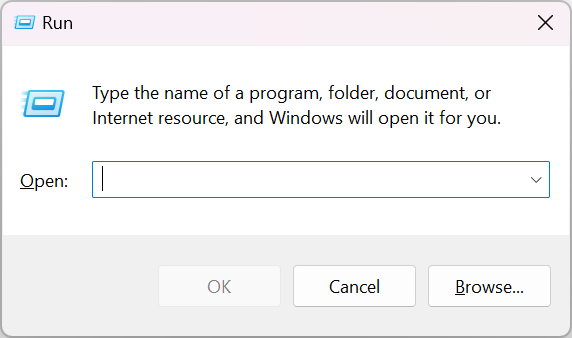
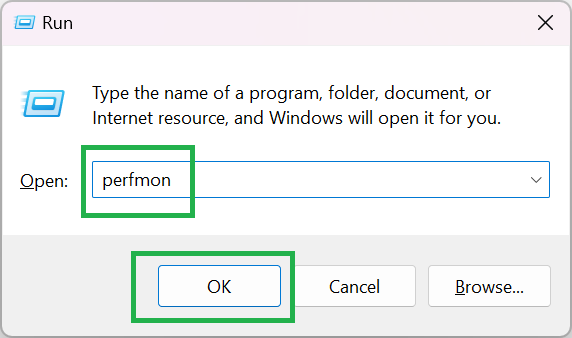
1. Press Win + R. This opens the Run dialogue box.
2. Type “perfmon” and press Enter.
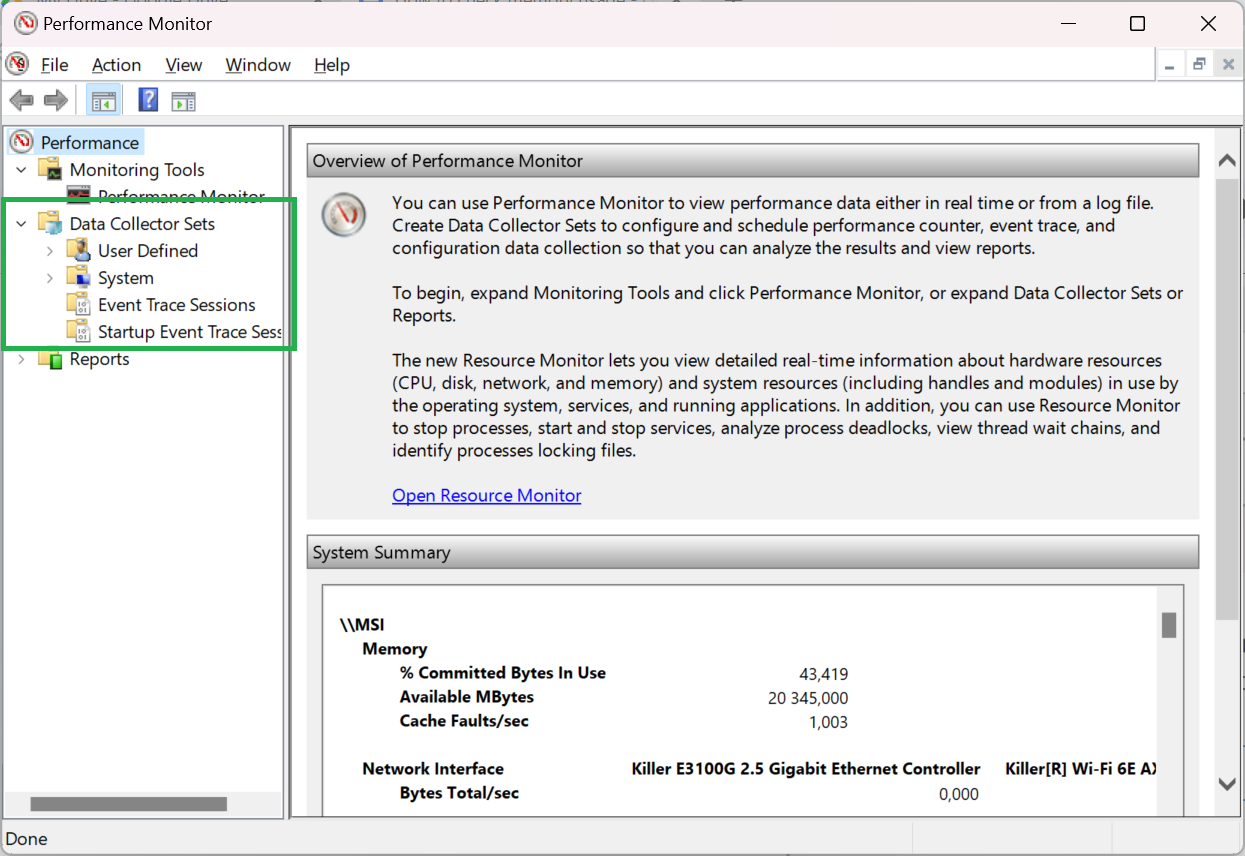
3. Expand “data collector sets”.
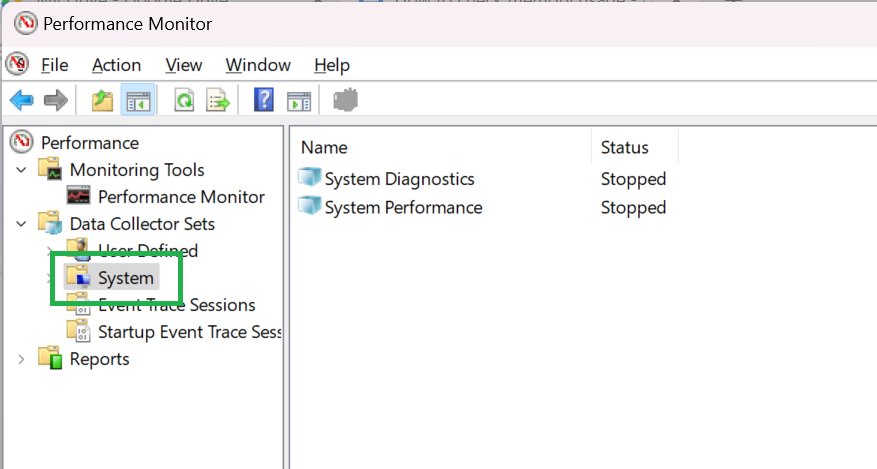
4. Open “System”.
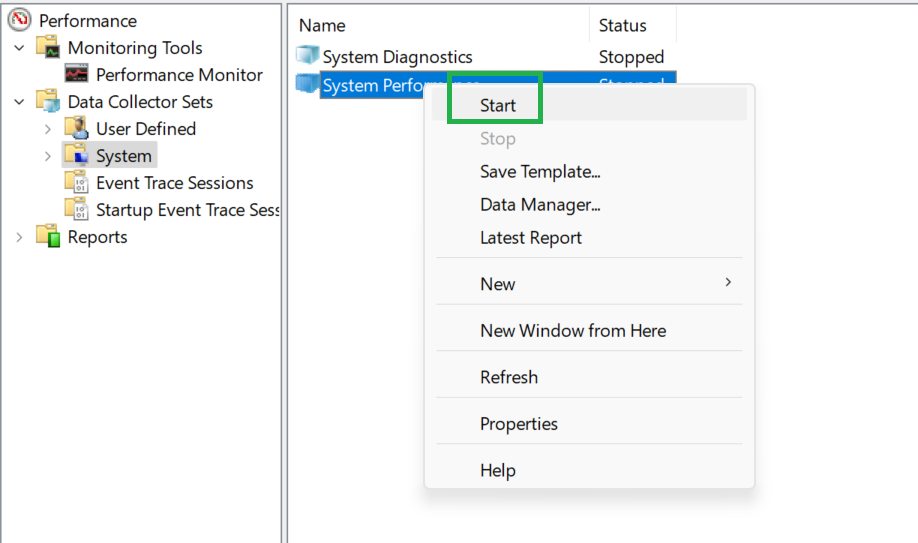
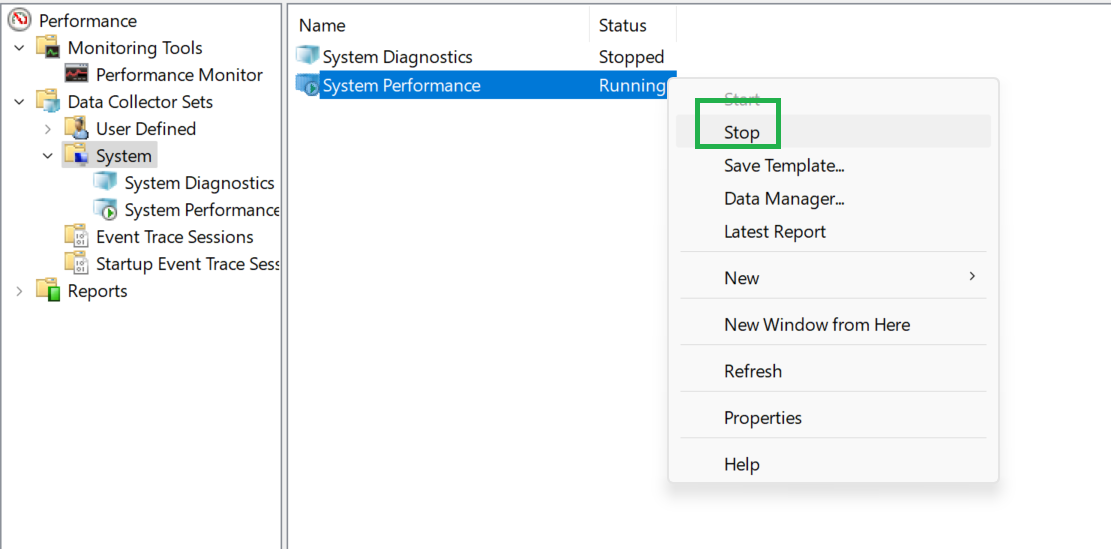
5. Right-click on “System performance”, then click “Start.” Performance monitor starts recording your system performance. You can now go do whatever it is you wanted to and it will record in the background.
6. Right-click on “System Performance” and click “Stop”. Once you’ve recorded enough, you can stop the recording the same way you started it.
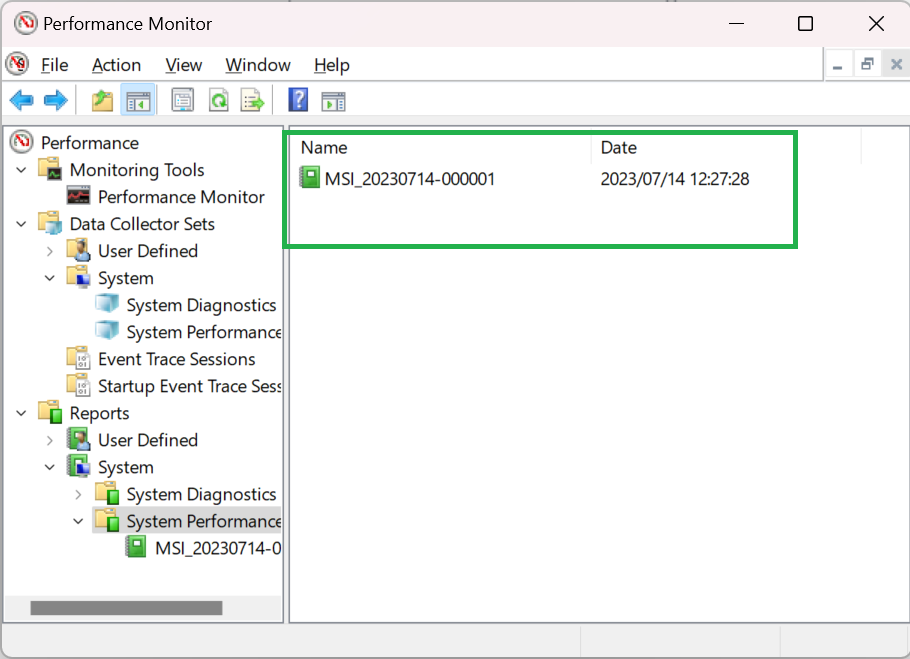
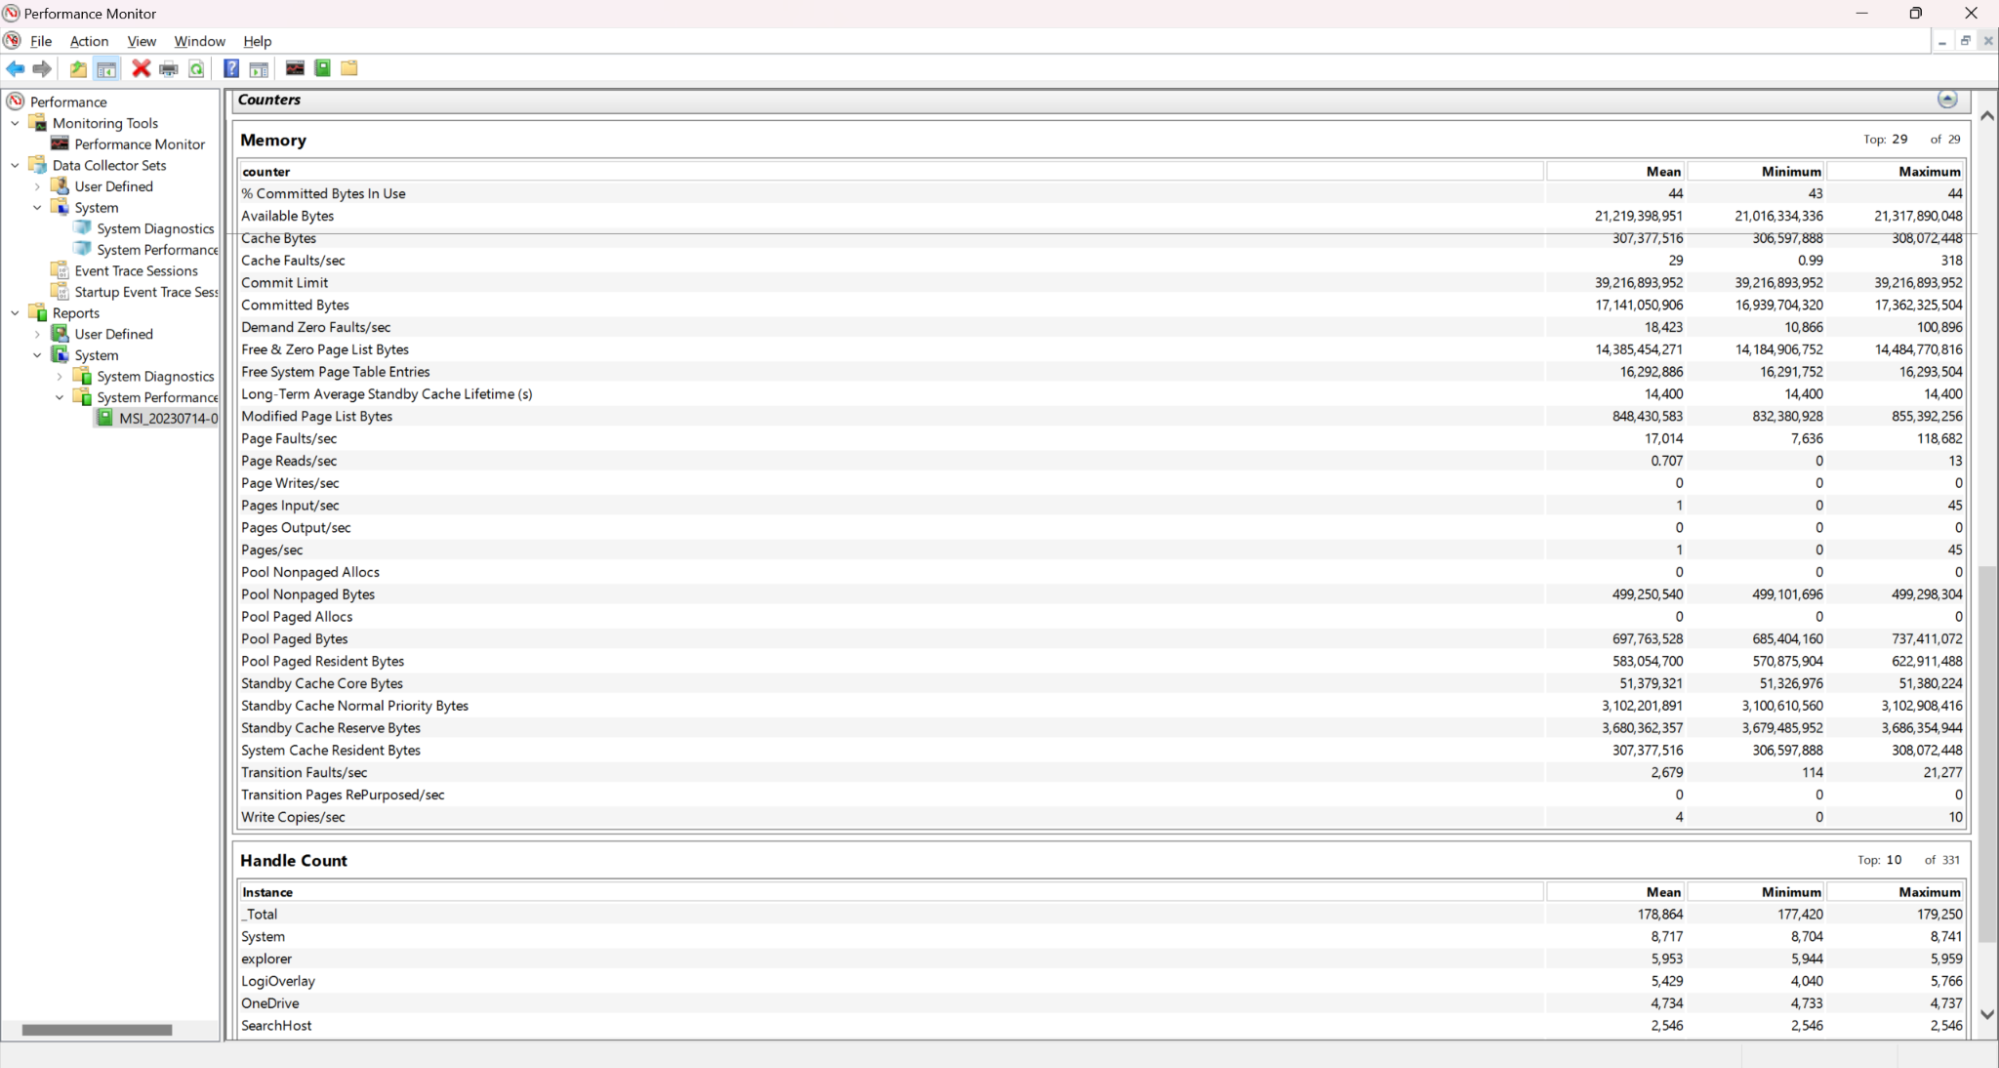
To view the log, click on Reports > System > System Performance.
Under “Memory” you can then see statistics such as the mean and maximum memory usage during the time the monitor was running.
Use The Command Prompt
If, for some reason, you don’t have access to the Windows GUI, you can also check your memory usage using the Command Prompt:
1. Search for “CMD” from the Start Menu and click on it to open the Command prompt. That is, if you are in the normal Windows environment and just prefer to use the Command Prompt. Rather than being forced to.
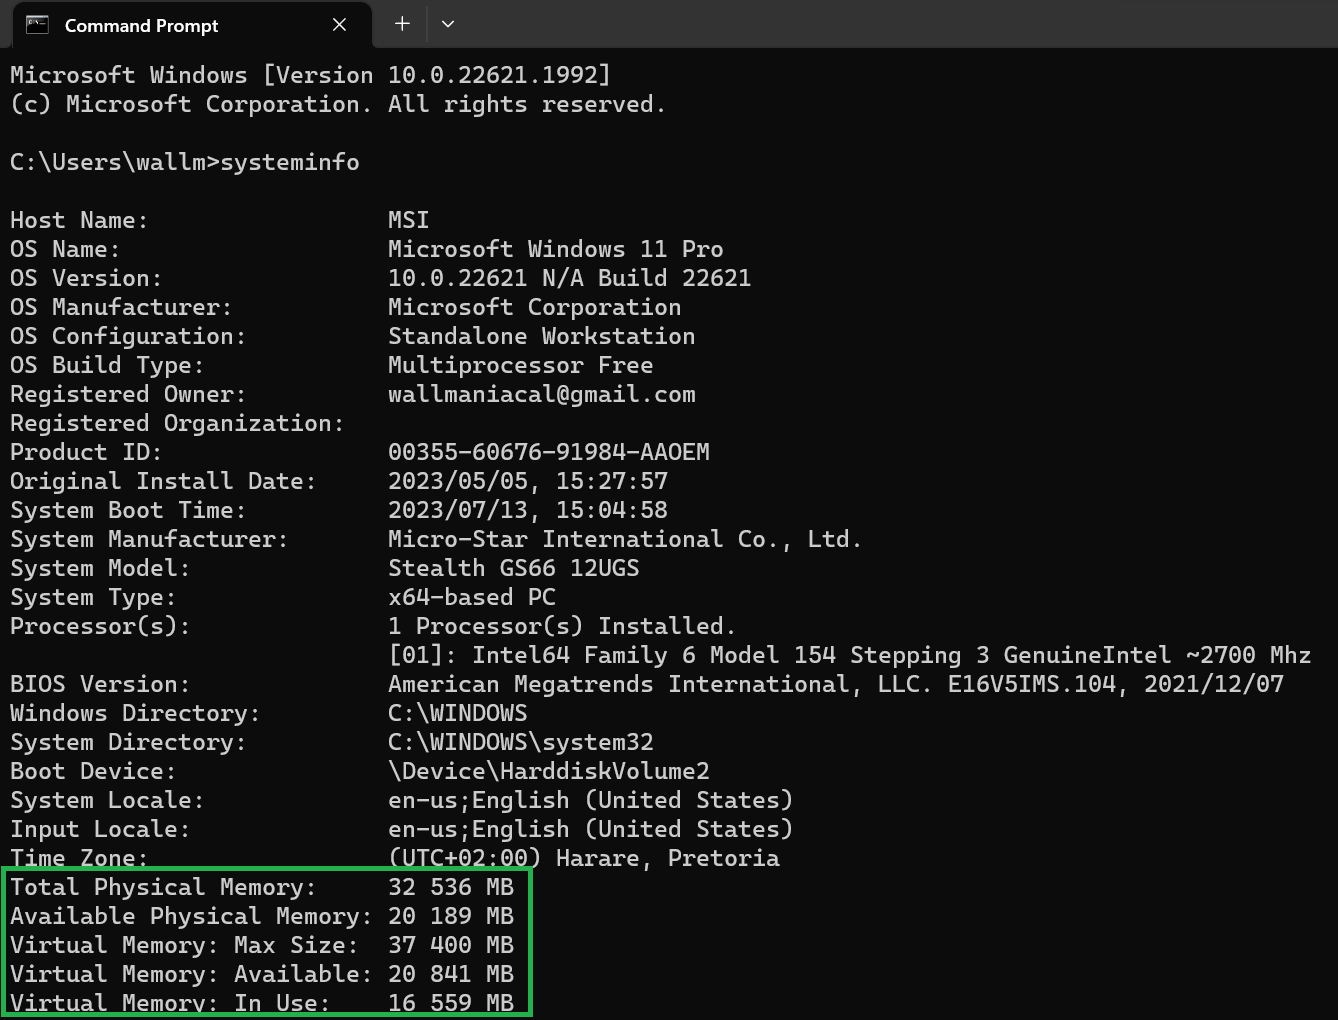
2. At the Command Prompt, type “systeminfo” and press Enter.
You should see a summary if current memory usage, including how much memory you have in total, and how much “virtual” memory you have. That is, space on your HDD or SSD that’s been allocated as swap space in case your RAM gets too full.
These are the easiest and most effective ways to check your memory usage in Windows. Now you don’t have to wonder whether things are grinding along because of full RAM or not.
Sydner Butler is a freelance writer for Tom's Hardware. He is a PC technician with decades of experience in system building. He covers a wide range of topics from PC hardware troubleshooting, software guides, to VR gaming.

