How to Check CPU Usage
Find out how hard your processor is working.
Get Tom's Hardware's best news and in-depth reviews, straight to your inbox.
You are now subscribed
Your newsletter sign-up was successful
Your CPU is the brains of the operation when it comes to your computer, but unlike with your own brain, we can get an exact measure of how much processing capacity is in use at any given time.
Whether you’re a heavy multitasker, or trying to get the most performance out of a video game, monitoring CPU usage is an important way to know if you’re getting all the performance your processor is capable of, or whether it’s behind any performance issues you may be experiencing.
In this how-to, we’ll be showing you various ways to monitor your CPU usage, from quick and simple, to slightly more complicated, but much more detailed. If you’re overclocking, or worried that your CPU might be running too hot, you’ll also want to learn how to check your CPU temperature.
Some Important Notes About Interpreting CPU Usage
Generally CPU usage is reported as a single percentage, showing how much of your CPU’s resources are currently being used. So if that number is at 100%, your entire CPU is busy. If it’s at 25%, then only a quarter of the CPU is occupied. However, there’s a small wrinkle to this, because modern CPUs consist of multiple cores.
Suppose you have a quad-core CPU (it’s probably time to upgrade!) and one of the cores is completely maxed-out, while the rest are idle. You’ll see only 25% CPU usage, but your performance is limited to the maximum performance of that core. We see this often in video games that don’t make good use of multiple CPU cores, so the frame rate of the entire game is limited to the fastest performance of a single CPU core or thread.
In this case, a single CPU percentage for usage isn’t all that useful, which is why some of the methods we’re about to explore will let you see every individual CPU core doing its thing, to help you see where any bottlenecks may be.
How to Check CPU Usage With Windows Task Manager
Windows has robust and detailed performance monitoring tools built into it, and with every version of the operating system the information on offer is more detailed. Here’s how to access these tools in Windows 11 (this also works in Windows 10):
Get Tom's Hardware's best news and in-depth reviews, straight to your inbox.
1. Launch Task Manager. The easiest way is by hitting Ctrl + Shift + Escape.
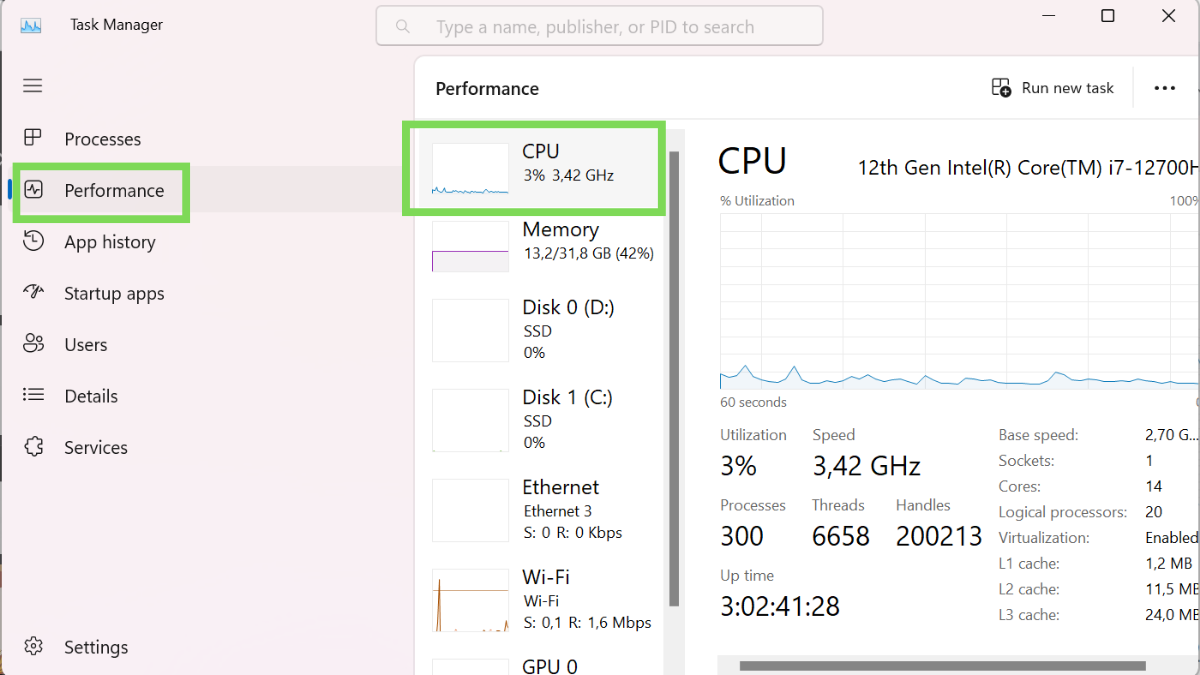
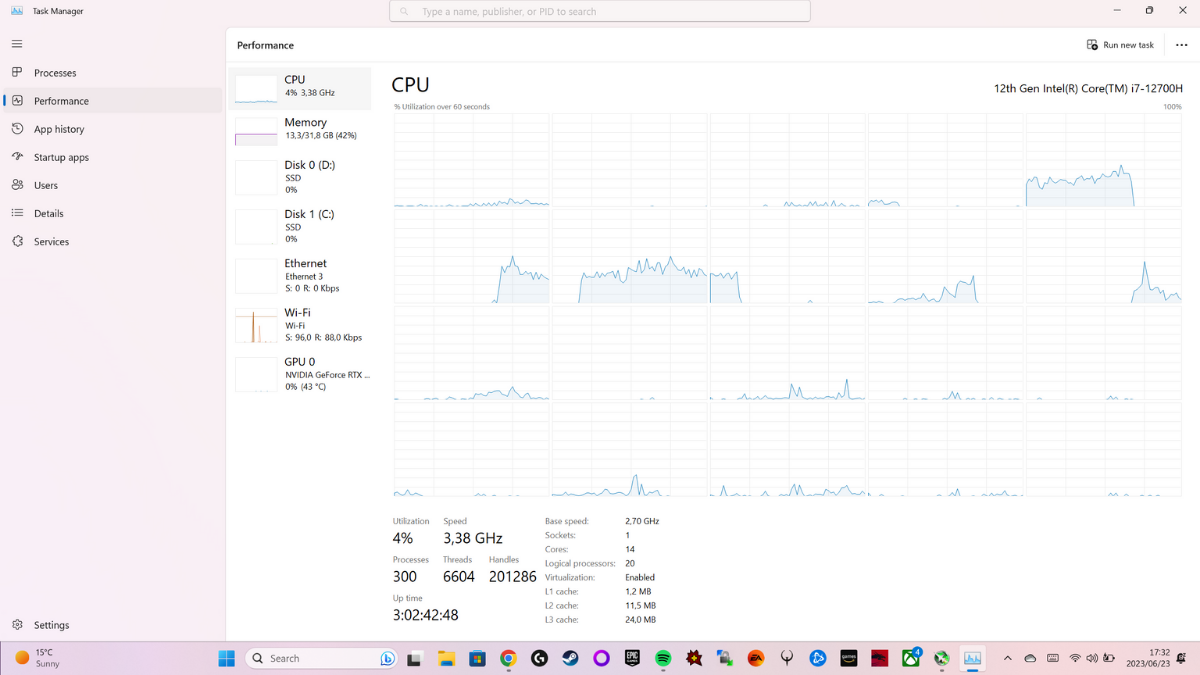
2. Open the Performance tab and click on “CPU.” Here you can see a graph showing what percentage of your total CPU power is in use. If that’s all you wanted to know, then you can stop here.
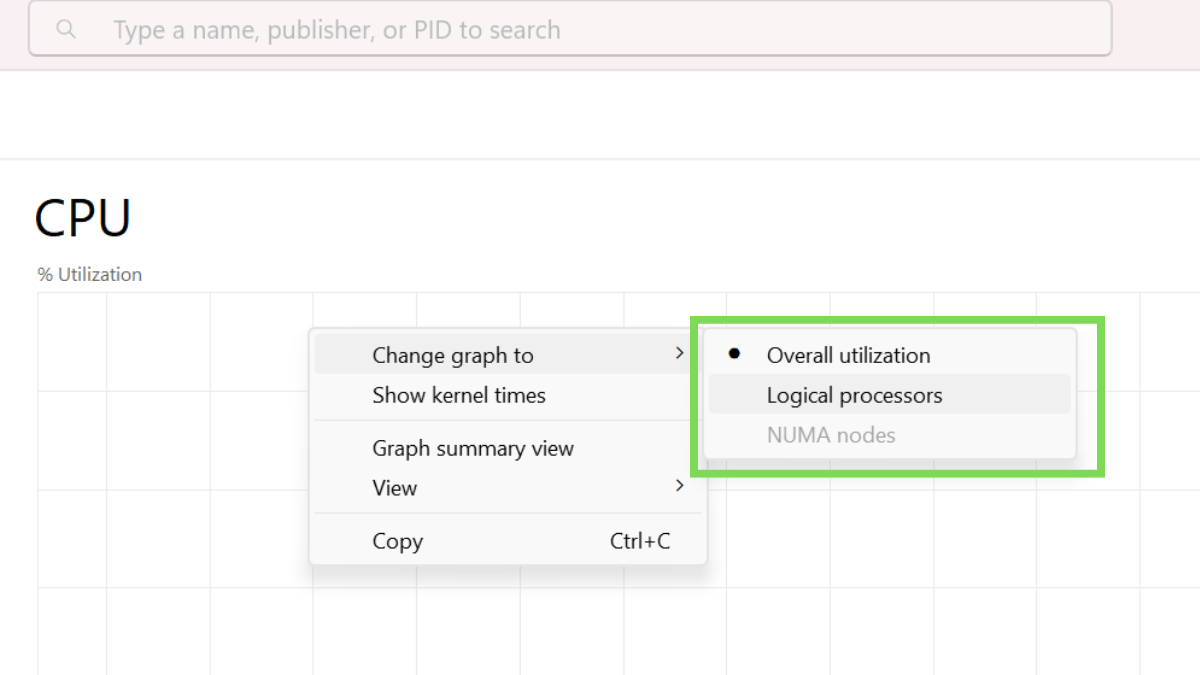
3. (Optionally) right-click on the graph and select Change Graph to > Logical Processors. This will show you the utilization of each individual “thread” your CPU offers. This number may not reflect the number of physical CPU cores, since some types of CPU cores can handle two threads at once. This is what “logical” processors refers to rather than physical processors.
With the logical processor view open, you can tell whether your CPU’s load is evenly spread across all logical processors, or if one or two threads are being hammered at 100% while the rest of the CPU is under lower stress.
How to Check CPU Usage With the Xbox Game Bar
Using the Windows Task Manager to check CPU usage works great if you’re using a windowed application, but unless you have a multi-monitor setup, you’re out of luck if you’re using a full-screen application like a video game.
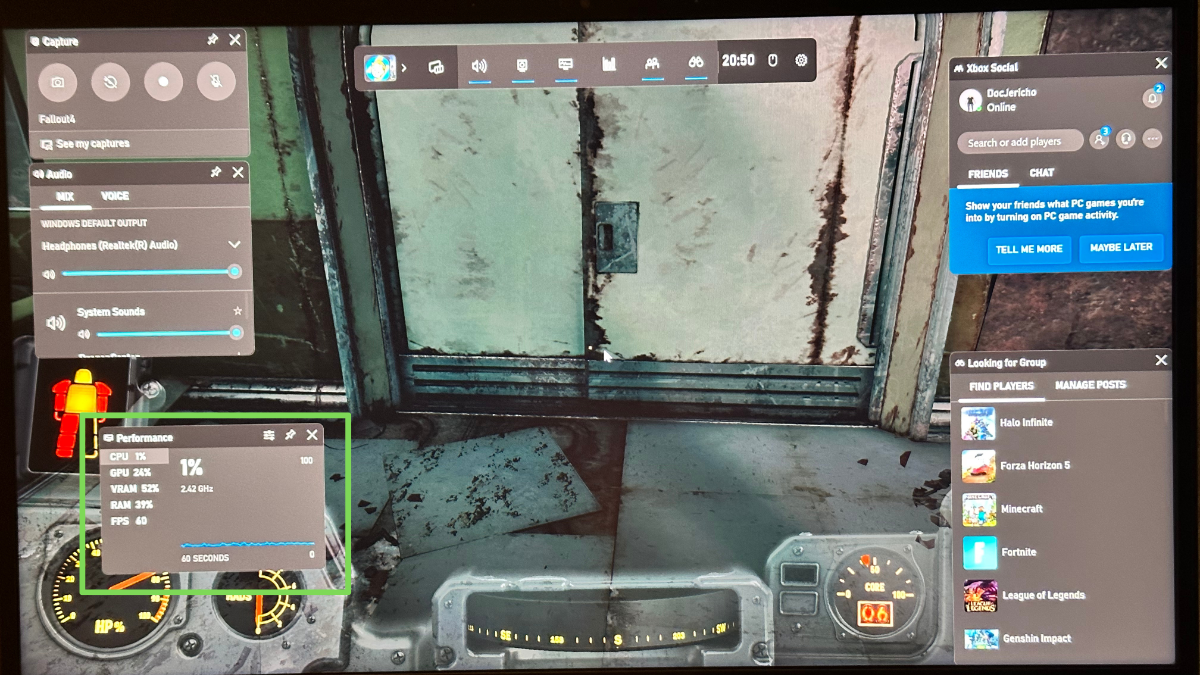
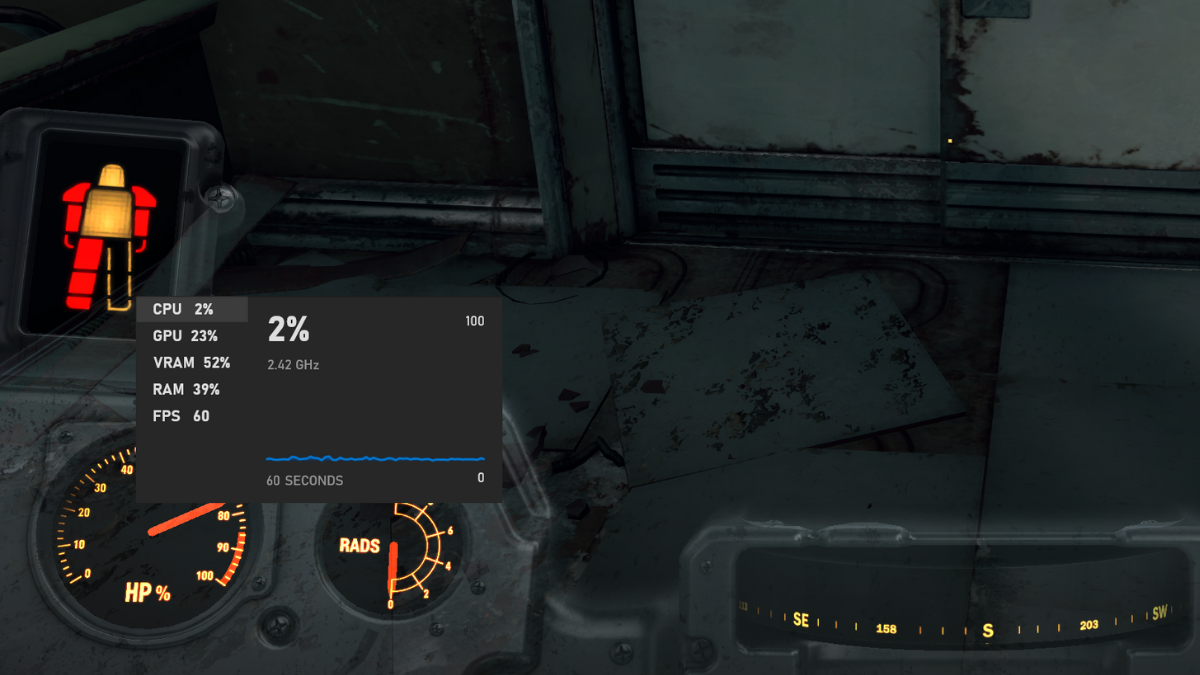
Luckily, Windows includes a feature known as the Xbox Game Bar, which lets you pin a performance monitoring widget to your screen on top of a full-screen app. Here’s how to use it:
1. Launch Xbox Game Bar by Pressing Win + G.
2. (Optionally) Move the performance widget. You can use your mouse to drag the Performance widget to a spot on the screen where it won’t obscure something important in your full-screen app.
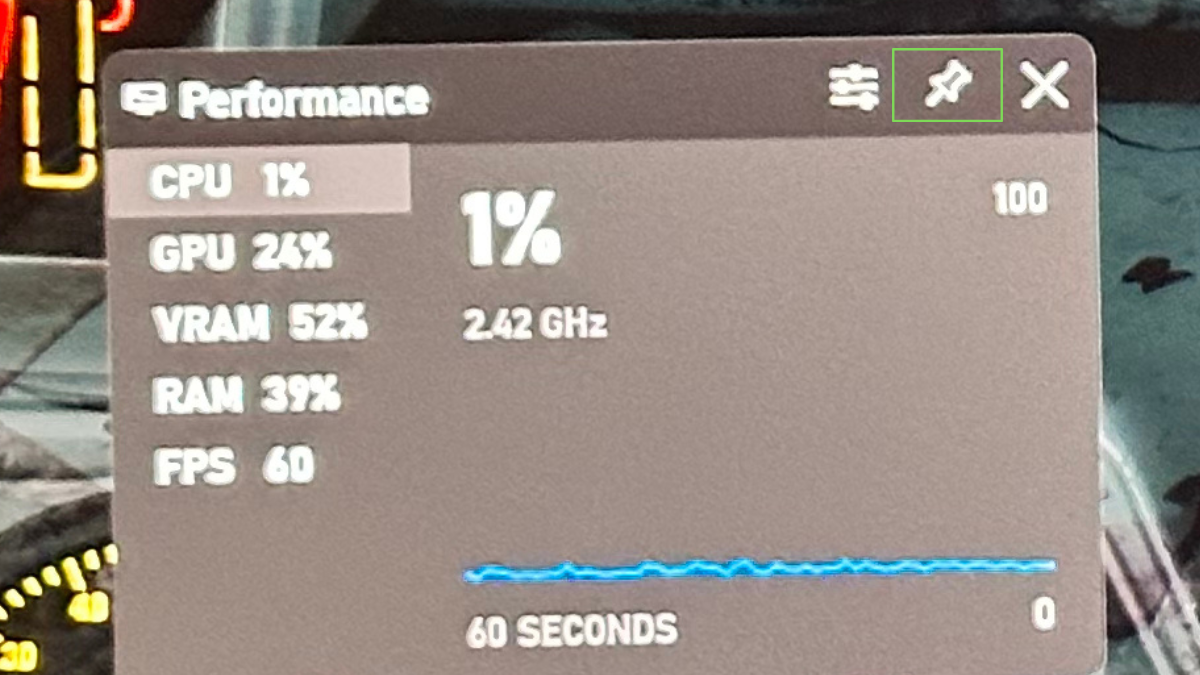
3. Pin the Performance Widget with the Pin button. By clicking on the pin button you’ll lock the performance widget in place even after closing the Game Bar.
4. Close the Game Bar with Win + G. Once you’ve pinned the widget, you can close the Game Bar and the performance info will remain overlaid on your full-screen app.
Do get rid of the overlay, just open the Game Bar again, and unpin the widget, the close the bar, and continue with business as usual.
How to Use MSI Afterburner to Monitor CPU Usage
While the Xbox Game Bar gives you a basic CPU usage meter you can use in games and other full-screen applications, it doesn’t show you details about the per-thread CPU usage. If you want to see what your entire CPU is doing while running a full-screen 3D application, the MSI Afterburner combined with Riva Tuner Statistics Server (RTSS) is the way to go. Here’s how to set it up:
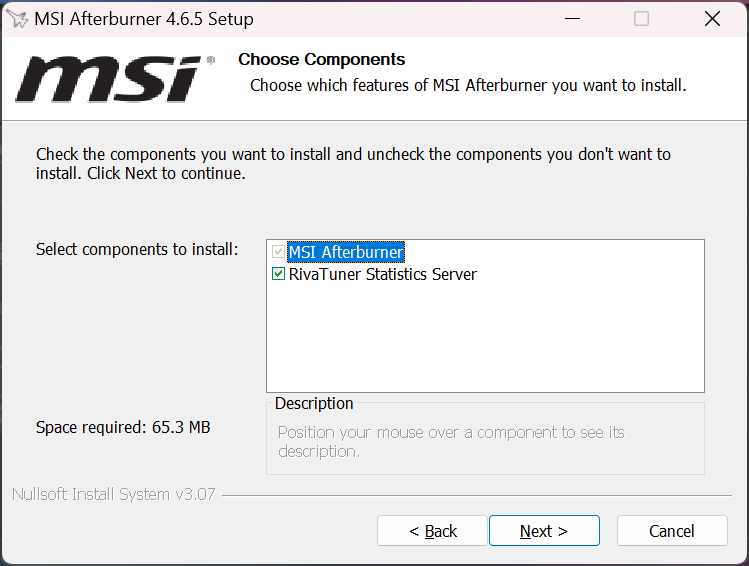
1. Download and install MSI Afterburner. Head to the official website to download, unzip, and install the app. During installation, make sure not to uncheck the box for installing RTSS.
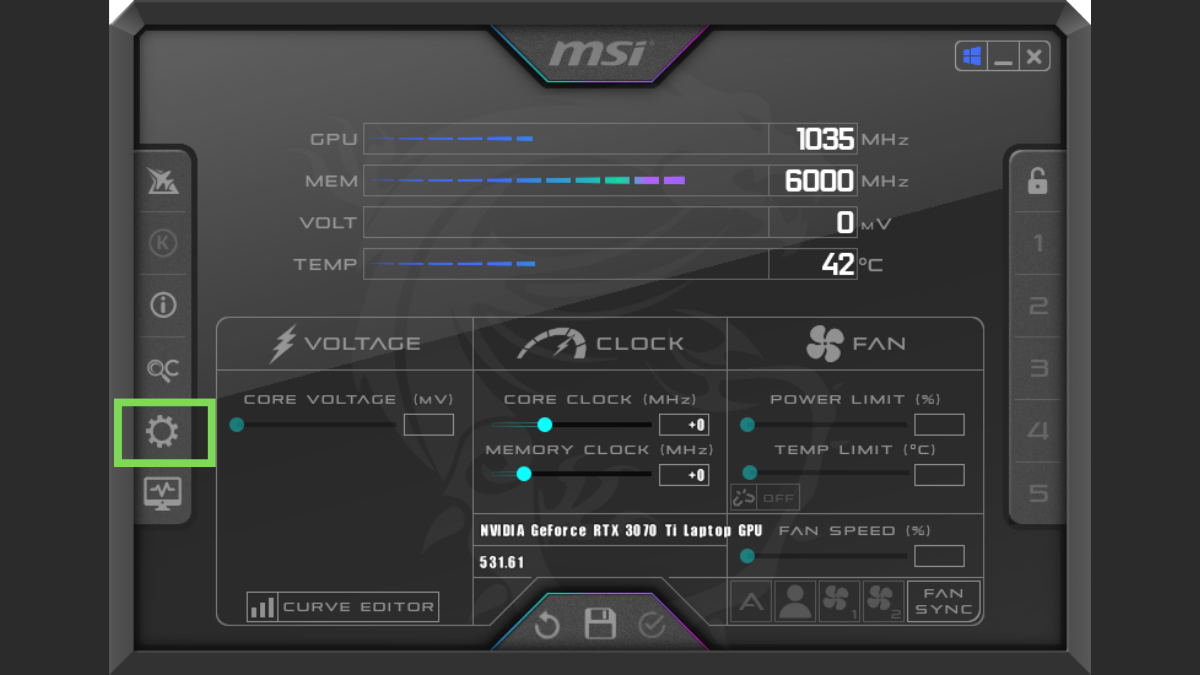
2. Open MSI Afterburner. You’ll be asked to provide special privileges for the app, you must say “Yes” to continue.
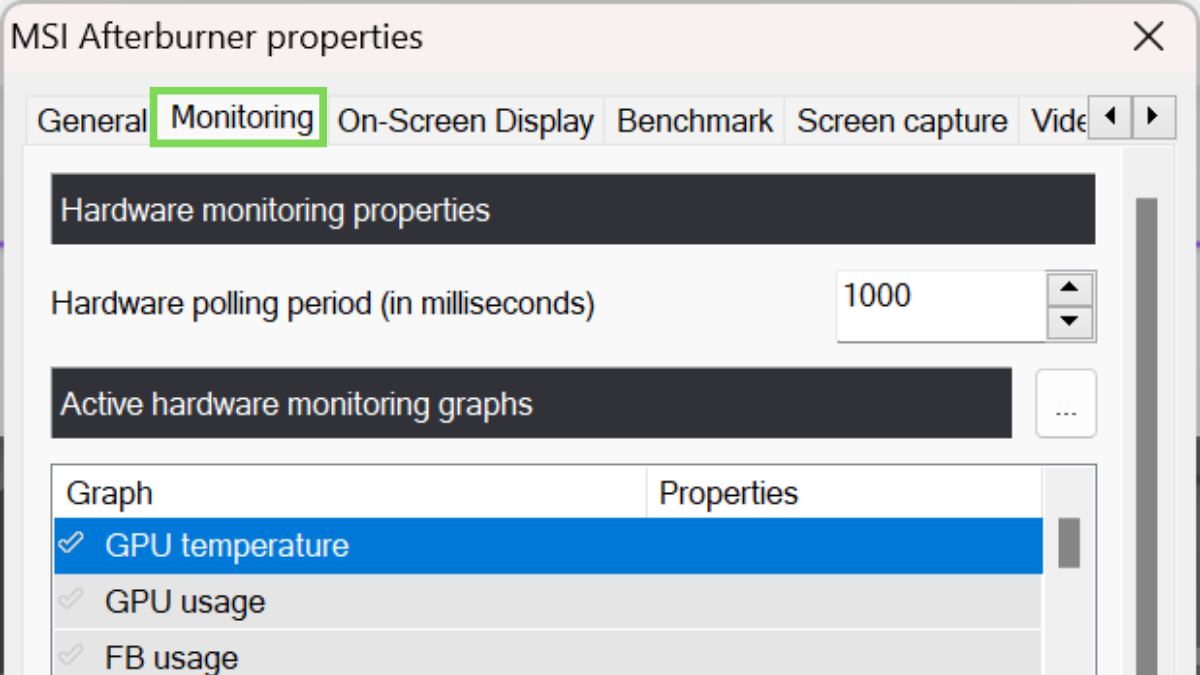
3. Click on the setting “Cog” button. This opens the MSI Afterburner properties window where you can modify its settings.
4. Navigate to the “Monitoring” tab. This is where you can select which aspects of your system will be monitored, and which will be displayed in the on-screen overlay.
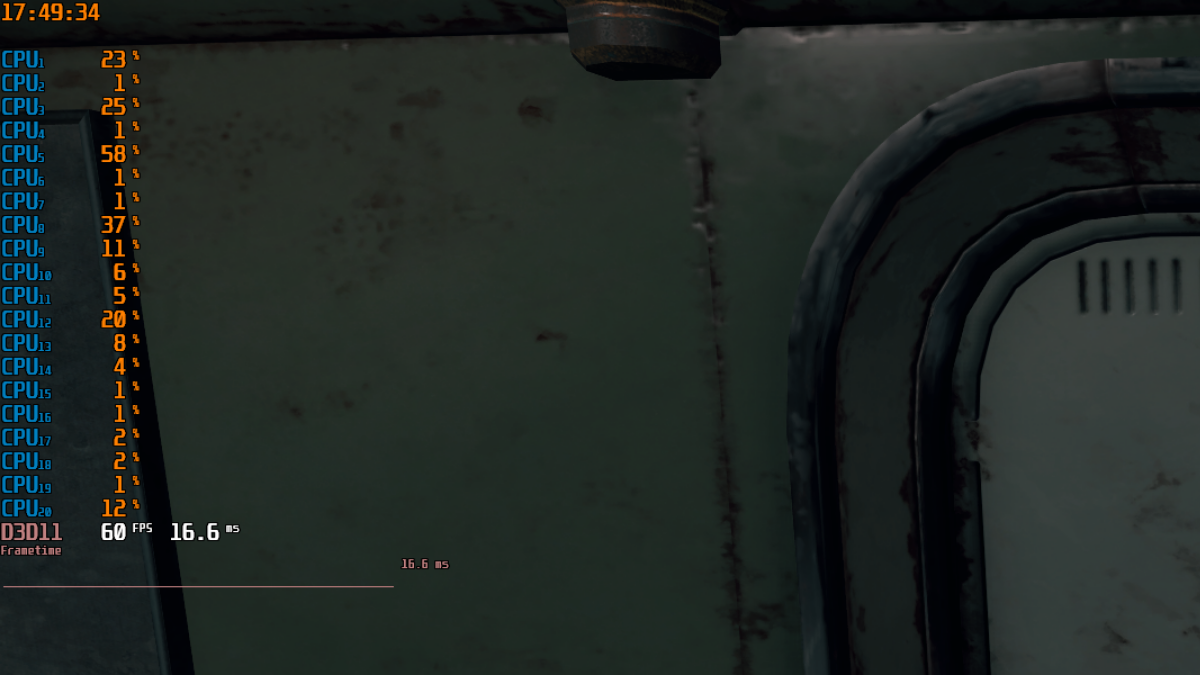
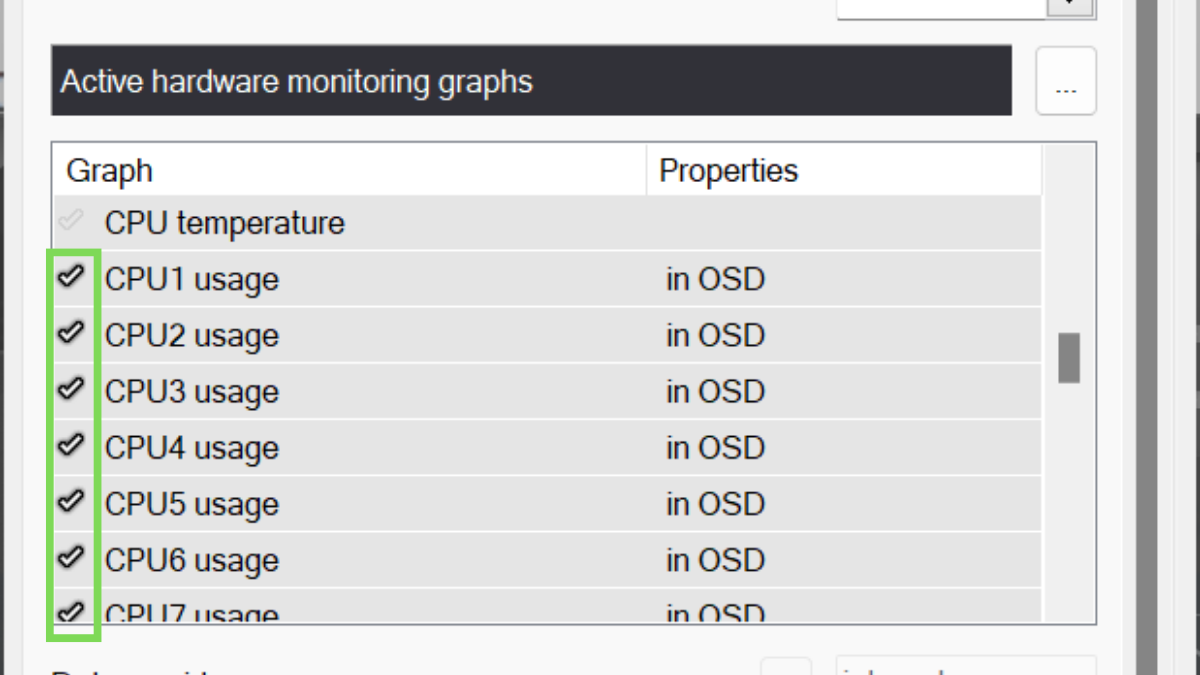
5. Tick every entry titled “CPU Usage” under “Active hardware monitoring graphs”. Each one of these entries represent a logical CPU in your computer. In this case there are 20, but this will differ based on your hardware.
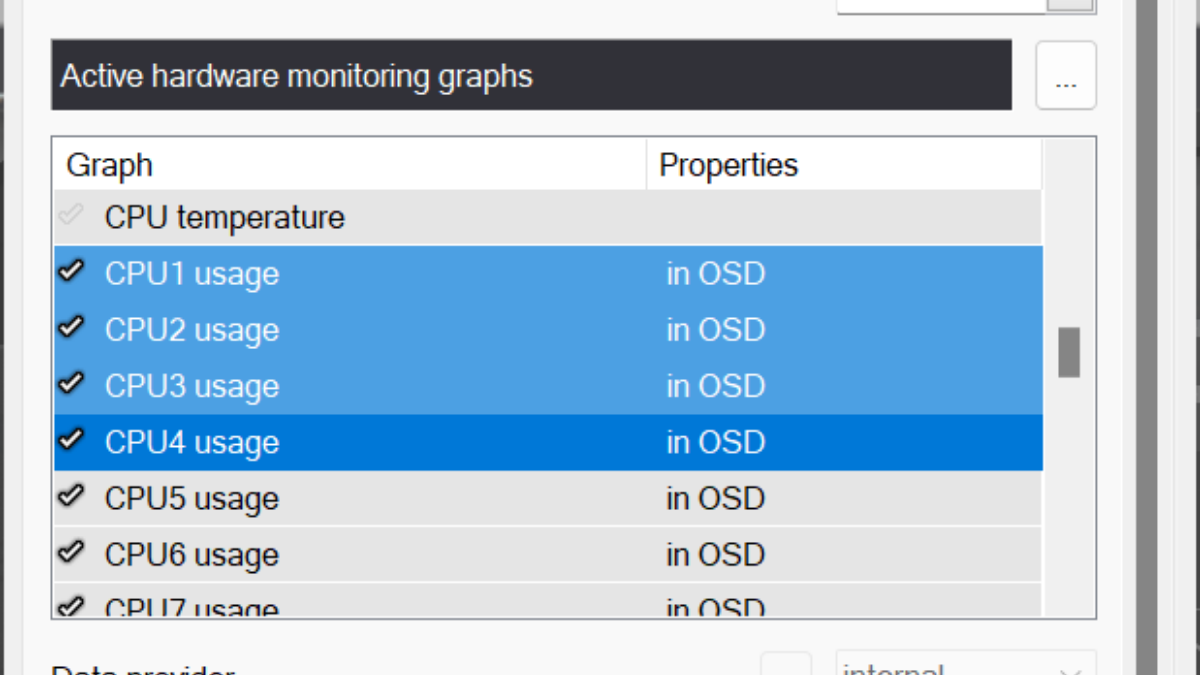
6. Hold Shift and click on every CPU usage entry to highlight it. Select all of the numbered CPU usage entries.
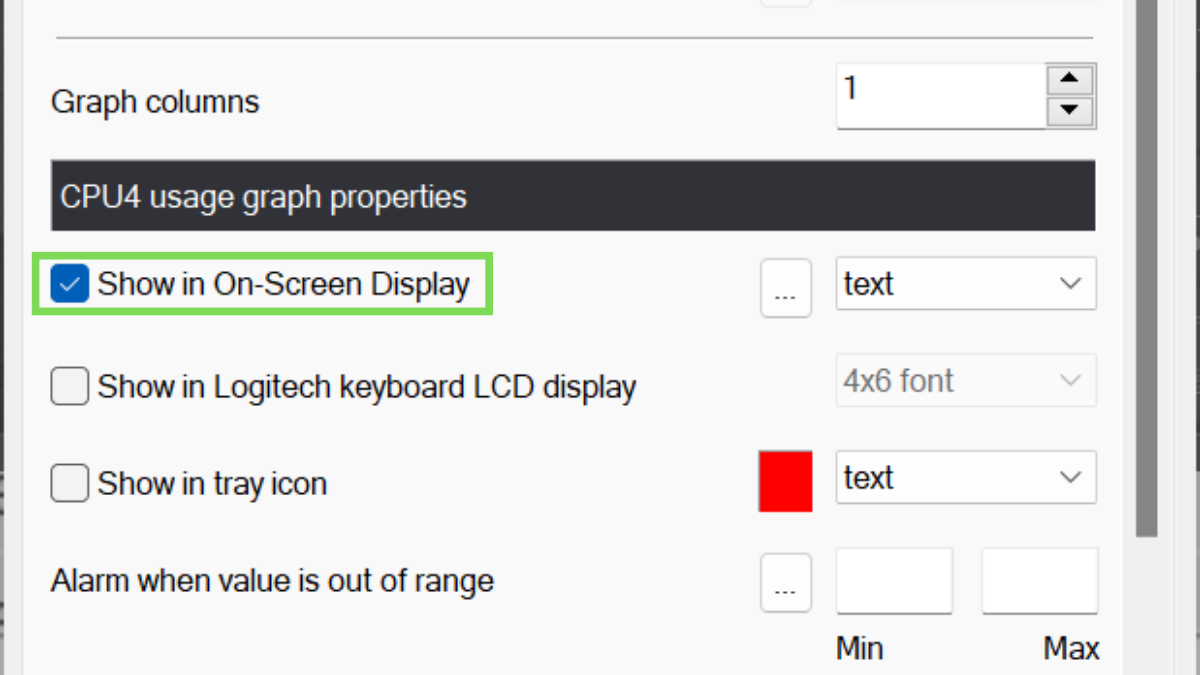
7. Click on “Show in on-screen display.” This ensures that these monitored CPUs appear in the on-screen display.
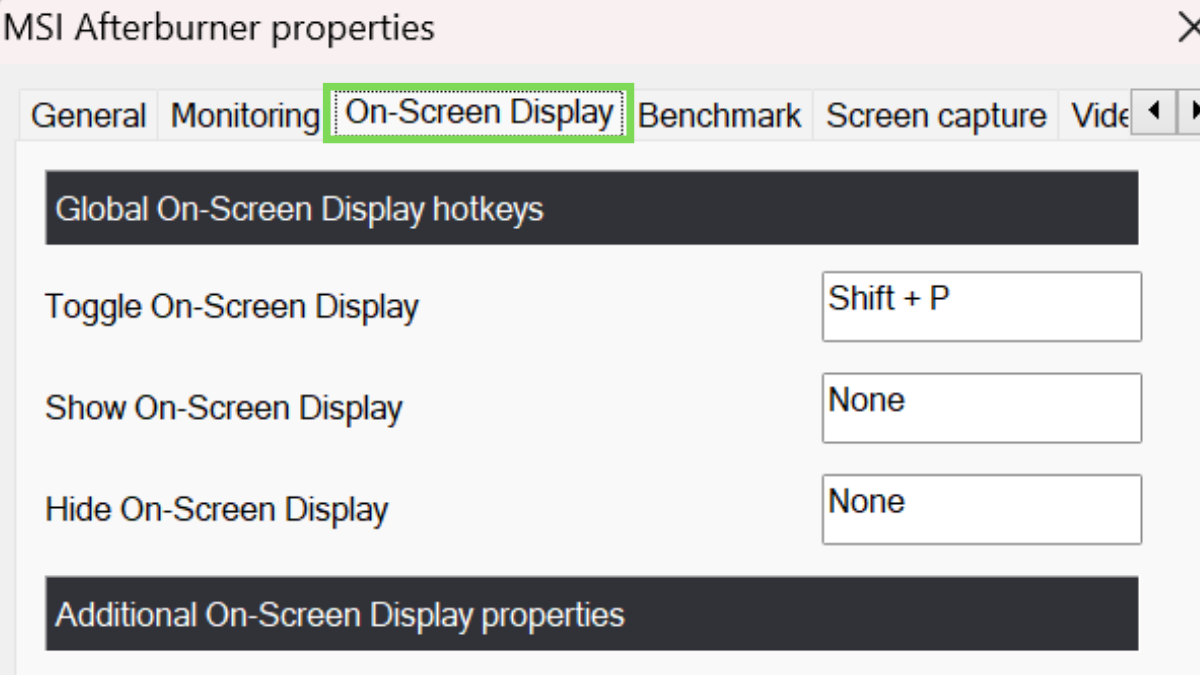
8. Navigate to the On-screen Display tab and set a shortcut. By default the “Toggle on-screen display” shortcut is set to use the “Home” key, but that’s not always convenient, so set whichever key you would prefer. We chose Shift + P in this case.
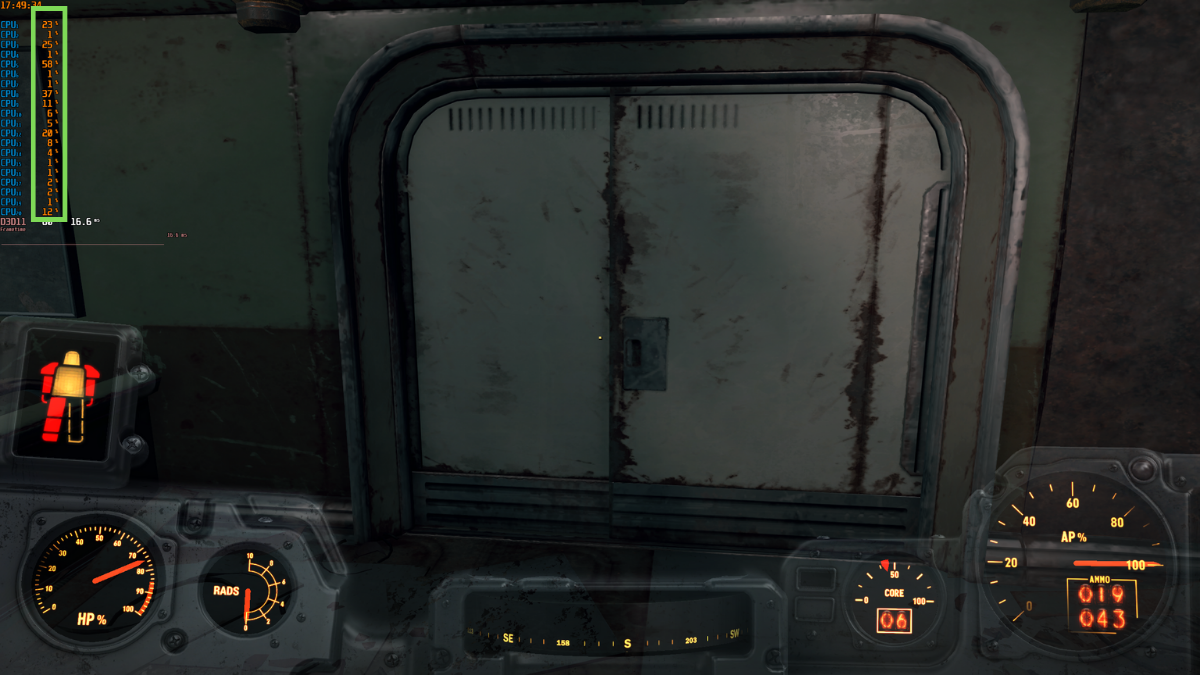
9. Click OK and run your game. With your choices locked in, run your game or 3D app and all of the CPU usage measurements should appear. If you don’t see anything, use the toggle you set. If that doesn’t work, make sure MSI Afterburner is running in the background.
How to Use HWInfo64 to Check Your CPU Usage History
All of the methods we’ve covered so far let you see what your CPU is doing live as it happens, but there some instances where you may want to see a record of CPU usage, so that you can do some detective work about usage patterns and see if there are particular times when your CPU usage spikes or otherwise behaves oddly.
The free utility HWInfo 64 offers exact this feature, and here’s how you can use it:
1. Download and install HWInfo64. You can find it on its official website. If you don’t want to install it to your system, you can opt to download the portable version instead.
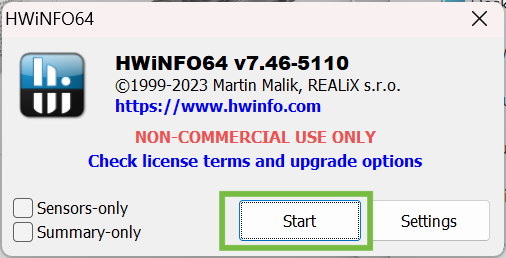
2. Run the app and click “start”. It may take a while for the app to finish initializing.
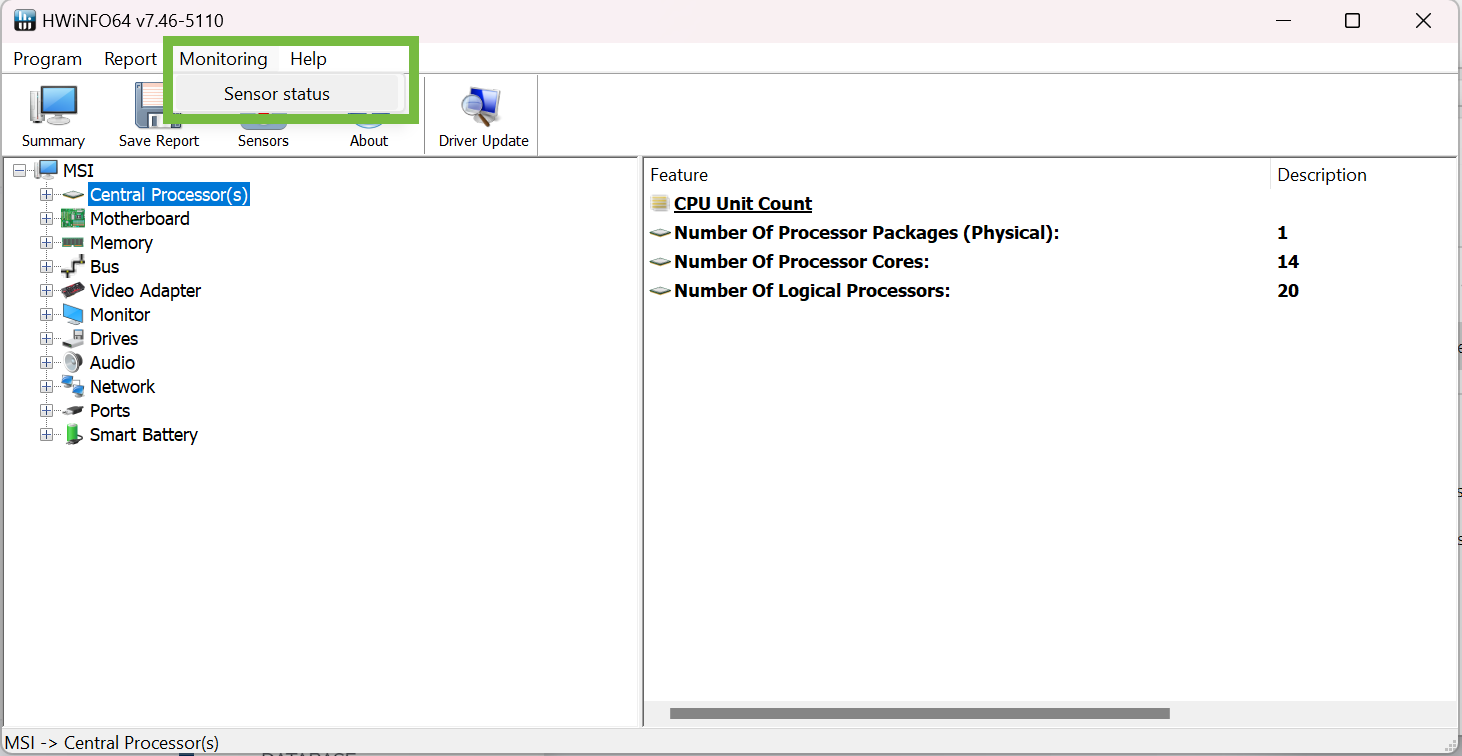
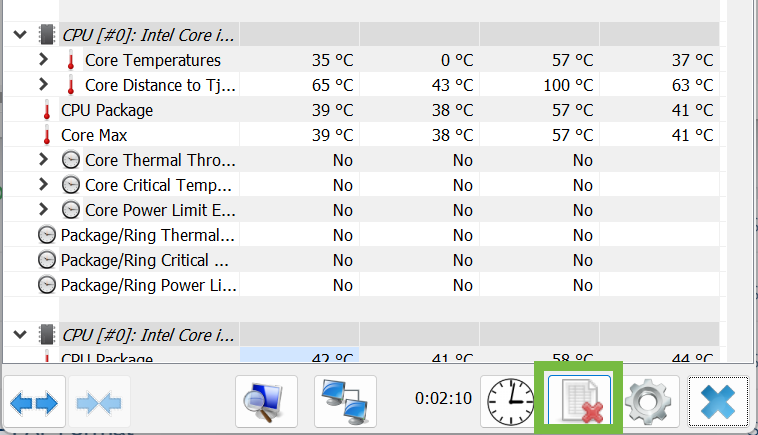
3. Click on Monitoring > Sensor Status. This will open the sensor status window where you can see all the different data sources being monitored.
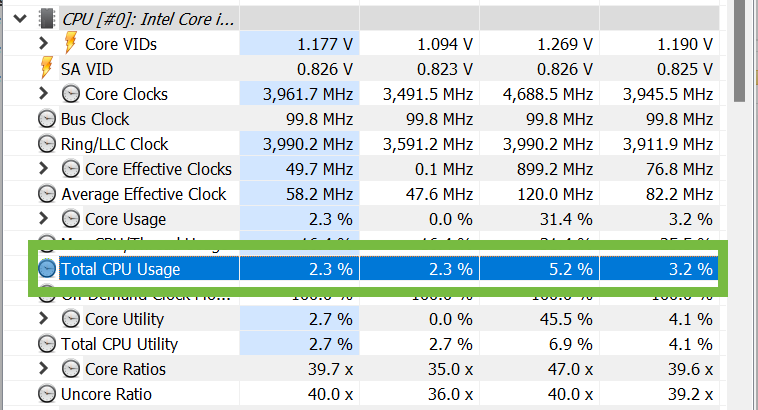
4. Note the Total CPU Usage sensor. You can hover the mouse pointer over this or any sensor to get an explanation of what it measures and how it’s calculated.
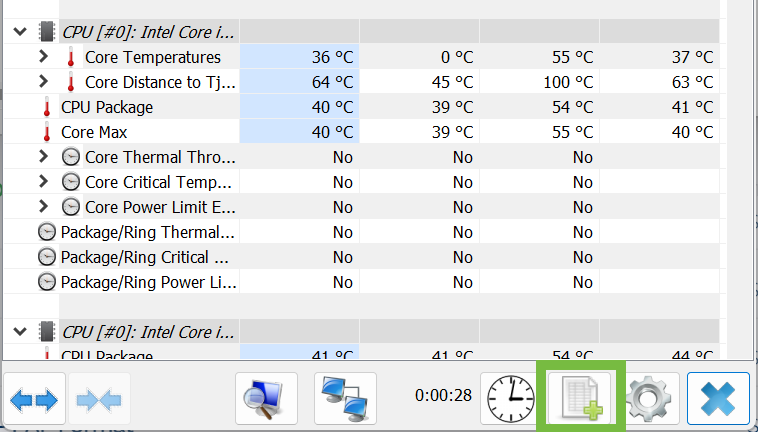
5. Click the Start Logging button.
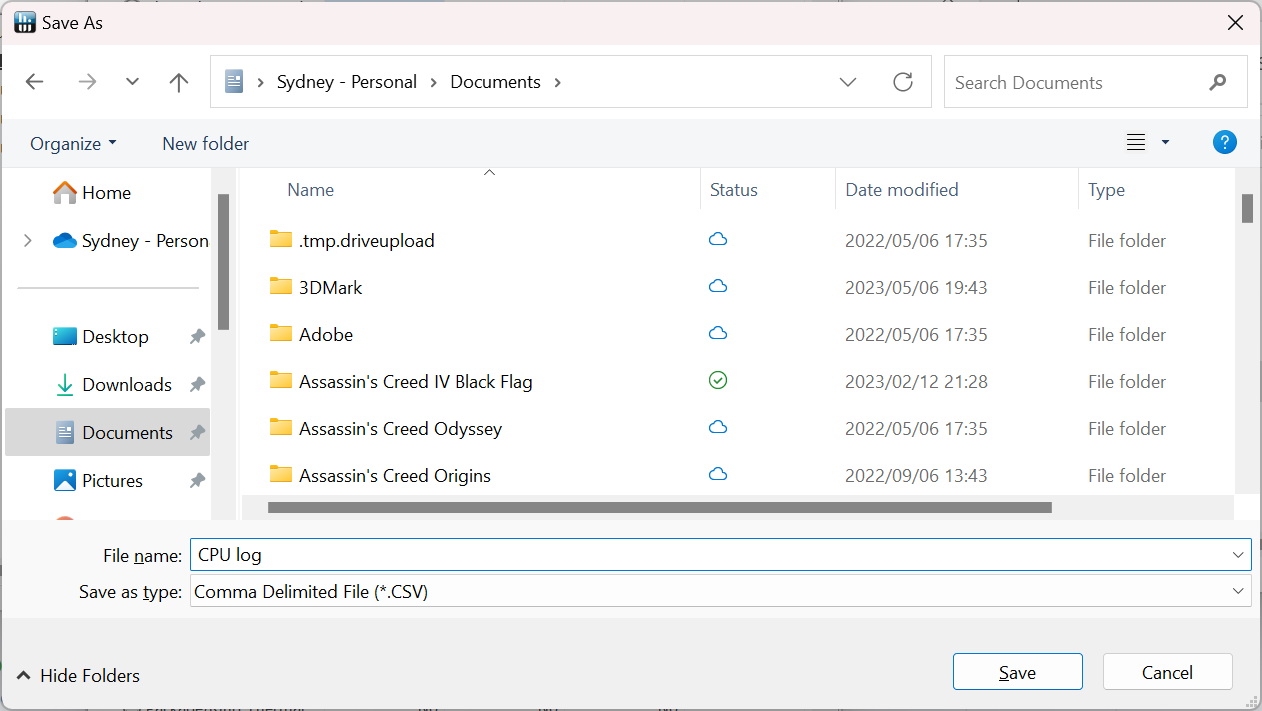
6. Choose a location to save your CSV file. HWInfo64 saves your log as a CSV file. Pick a location where you’ll easily find it.
7. When you’re done logging, click the “stop logging” button.
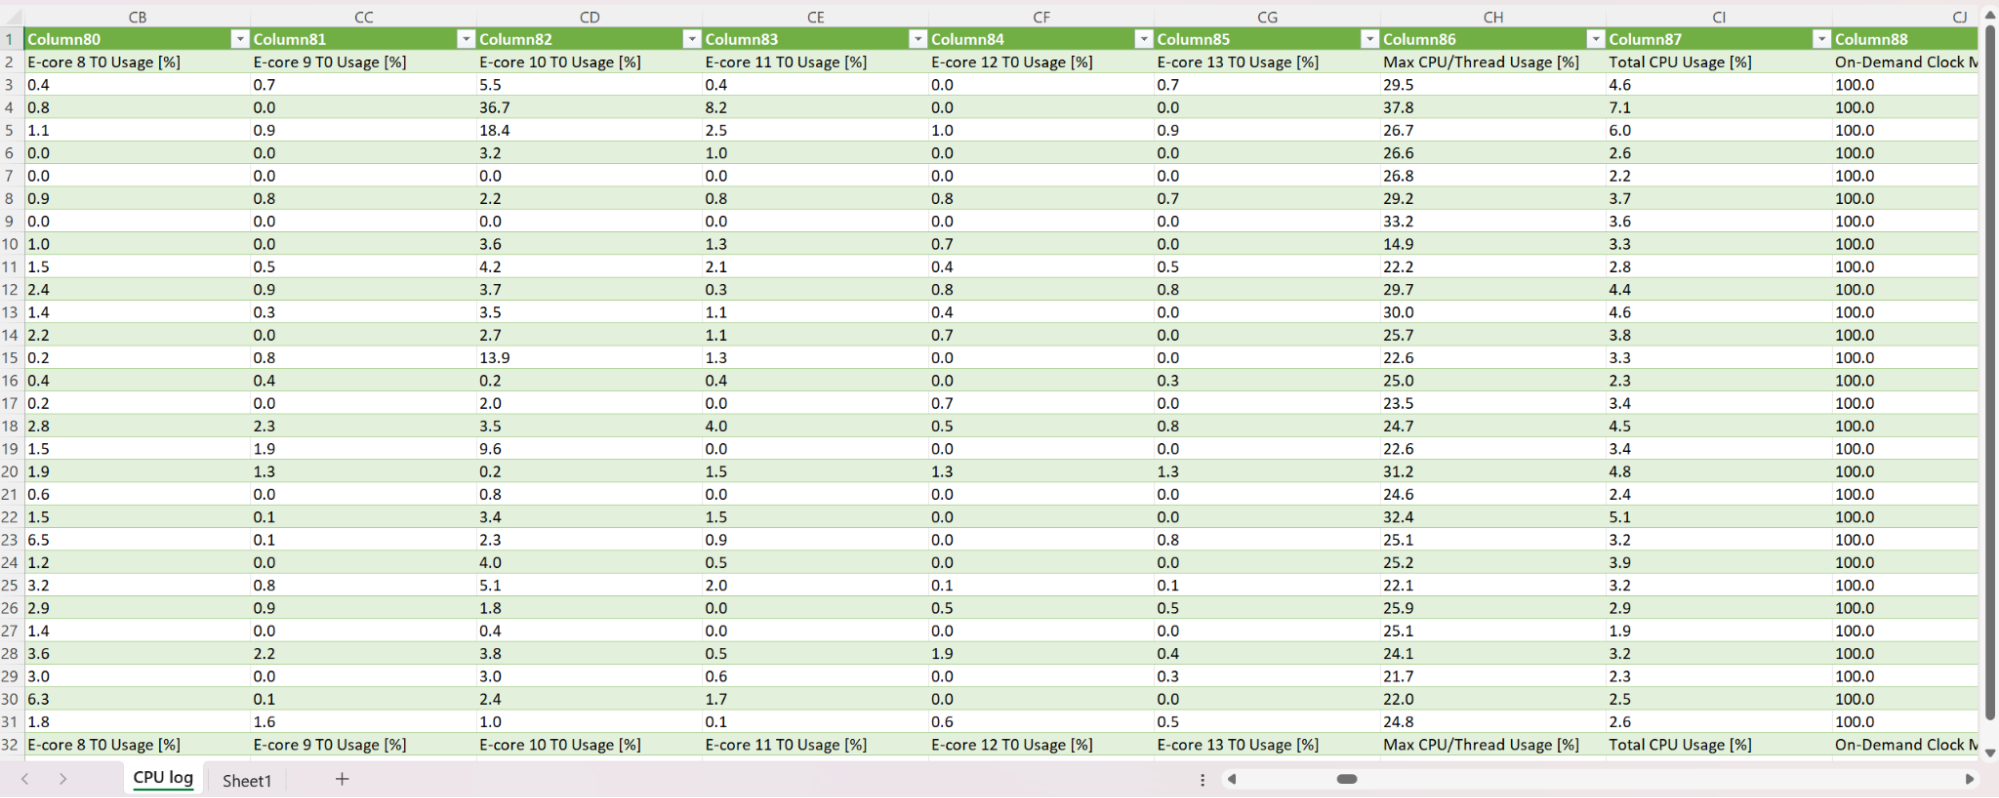
8. Open your CSV file. Open the CSV file with the viewer of your choice. Here in Excel, we used New Workbook > Data > Import from Text/CSV > Load.
The first two columns log the date and time, you can compare this to the column for Total CPU Usage, or any of the columns that show individual core or thread usage.
Now that you know these different methods to check your CPU usage, you’ll never have to wonder about what your CPU is actually doing, no matter what sort of task you’re using it for.
Sydner Butler is a freelance writer for Tom's Hardware. He is a PC technician with decades of experience in system building. He covers a wide range of topics from PC hardware troubleshooting, software guides, to VR gaming.
-
TerryLaze ReplyAdmin said:Knowing how much of your CPU is in use can be crucial to diagnosing performance issues. Here’s how.
How to Check CPU Usage : Read moreWith the logical processor view open, you can tell whether your CPU’s load is evenly spread across all logical processors, or if one or two threads are being hammered at 100% while the rest of the CPU is under lower stress.
You are not making any statement here of which one is the one you want or recommend to the readers...
Evenly spread load doesn't mean anything for how well your app/game runs, it's not a diagnosis tool for performance issues of anything you code yourself or anything you run.
Windows does load balancing on all available logical processors which means that an evenly spread load just means that there is enough load for windows to spread it out. Windows can and does mix random threads with your app/game threads making them possibly run less than optimally.
Having your main threads run at 100% while the rest of your code uses as much as it has to on the rest of the CPU (even if "the rest" is multithreaded and uses up a lot of CPU) is desirable for many games and apps and having the main threads run slower, the same as the others, makes the whole thing run slower.
https://learn.microsoft.com/en-us/windows-hardware/test/wpt/cpu-analysisWindows uses a round-robin methodology so that an approximately equal number of threads in each process are assigned to each processor. When possible, Windows schedules a thread to run on its ideal processor; however, the thread can occasionally run on other processors.
-
hotaru.hino The problem with CPU % utilization is the only performance problem it's useful for is telling you if the CPU is maxed out. It won't be able to tell you that CS:GO likes higher single core performance because the utilization % is low and to most people that means something must be wrong if they're expecting something better.Reply
EDIT: I also want to point out that CPU % utilization, or really any hardware's % utilization, is not a measure of how much the hardware is actually used. Like for instance, if you have 8 cores, 25% utilization doesn't mean 2 cores are super busy. Or going even deeper, if the CPU core has say 8 execution resources, 25% utilization doesn't mean only 2 of those are used.
No, it's "did the hardware have something to do?" It doesn't matter if a 1 or 8 of those execution resources in a core were used, if it was used throughout the sampling period (usually 1 second), it's considered 100% utilized. -
TerryLaze Reply
That's too broad of a statement to be correct.hotaru.hino said:The problem with CPU % utilization is the only performance problem it's useful for is telling you if the CPU is maxed out. It won't be able to tell you that CS:GO likes higher single core performance because the utilization % is low and to most people that means something must be wrong if they're expecting something better.
You can get CPU % utilization numbers that will show you that a software thread is maxing out a logical processor and would benefit from a faster one.
You can see here, 37% overall CPU usage but one thread runs at 24% out of 4 logical processors so it's maxing out the one it runs on.
You can also see that that one logical processor has zero idle time.
PCM in the bottom left also shows you that one logical processor runs at 3.5Ghz while the others run at 4-600Mhz
