Why you can trust Tom's Hardware
Power Consumption and Efficiency Ryzen 9 7950X and Ryzen 5 7600X
AMD worked with TSMC to tune the 5nm process for its design goals, resulting in a specialized 15-layer N5 process node. Unfortunately, we don’t know the specifics of the custom node. However, TSMC’s N5 generally provides 15% more performance at a given power level, or 20% lower power consumption at any given clock rate compared to the 7nm process that AMD used for its previous-gen Ryzen 5000 chips. Paired with the Zen 4 architectural advances and SoC improvements, AMD says Ryzen 7000 delivers up to 40% more performance-per-watt at its standard TDP levels.
| Header Cell - Column 0 | 65W TDP | 105W TDP | 170W TDP |
|---|---|---|---|
| Socket Power (PPT) Watts | 88W | 142W | 230W |
| Peak Current (EDC) Amps | 150A | 170A | 225A |
| Sustained Current (TDC) Amps | 75A | 110A | 160A |
AMD has defined a new 170W TDP range, a new high for the mainstream Ryzen family. AMD has also increased the base TDP for the Ryzen 9 models by 65W and increased Ryzen 5 by 45W. Additionally, the peak power consumption (PPT) for the AM5 socket is now 230W. That's a significant increase over the previous-gen Ryzen 5000's 142W limit.
AMD also increased the TDC and EDC amperage significantly, raising EDC by 60A and 30A for the 65W and 105W TDP ranges, respectively. We see smaller 15A increases to the EDC for both the 65W and 105W TDP tiers.
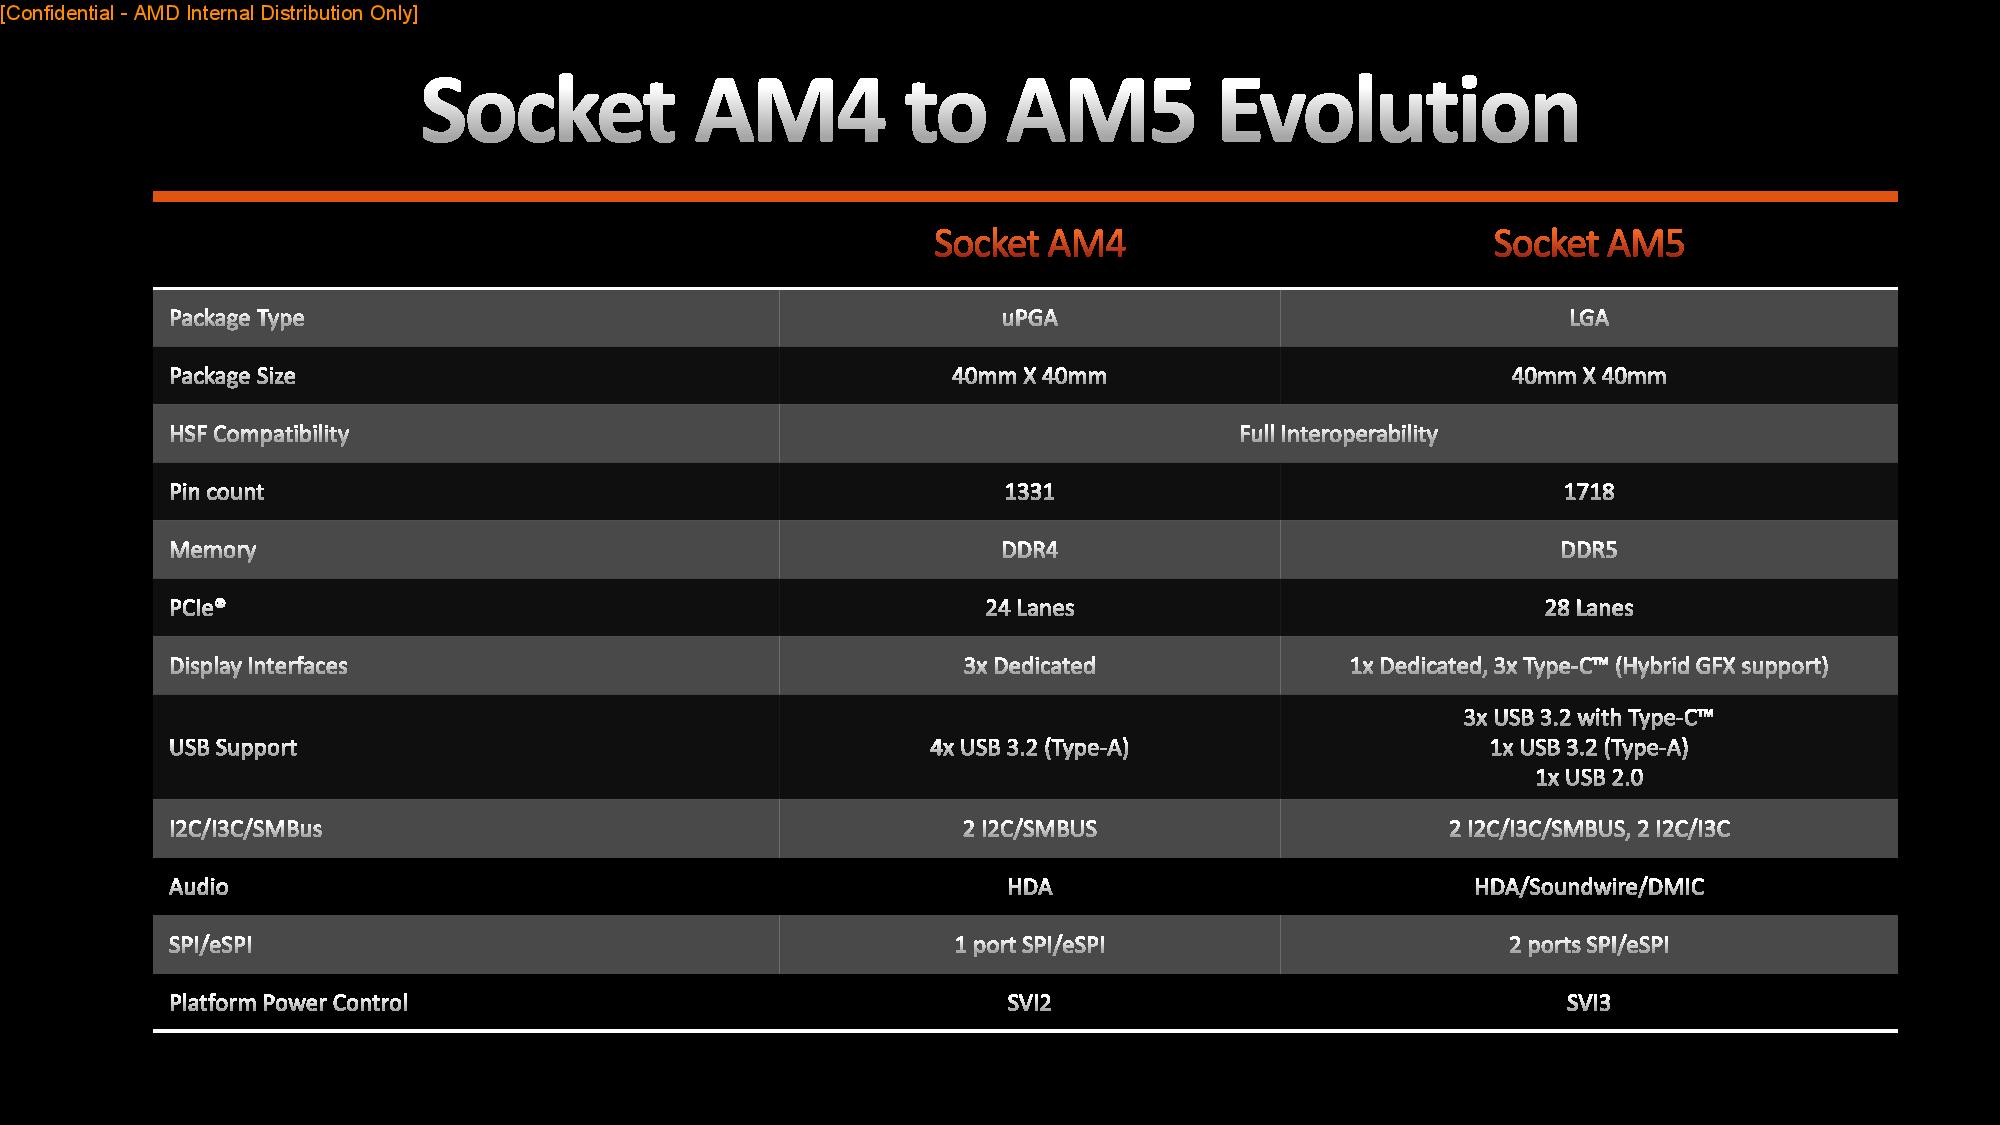
AMD says that it improved the platform power interface from SVI2 to SVI3, allowing it to move from two variable power rails to three, thus enabling better control of the power delivery to the socket. The SVI3 interface provides continuous and more accurate telemetry for voltage, current, power, and temperature for multiple onboard voltage regulators, while SVI2 didn’t allow monitoring of power and temperature. SVI3 also enables enhanced power states that help save power, like phase shifting (shutting off phases when not needed).
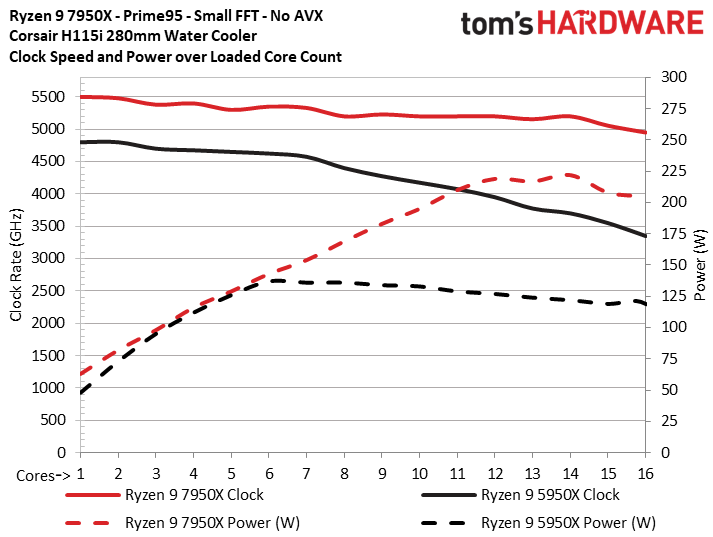
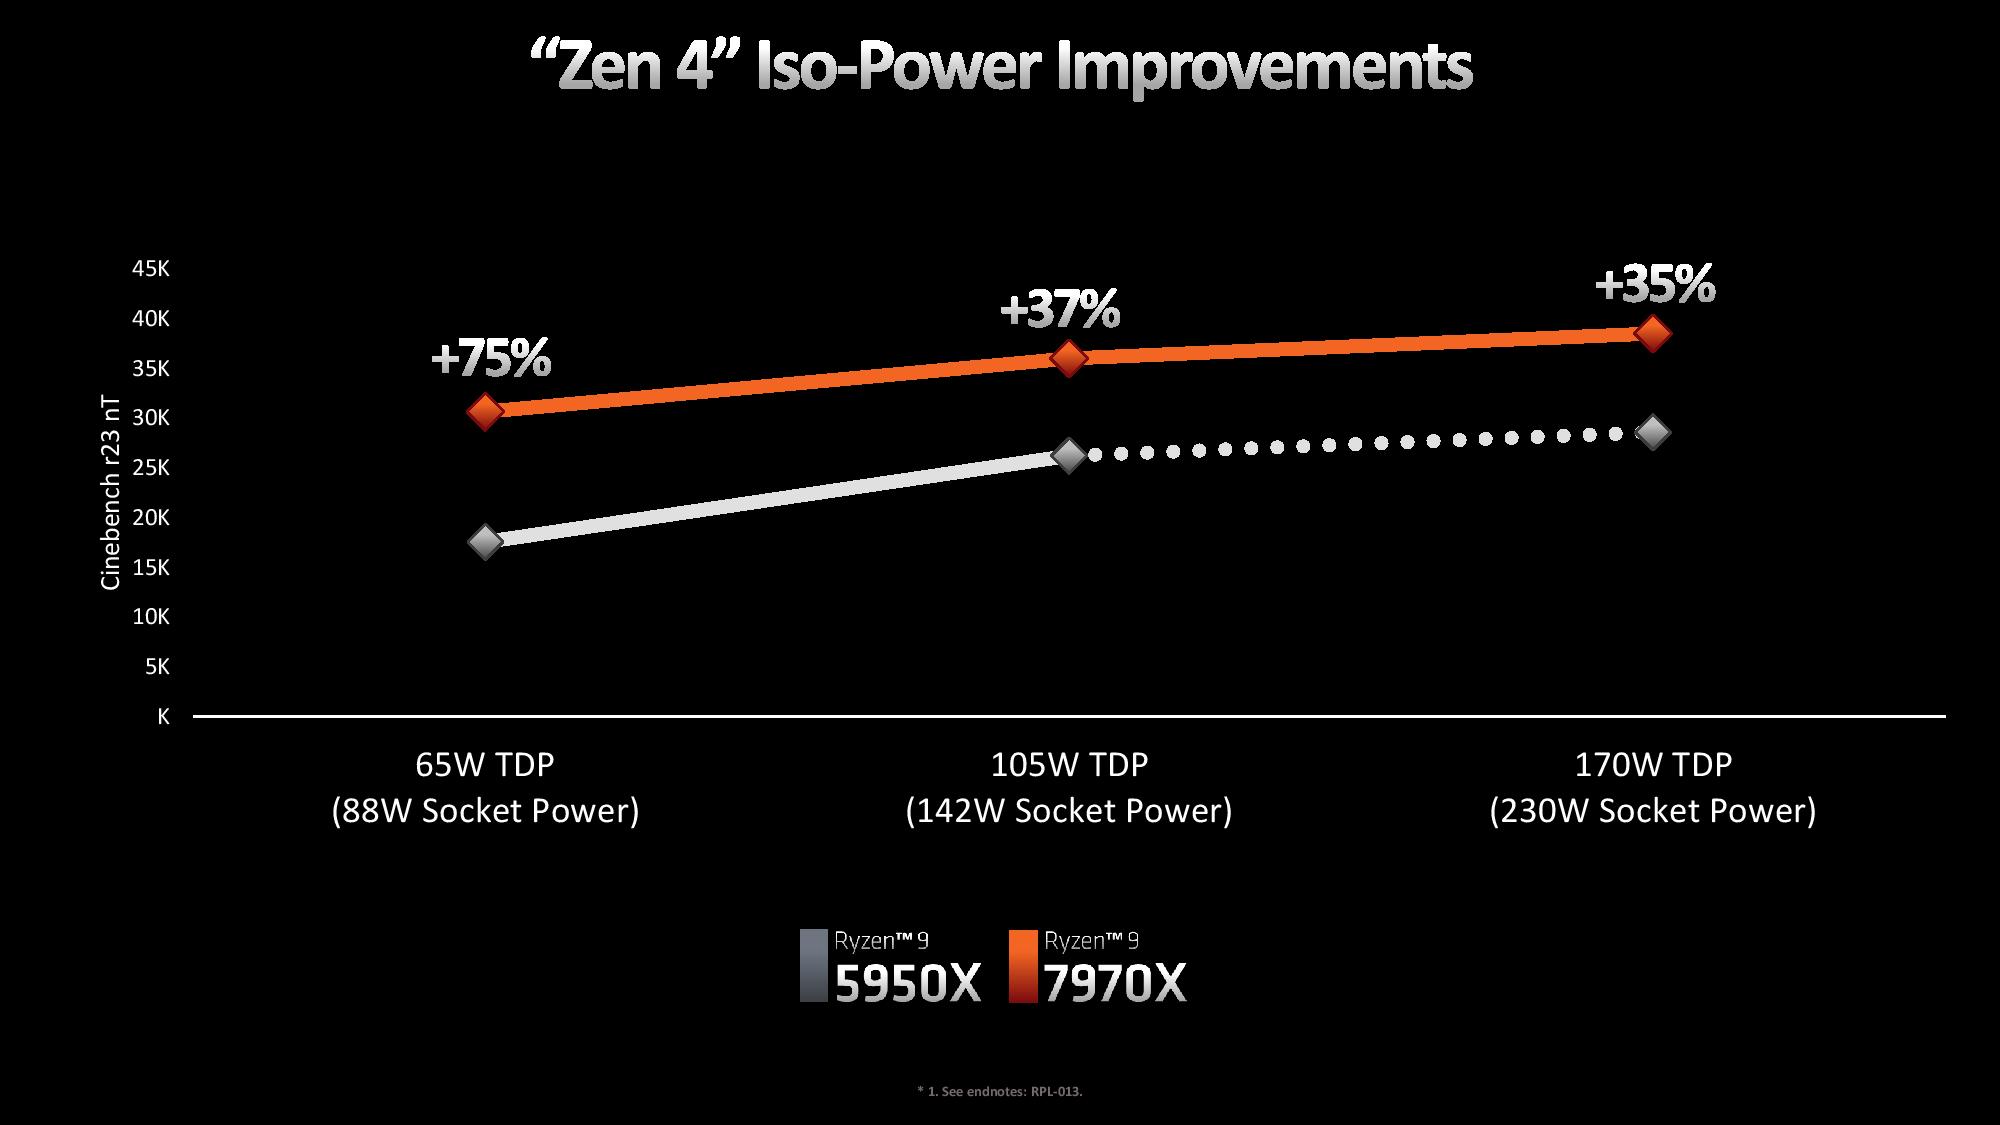
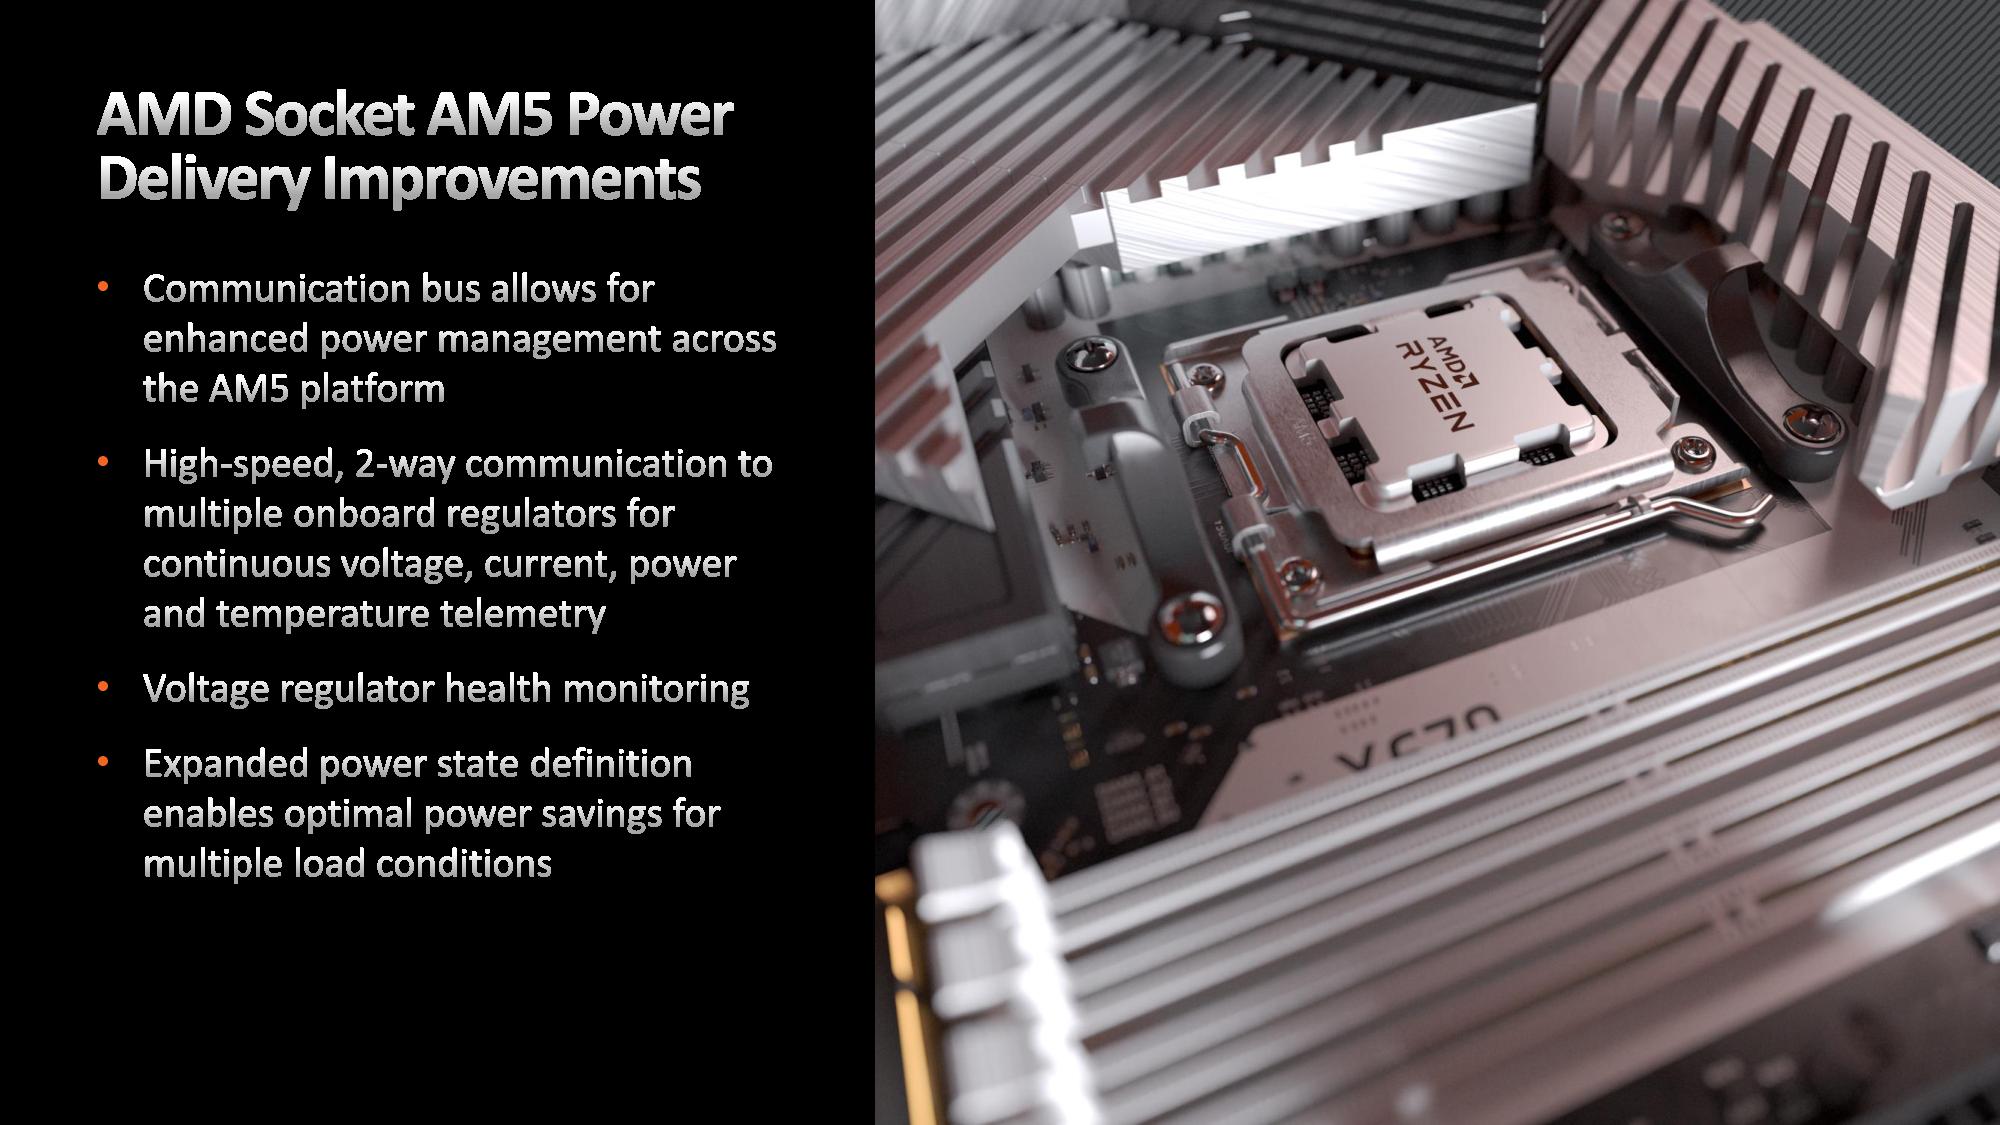
The culmination of these power delivery improvements is that AMD can unlock higher levels of performance that stretch beyond IPC gains. Above we plotted the clock speed for the Ryzen 9 7950X and previous-gen 5950X on the left-hand side of the chart as we slowly loaded the cores with a Prime95 SSE workload (this draws more peak power than the AVX tests). As you can see, the 7950X maintained 5 GHz with all cores loaded, but the 5950X dropped to 3.4 GHz.
We also plotted the power on the right-hand side of the chart. As you can see, the Ryzen 9 5950X reached its peak power consumption with six cores loaded, after which power plateaued until we loaded ten cores. It then began to decline as we worked our way up to loading all 16 cores. This is a known tendency for the 5950X – socket power limitations apparently resulted in uneven power/voltage delivery at higher power levels, thus requiring the chip to dial back its frequency after reaching a certain threshold.
In contrast, the Ryzen 9 7950X continues to consume increasing amounts of power until 12 cores are loaded. Power consumption only declines slightly after that, and the clock reductions are far less severe. The end result is higher clock frequencies during nearly all loading conditions, which helps enable the massive performance boosts we saw in our test suite.
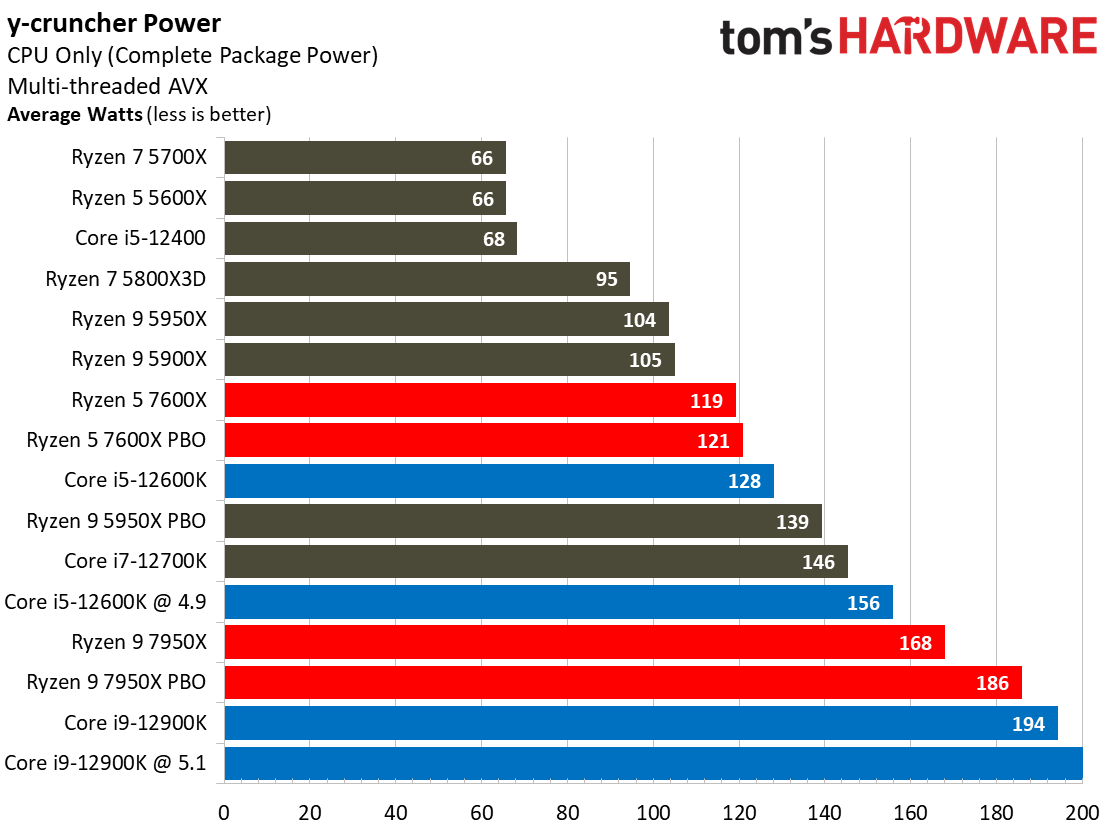
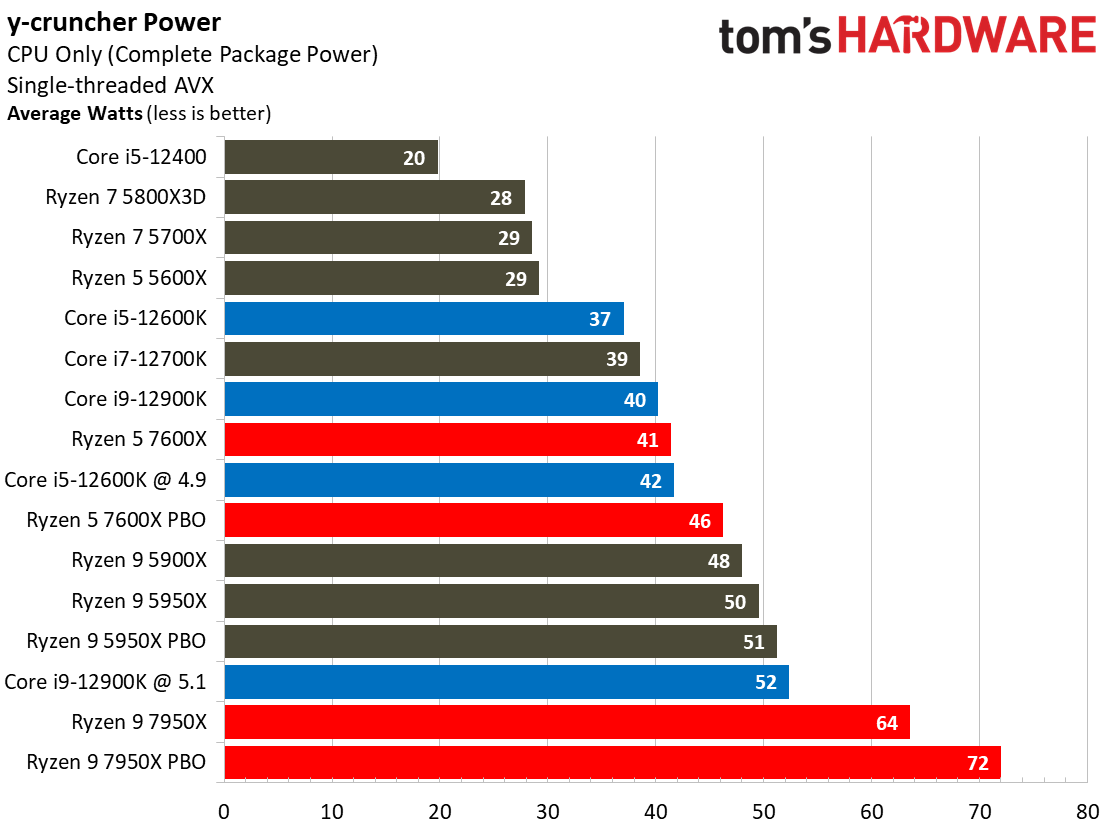
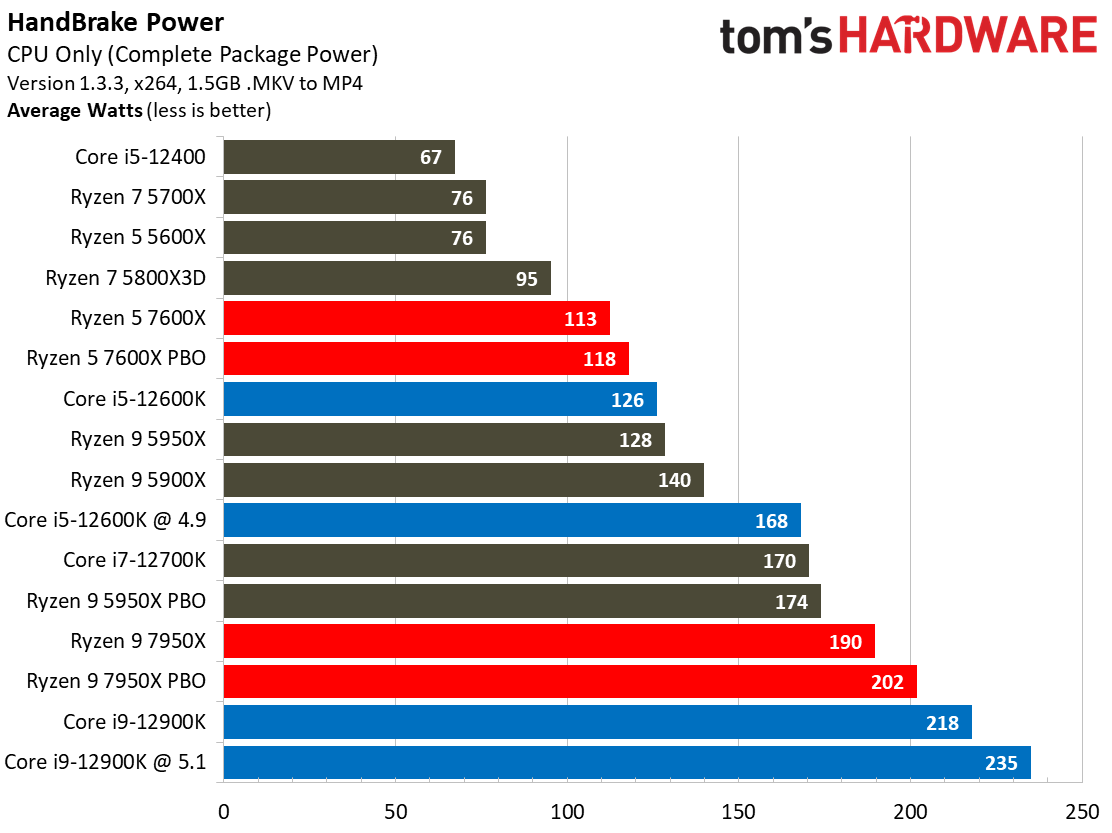
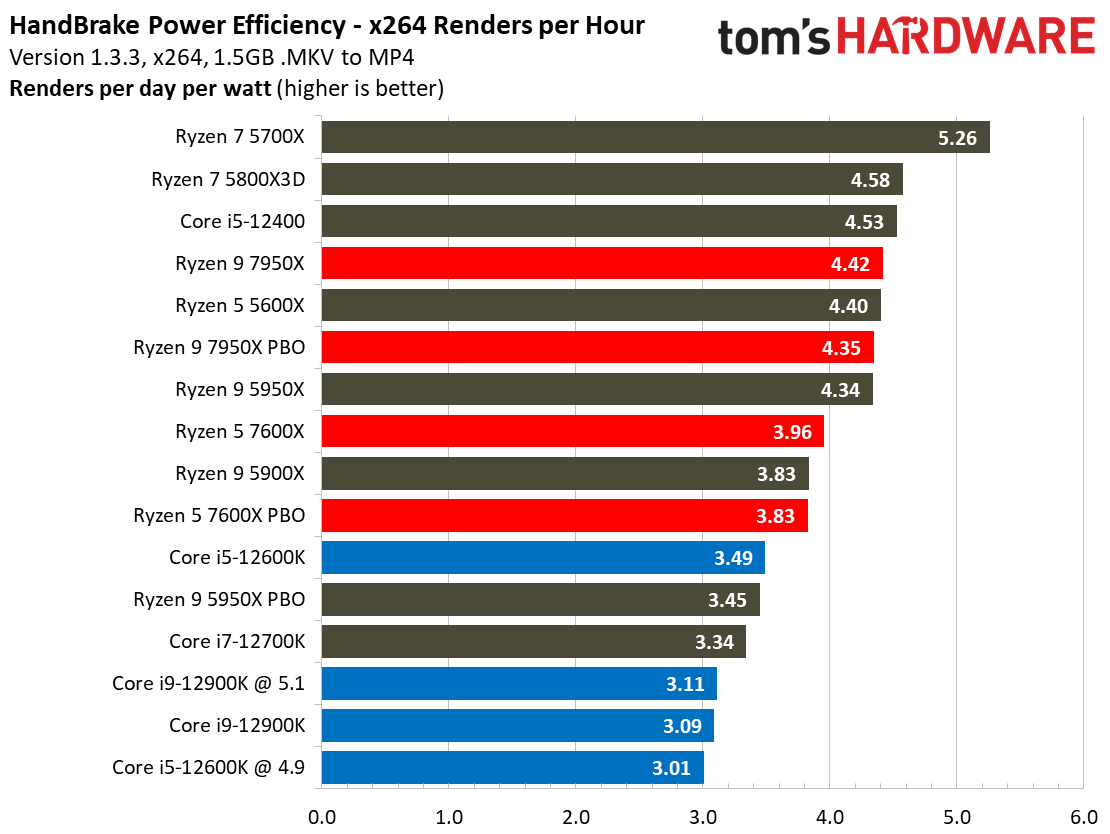
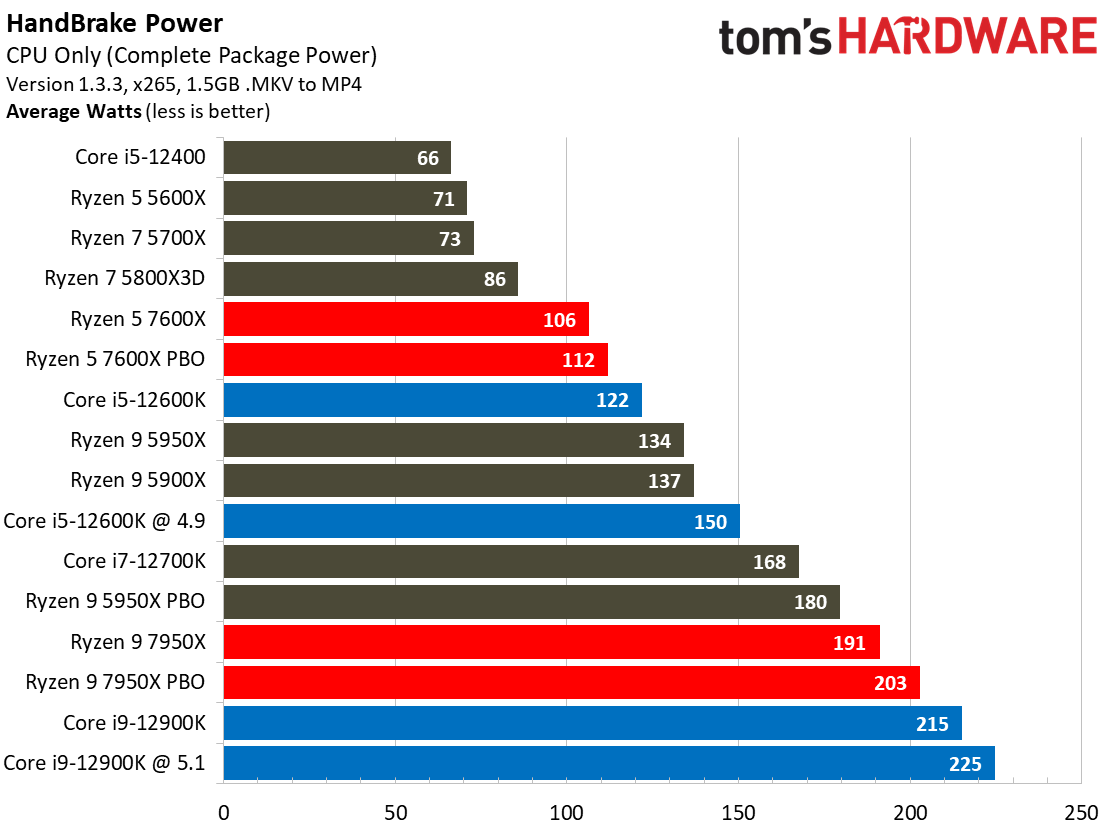
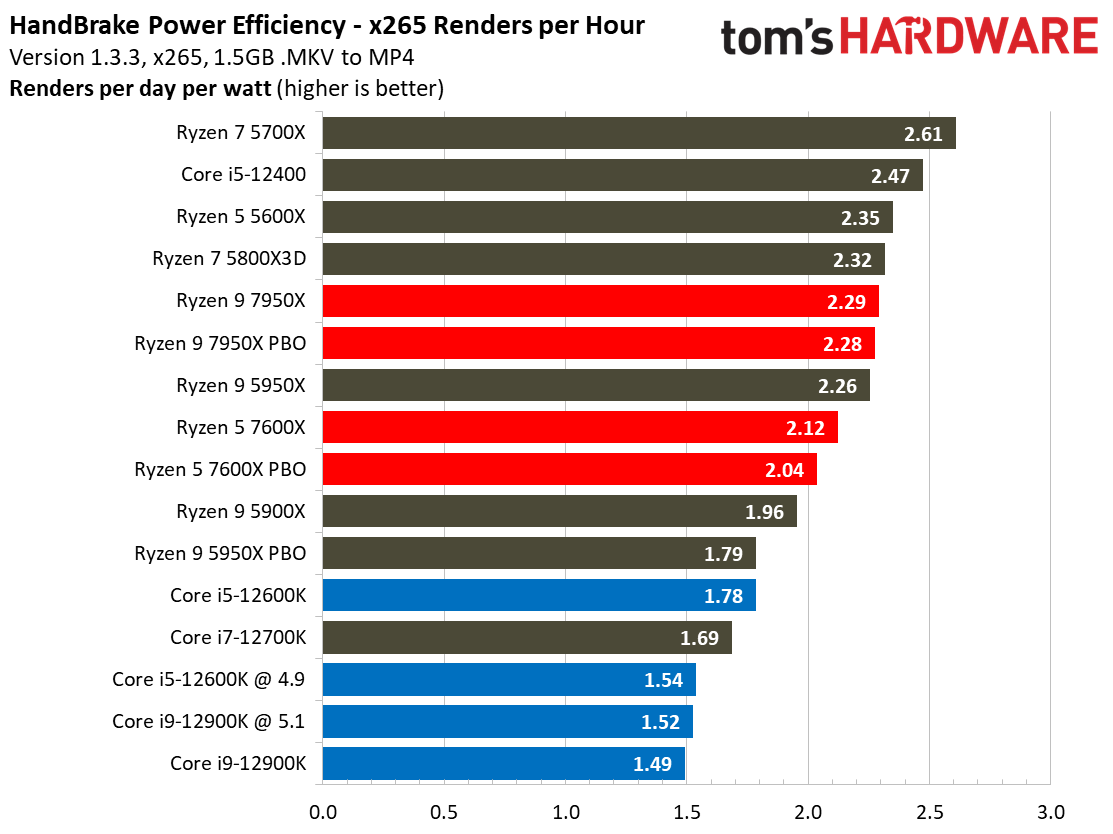
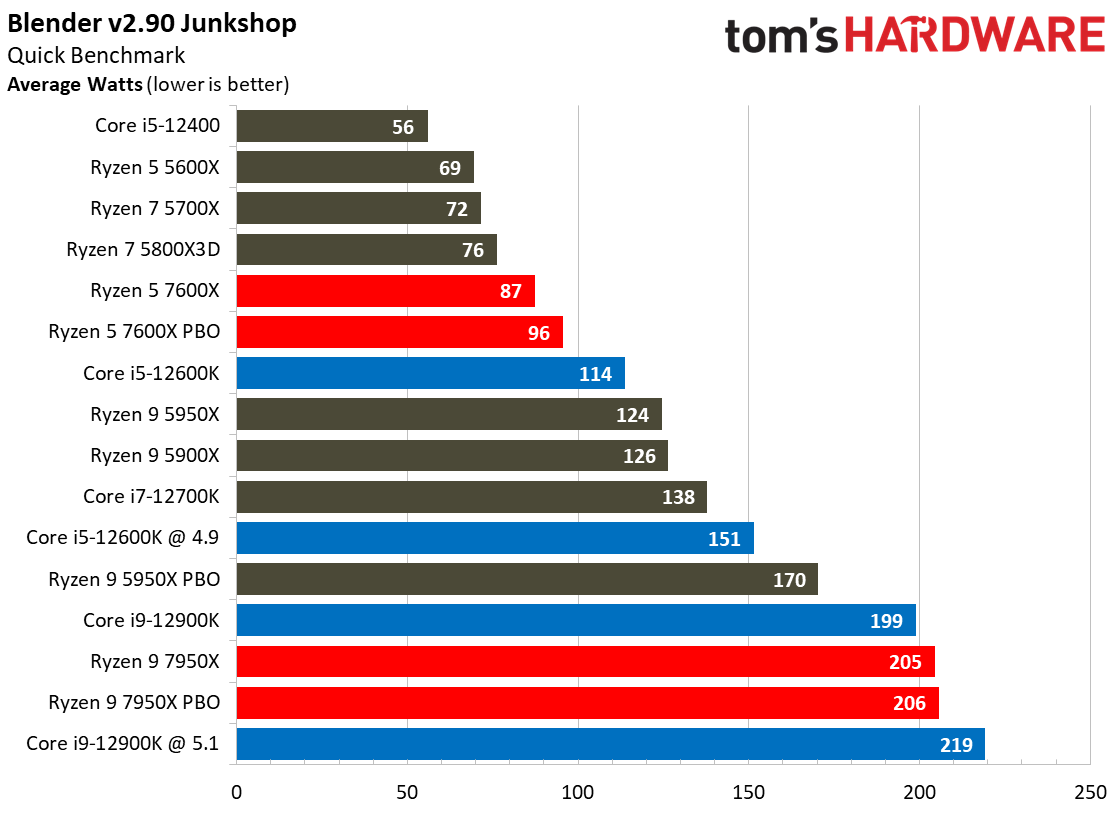
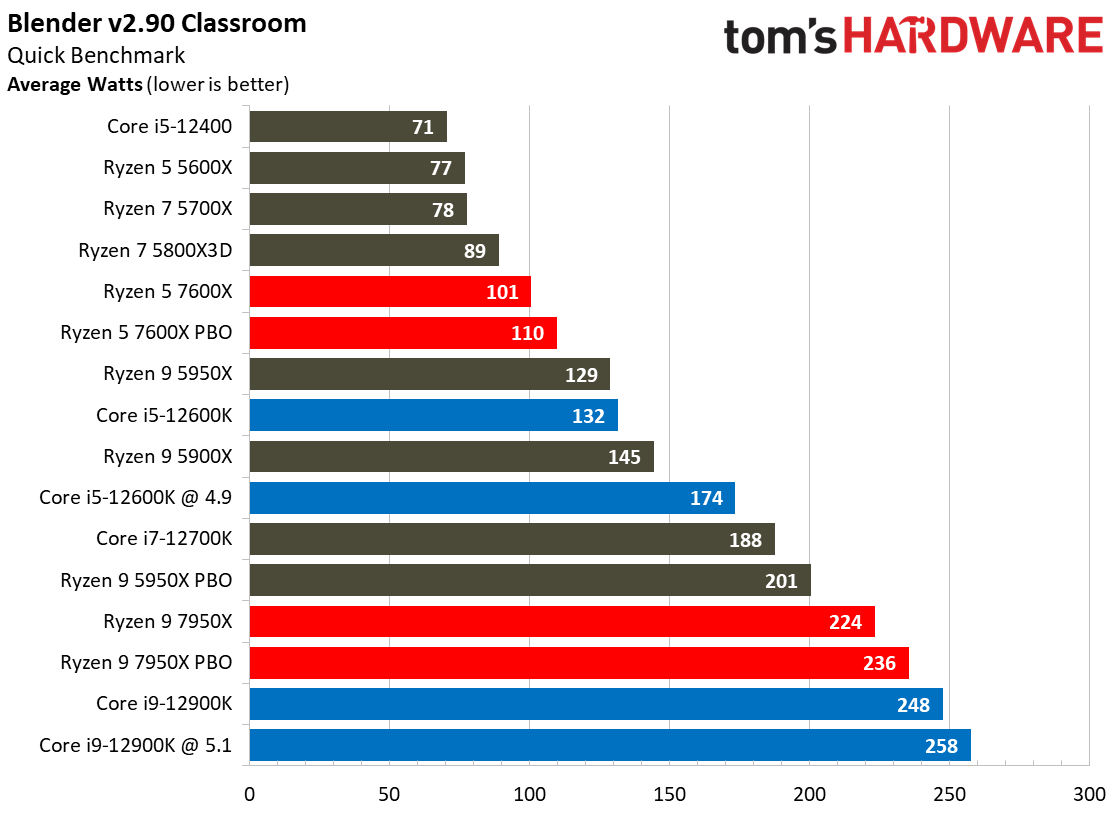
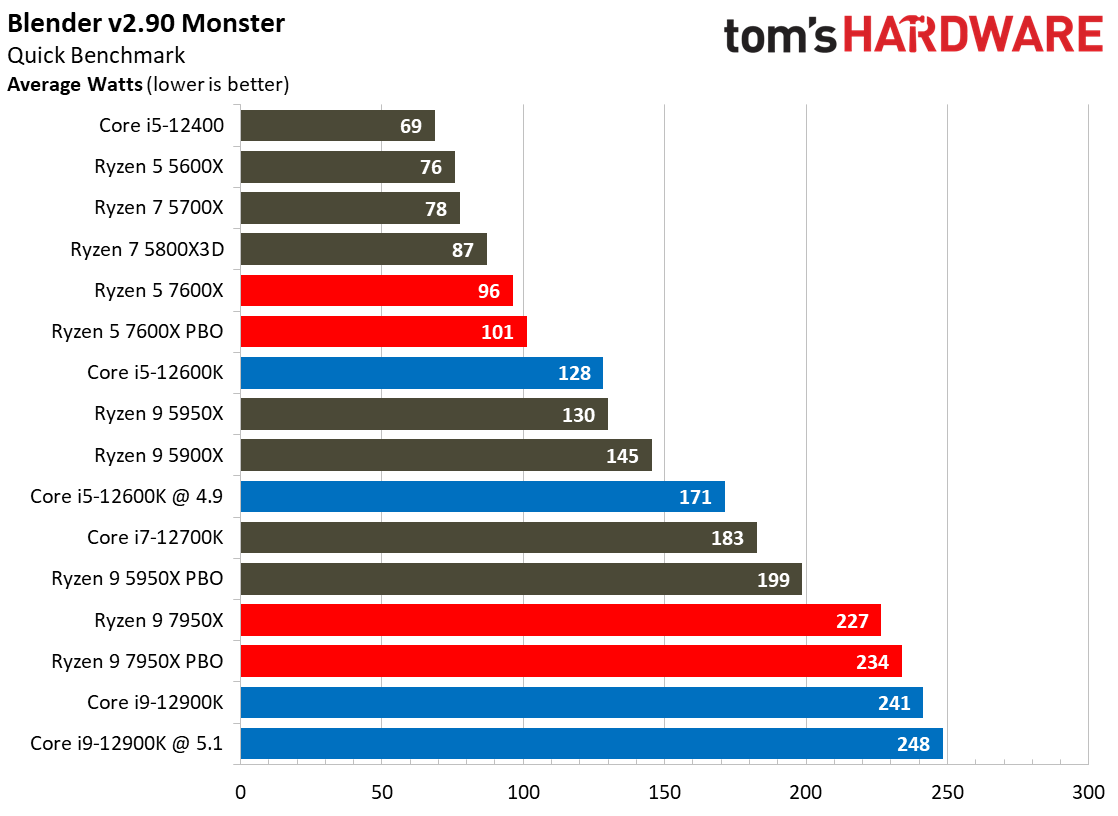
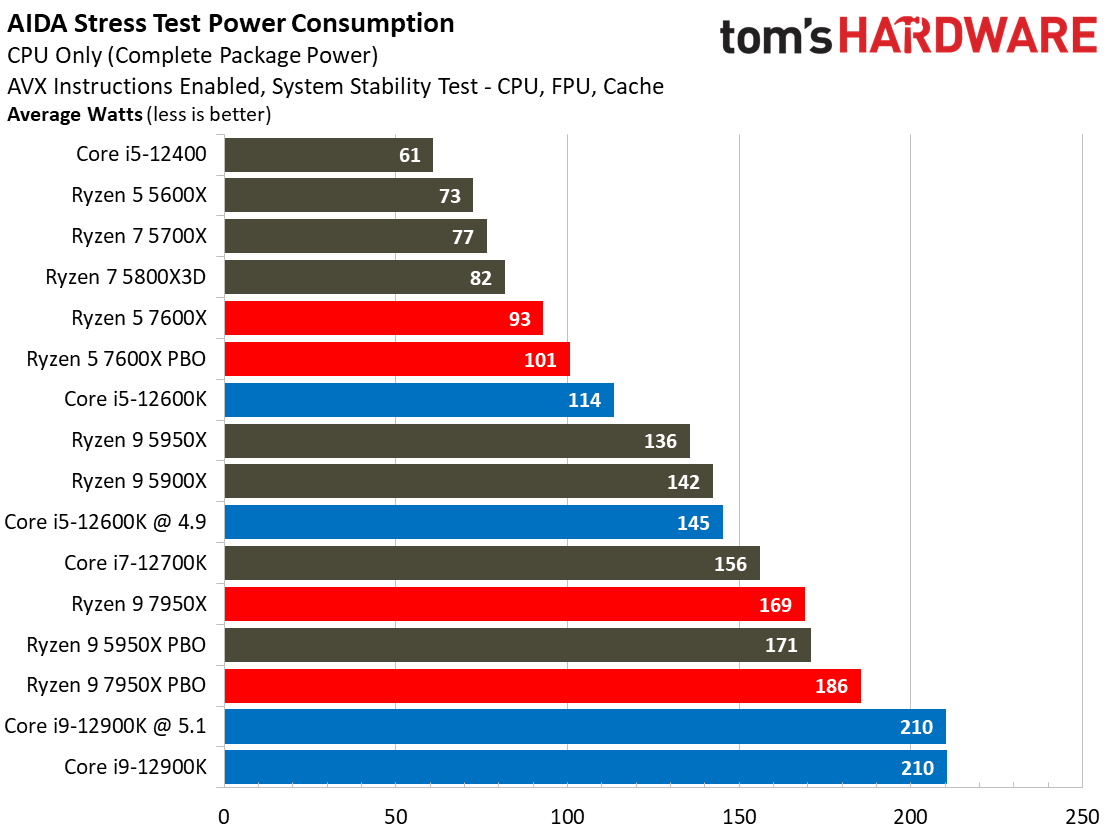
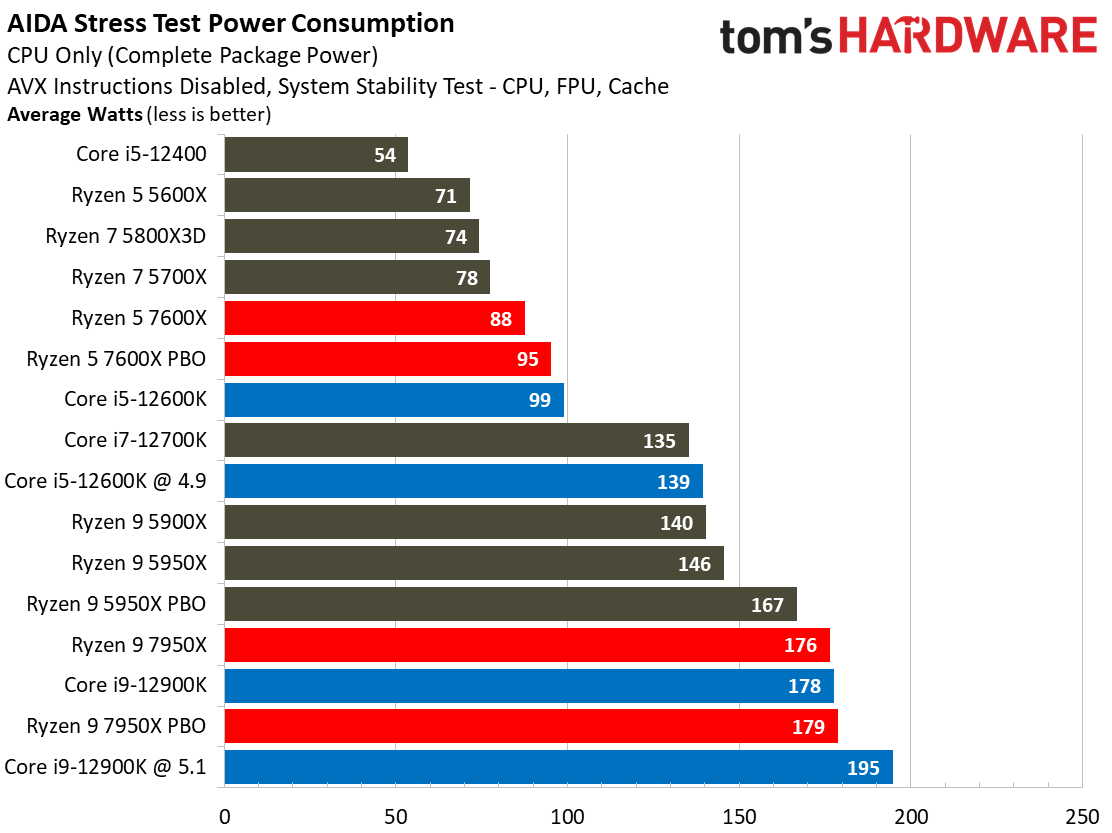
As expected, our power measurements find the Ryzen 7000 chips drawing significantly more power than the previous-gen Ryzen 5000 models, and that’s by design. Despite Ryzen’s gen-on-gen increase in power consumption, Intel’s Alder Lake processors still consume more power while delivering less performance.
The renders-per-day-per-watt charts show that the Ryzen 5 5600X is more power efficient than the Ryzen 5 7600X in the x264 HandBrake workload, but the stock Ryzen 9 7950X basically matches the prior-gen Ryen 9 5950X. However, as we know from our benchmarks, the 7950X is much faster than the 5950X in this specific workload, which we can see below.
Get Tom's Hardware's best news and in-depth reviews, straight to your inbox.
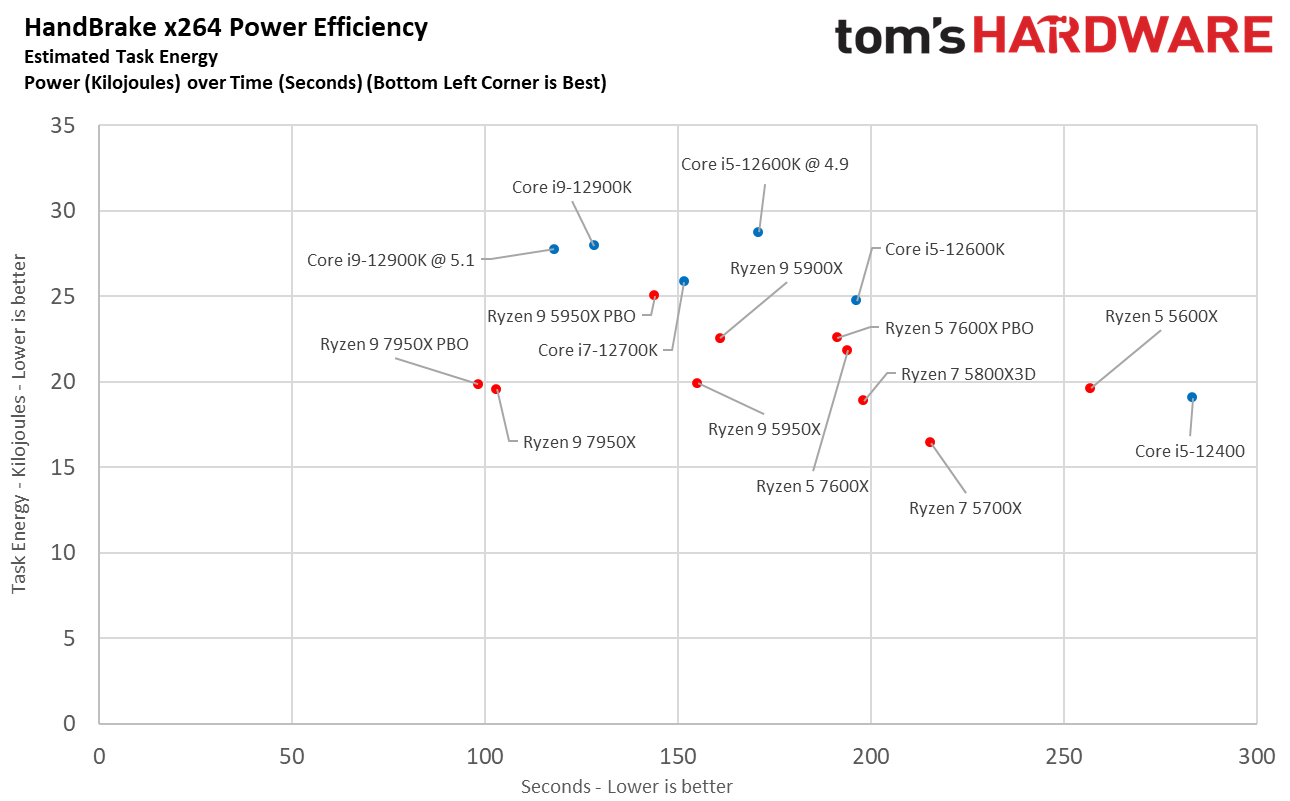
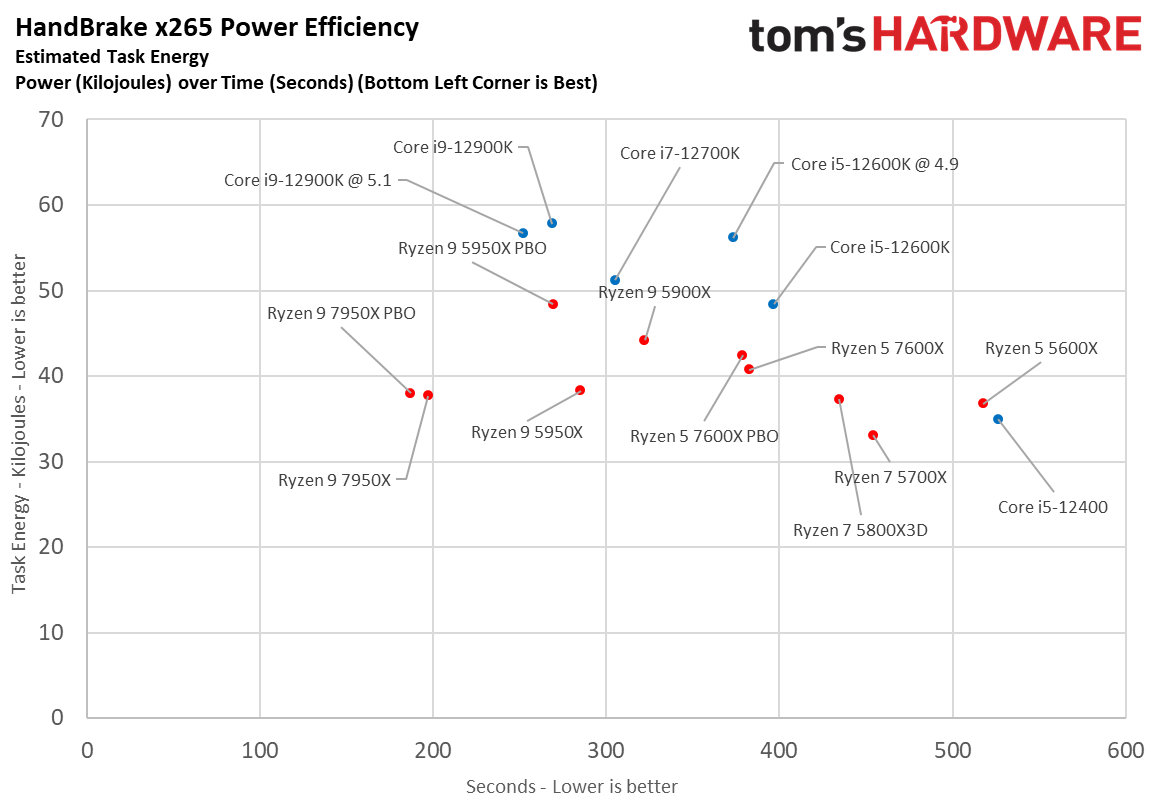
Here we take a slightly different look at power consumption by calculating the cumulative energy required to perform x264 and x265 HandBrake workloads, respectively. We plot this 'task energy' value in Kilojoules on the left side of the chart.
These workloads are comprised of a fixed amount of work, so we can plot the task energy against the time required to finish the job (bottom axis), thus generating a really useful power chart.
Remember that faster compute times, and lower task energy requirements, are ideal. That means processors that fall the closest to the bottom left corner of the chart are the best. Overall, AMD traded power efficiency for outright performance with its halo Ryzen 9 7950X. As always, the last few percentage points of performance often come at the expense of double-digit percentage increases in power consumption.
- MORE: Best CPUs for Gaming
- MORE: CPU Benchmark Hierarchy
- MORE: AMD vs Intel
- MORE: Zen 4 Ryzen 7000 All We Know
- MORE: Raptor Lake All We Know
Current page: Power Consumption and Efficiency Ryzen 9 7950X and Ryzen 5 7600X
Prev Page Zen 4 Microarchitecture and IPC Measurements, Test Setup Next Page Boost Frequencies, Power, and Thermals AMD Ryzen 9 7950X and Ryzen 5 7600X
Paul Alcorn is the Editor-in-Chief for Tom's Hardware US. He also writes news and reviews on CPUs, storage, and enterprise hardware.
-
-Fran- Thanks for the review(s)!Reply
Good to see more reaffirmation these CPUs don't have a performance problem, but a platform cost (or "cost of entry") problem with them. I hope AMD can alleviate it a bit so they become more of a mainstream crowd fav.
One small point that I won't really defend much, but buying into the AM5 platform, you buy into several years of support. The huge caveat is you have to trust not only AMD, but the partners to go with it and roll the BIOS updates down the line. This being said, after AM4, I'd imagine both AMD and partners have seen it does matter they do keep supporting newer CPUs and see that as a strength. Maybe partners would rather convince you to buy a new motherboard, but allowing this "mix and match" with generations does help overall sales; or so it is my impression. Plus, we all know which motherboard vendors actually followed through with the updates, so they'll get more sales once B650 launches. Could Tom's have the list of motherboards from the 300-series chipsets that do support Ry5K? That would actually help track which partners are indeed reliable and can be trusted with buying into AM5.
Regards. -
Alvar "Miles" Udell The headline: AMD Ryzen 9 7950X and Ryzen 5 7600X Review: A Return to Gaming DominanceReply
The reality: 5800X3D performs better in games than either of those. -
-Fran- Reply
To be pedantic, the title is correct. They now have more than just 1 CPU topping the charts and most (if not all) above Intel offerings.Alvar Miles Udell said:The headline: AMD Ryzen 9 7950X and Ryzen 5 7600X Review: A Return to Gaming Dominance
The reality: 5800X3D performs better in games than either of those.
You'd be correct if the title was something like "7950X is the new gaming overlord/king/champion*" or something that implies "the CPU is 1st in gaming", which as you clearly noticed, it is not.
Plus, it depends on the game anyway.
Regards. -
BogdanH I didn't read the article, simply because it's too long -quick view on some of pages gave me impression, that there's a lot of repeating from previous articles.. so why bother.Reply
Another reason why I didn't read, is the title. When I see a CPU like 7900X/7950X (or Intel's pendant) in conjunction with "gaming", I can already imagine the content. I assume, such title should grab the attention... I'm not sure who's attention, though. Are you trying to convince "gamers" to shell out 800€ for CPU alone? Yes, there's always said, that for gaming alone, it's "wiser" to get 7600X (or 5800X3D) -but such title still imply that 7950X is simply "the right thing"... "if you wish to have it all..". -again, that's my impression, so feel free to diagree.
Ok, so you say (for example), 7950X is 15% faster (in whatever) than 5950X. Now, some of this performance increase happens thanks to faster new DDR5 memory. And quite a lot performance increase (in my opinion) goes to much higher clock speed -which in turn comes back as heat dissipation. There's also faster PCIe5.0, etc ... Now I wonder, how much has actual CPU improved (compared to 5950X)? I mean IPC. Because if IPC is the same, then I see 7950X as a "brute force" improvement. In sense: Make it faster, no matter the costs (power draw & heat dissipation).
Yes, I know: 7950X finishes work faster (than 5950X) and so at the end, electricity bill will be lower. That's true if we look strictly from CPU side. But, if we take the cooling (of whole PC) into account, then the total power draw doesn't look that appealing anymore -especially in summer. In short: CPU is more efficient, but whole PC probably isn't.
I can read many times in forums, that many are already running their PC in eco-mode (to save energy, to make PC more silent, having less heat in room, etc) -they're ready to sacrifice fps by few percent for that. So I assume, what they wish or hope for, is certain performance increase, without affecting power draw -at least not by much.
I don't blame AMD/Intel/Nvidia for going into high power consumption direction. They know we wish everything faster (than it was in previous generation), so they do it -and many will buy it.. and that's the whole idea,
However, I do blame media for not putting more investigation/research into efficiency and write about that.
Just sharing my thoughts (being aware I may be wrong)
Bogdan -
DavidLejdar Reply-Fran- said:Thanks for the review(s)!
Good to see more reaffirmation these CPUs don't have a performance problem, but a platform cost (or "cost of entry") problem with them. I hope AMD can alleviate it a bit so they become more of a mainstream crowd fav.
...
If one wants to go for as cheap a build as possible e.g. just to play CS:GO, then yeah, the DDR5 requirement with AM5 may sure be off-putting. Myself, I will be upgrading in the near future from DDR3 anyhow, and (here) the extra cost for 32 GB DDR5-5200 (instead of DDR4-3200) is around 80 currently. At the same time, B650E has PCIe 5.0 both for GPU (16x) and NVMe at currently around 300-400 cheaper than what motherboards for Raptor Lake with the same connectivity cost (that is the few released so far). And only a handful of Alder Lake MBs have PCIe 5.0 for NVMe, while taking away 8 lanes from the GPU for that though.
So what I am currently looking at is around 250 for AM5 motherboard and 170 for 32 GB of DDR5 - which isn't as cheap as it can get, but should be plenty good for at least several years, giving me the option to upgrade individual parts later.
And to me that seems worth it to go for that, instead of saving perhaps 100 bucks with a Raptor Lake MB and DDR4 now, which likely won't support Meteor Lake already and would require me to get a lot of new parts then if I may want to boost performance in a year or two.
Of course, as you point out, not really a guarantee that even AMD directly may not push AM6 soon if Meteor Lake is taking it all to very new heights. But even if I upgrade the MB sooner than I was expecting, at least I will already have DDR5 to reuse, including having made use of it in the meantime.
BogdanH said:... . But, if we take the cooling (of whole PC) into account, then the total power draw doesn't look that appealing anymore -especially in summer. In short: CPU is more efficient, but whole PC probably isn't.
I can read many times in forums, that many are already running their PC in eco-mode (to save energy, to make PC more silent, having less heat in room, etc) -they're ready to sacrifice fps by few percent for that. So I assume, what they wish or hope for, is certain performance increase, without affecting power draw -at least not by much. ...
Very strictly taken, sure, the cooling uses some power too. But then again, a case fan has a power consumption of up to 6W, and CPU coolers (air or liquid) usually don't consume more than that. So even if all the cooling would take 20W at full load, that is 50 hours of full load to get to 1 kWh. And e.g. in the U.S., it is less than $1 for 4 kWh, isn't it?
The electricity costs can add up quickly though. E.g. if someone is gaming 50 hours a week at 700W, that's possibly up to 35 kWh right there, coming to 140 kWh a month.
Myself, I wouldn't know how to have that much time for gaming. So even if my rig would consume 700W, perhaps every other week to play at full load for a total of 10 hours, at the U.S. electricity price that would be less than $2.
Which isn't to say that it wouldn't be nice if there would be more improvement for power efficiency. But the review mentions that the Ryzen 5 7600X is a very sound choice for gaming (unless one can wait a few months to check out the gaming specific CPU). And that one has quite less Watt than the top tier one. And coupled with perhaps not the top-tier GPU around, e.g. the RTX 3060, which has around 200W, one can have a solid build which comes in at under 500W at full load. -
BogdanH Reply
-that's 20W (probably less) just to move hot air out of PC case into our room.. which we need to cool in summer days.DavidLejdar said:Very strictly taken, sure, the cooling uses some power too. But then again, a case fan has a power consumption of up to 6W, and CPU coolers (air or liquid) usually don't consume more than that. So even if all the cooling would take 20W at full load...
Many say, it's "only 10€/year more" (or whatever number).. but there are millions of PC's running. And if looking that way, we can see see how much energy is wasted.. and is really not about who can afford to pay electricity and who can't.
Best wishes,
Bogdan -
chalabam Der Bauer has shown that this CPU is 20 degrees hotter than it should be due to bad packagingReply -
Sluggotg Nice new lineup for AMD. Looking forward to the industry moving to PCIE 5 and USB 4. The 7600 is very impressive. (For 300 Bucks!). With Intel's new chips coming out next month we should see some very healthy competition that will hopefully lead to overall lower prices. With the New CPUs and the New Graphics cards all coming out in the next several months, we should be able to do some nice upgrades. Hopefully the Scalpers will fail to corner the market.Reply -
-Fran- Reply
Er... Paul (the article) did include IPC measurements and a couple parragraphs to that. Zen4 is indeed faster, clock for clock, than Zen3. It's just it gets more overall performance from the increased clocks (hence the higher power budget) than raw IPC improvements.BogdanH said:I didn't read the article, simply because it's too long -quick view on some of pages gave me impression, that there's a lot of repeating from previous articles.. so why bother.
Another reason why I didn't read, is the title. When I see a CPU like 7900X/7950X (or Intel's pendant) in conjunction with "gaming", I can already imagine the content. I assume, such title should grab the attention... I'm not sure who's attention, though. Are you trying to convince "gamers" to shell out 800€ for CPU alone? Yes, there's always said, that for gaming alone, it's "wiser" to get 7600X (or 5800X3D) -but such title still imply that 7950X is simply "the right thing"... "if you wish to have it all..". -again, that's my impression, so feel free to diagree.
Ok, so you say (for example), 7950X is 15% faster (in whatever) than 5950X. Now, some of this performance increase happens thanks to faster new DDR5 memory. And quite a lot performance increase (in my opinion) goes to much higher clock speed -which in turn comes back as heat dissipation. There's also faster PCIe5.0, etc ... Now I wonder, how much has actual CPU improved (compared to 5950X)? I mean IPC. Because if IPC is the same, then I see 7950X as a "brute force" improvement. In sense: Make it faster, no matter the costs (power draw & heat dissipation).
Yes, I know: 7950X finishes work faster (than 5950X) and so at the end, electricity bill will be lower. That's true if we look strictly from CPU side. But, if we take the cooling (of whole PC) into account, then the total power draw doesn't look that appealing anymore -especially in summer. In short: CPU is more efficient, but whole PC probably isn't.
I can read many times in forums, that many are already running their PC in eco-mode (to save energy, to make PC more silent, having less heat in room, etc) -they're ready to sacrifice fps by few percent for that. So I assume, what they wish or hope for, is certain performance increase, without affecting power draw -at least not by much.
I don't blame AMD/Intel/Nvidia for going into high power consumption direction. They know we wish everything faster (than it was in previous generation), so they do it -and many will buy it.. and that's the whole idea,
However, I do blame media for not putting more investigation/research into efficiency and write about that.
Just sharing my thoughts (being aware I may be wrong)
Bogdan
Regards. -
hotaru251 so zen 3 they held out entire generation for a 5700xReply
and now zen 4 its the 7800x missing...AMD ffs why do you do this?
and as said before...the cpu are great, but platform isnt worth it with 5800x3d existing.
(will likely change by time weg et 3d cache zen4 cpus)