ASRock Z97M OC Formula Motherboard Review
Skylake and the 100-series motherboards may have launched, but that won't stop our mainstream Z97 coverage. We now bring you the ASRock Z97M OC Formula.
Why you can trust Tom's Hardware
Test Results
How We Test
I already mentioned the PSU change in the Pro4 review, and that will carry on here and any future review from me unless noted otherwise.
The MSI Z97I-AC is retained on the charts for this review, but the ASRock Z97M-ITX/AC has been dropped. It had the biggest variance on the charts due largely to its limited CPU performance and thermal throttling. Come next review we'll be able to drop the MSI ITX board and have just mATX data.
As usual, prior to benching, each board is set to stock clocks. Speed Step and energy saving features are enabled, and the CPU fan is set to maximum. I use the Windows default "High performance" power option preset for everything except idle power consumption, where I use "Balanced."
We're looking for oddities in the bench scores. Boring benchmarks are good benchmarks for motherboards. Dramatic score leads are due to motherboards cheating with hidden clock boosts while a board lagging behind is usually a configuration conflict.
Synthetics
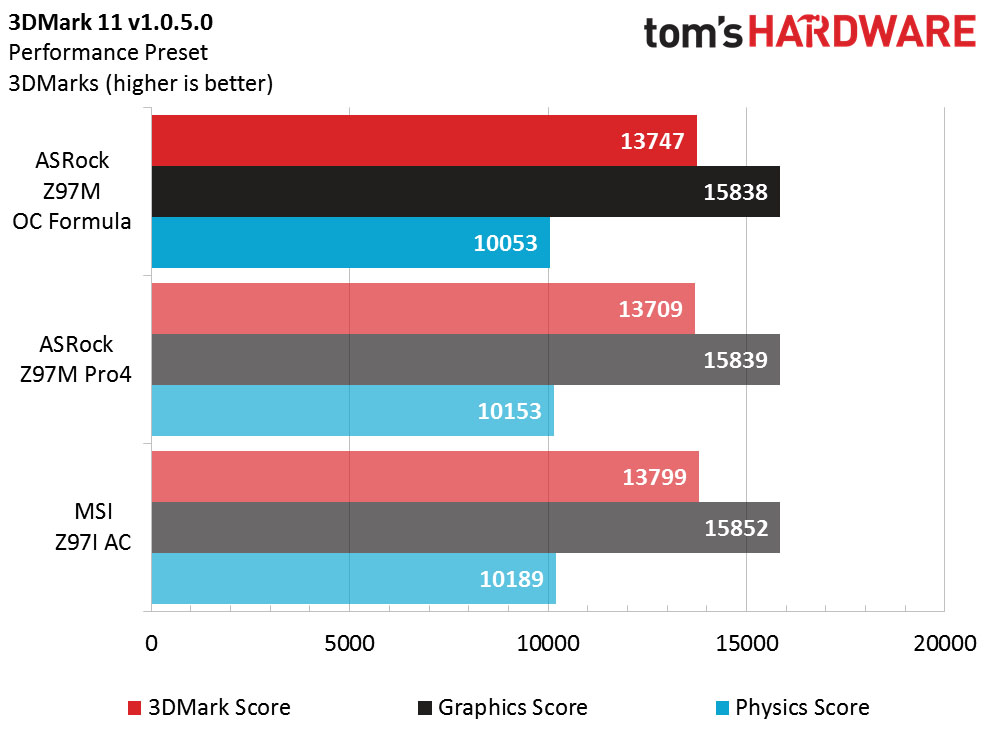
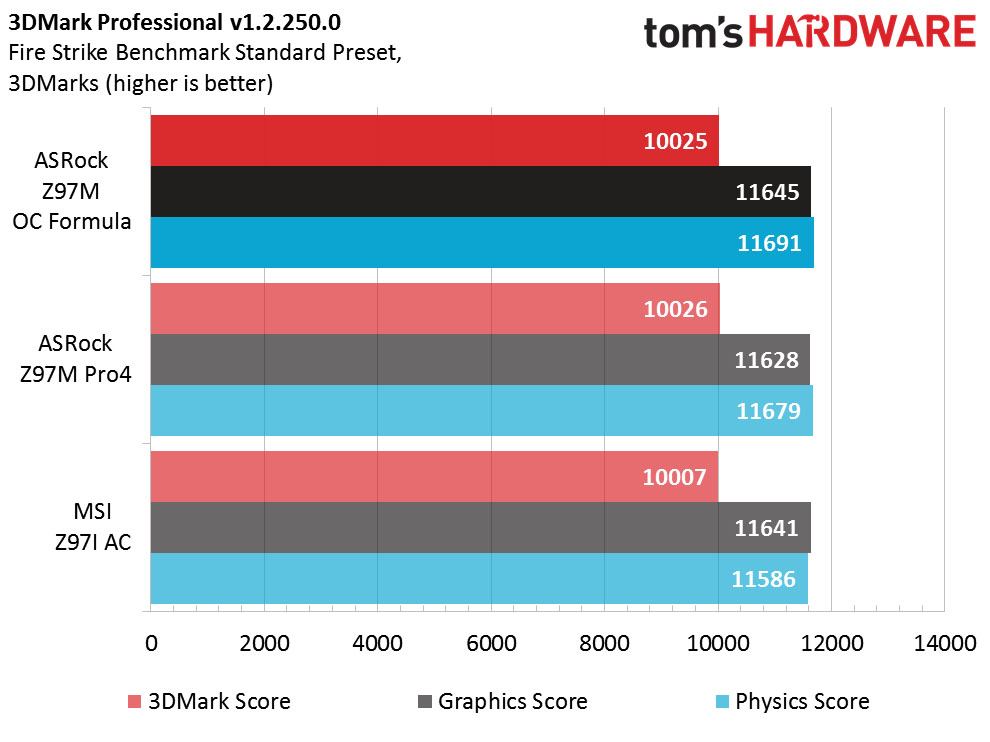
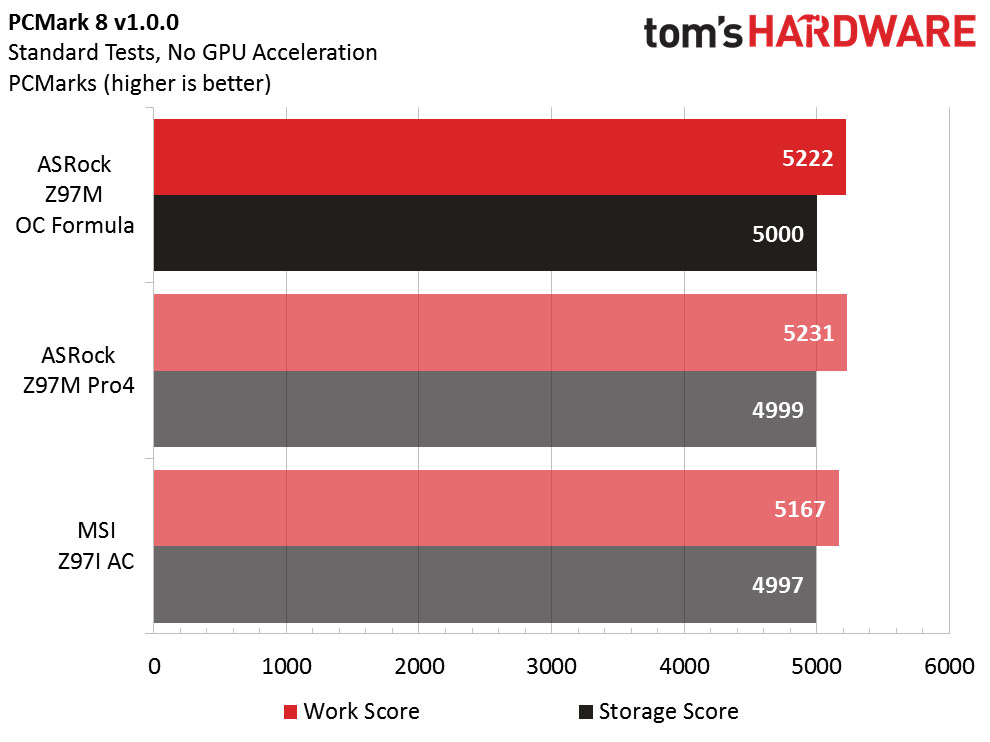
3DMark 11 shows a little variance, but nothing out of the ordinary. Fire Strike and PCMark scores are a dead heat.
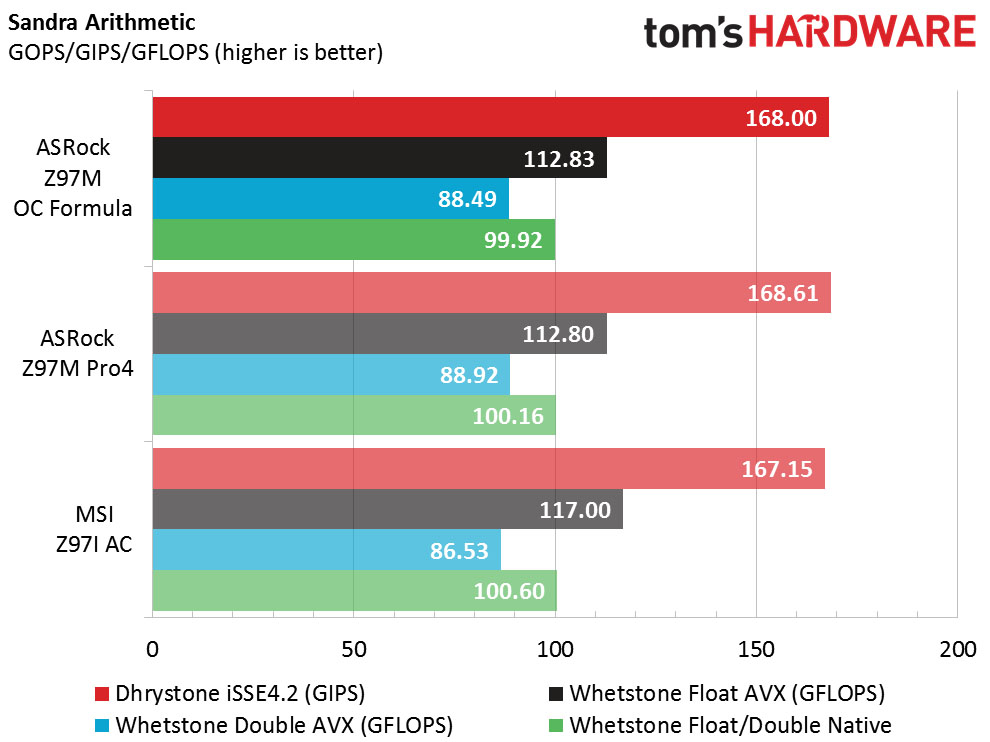
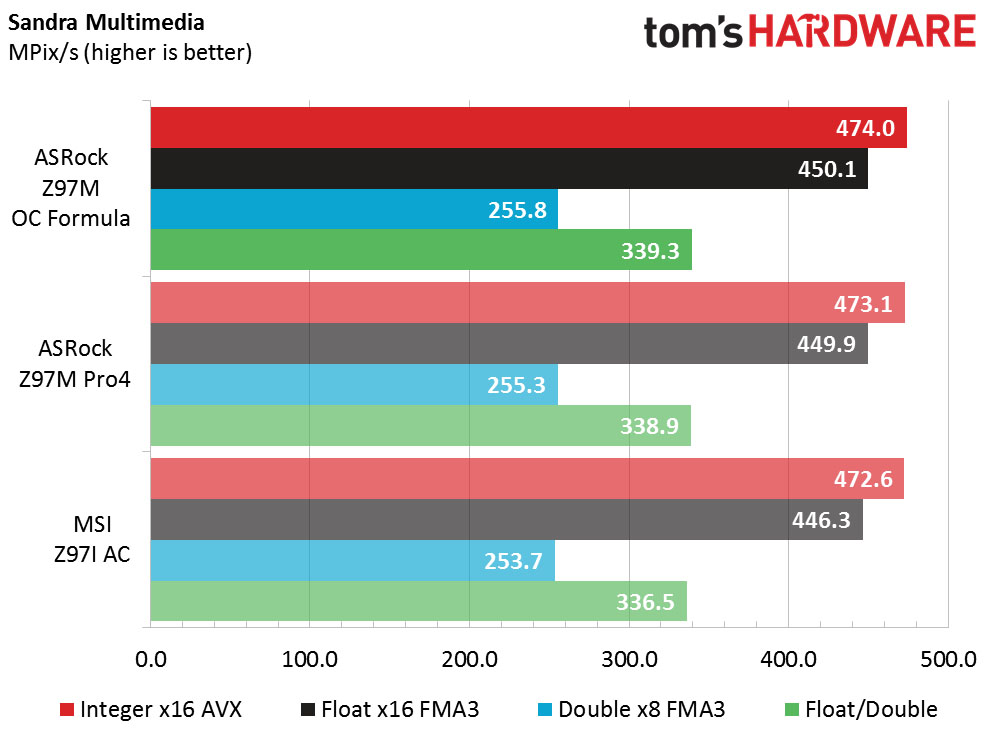
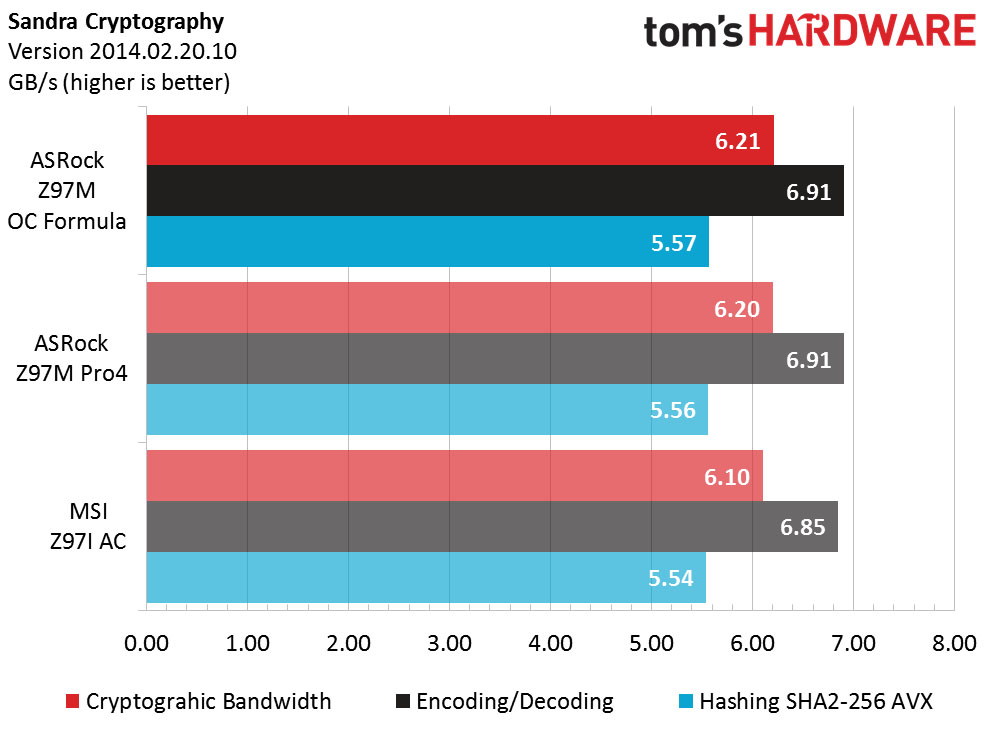
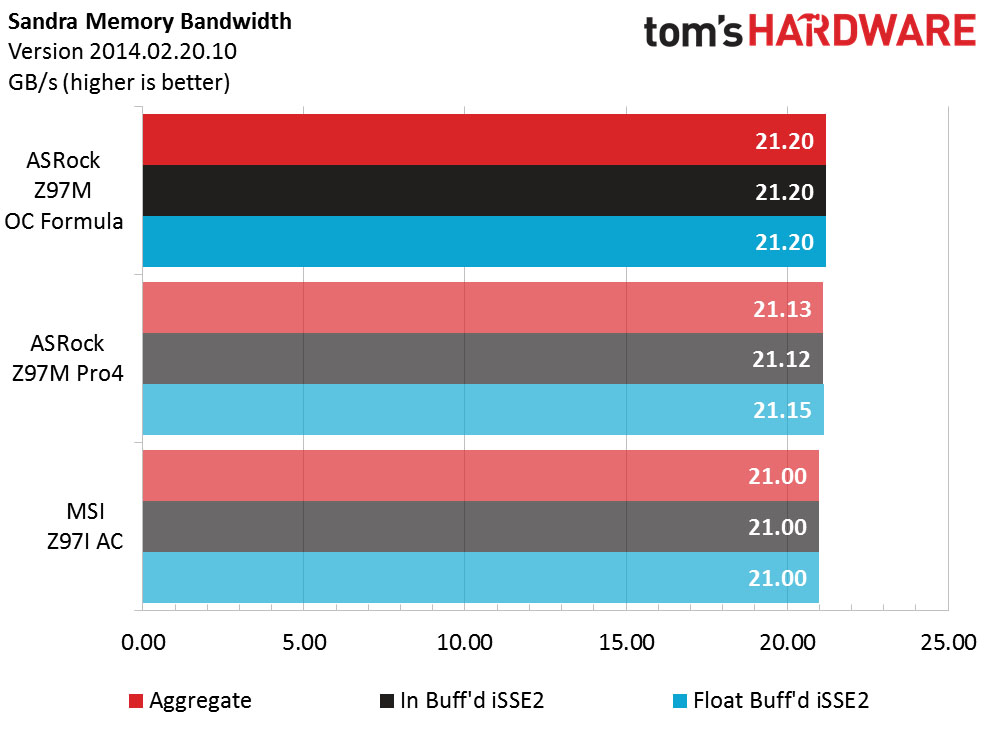
Sandra shows no abnormalities, and the scores are almost identical. This shouldn't be surprising considering we're mainly comparing two ASRock boards with the same BCLK system.
Gaming
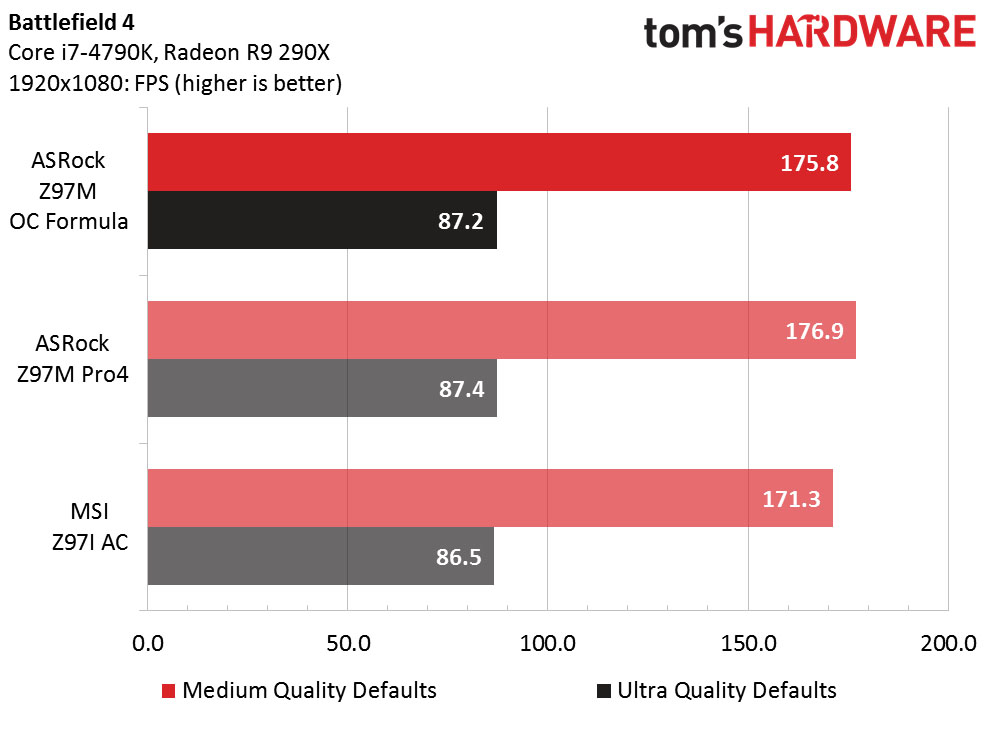
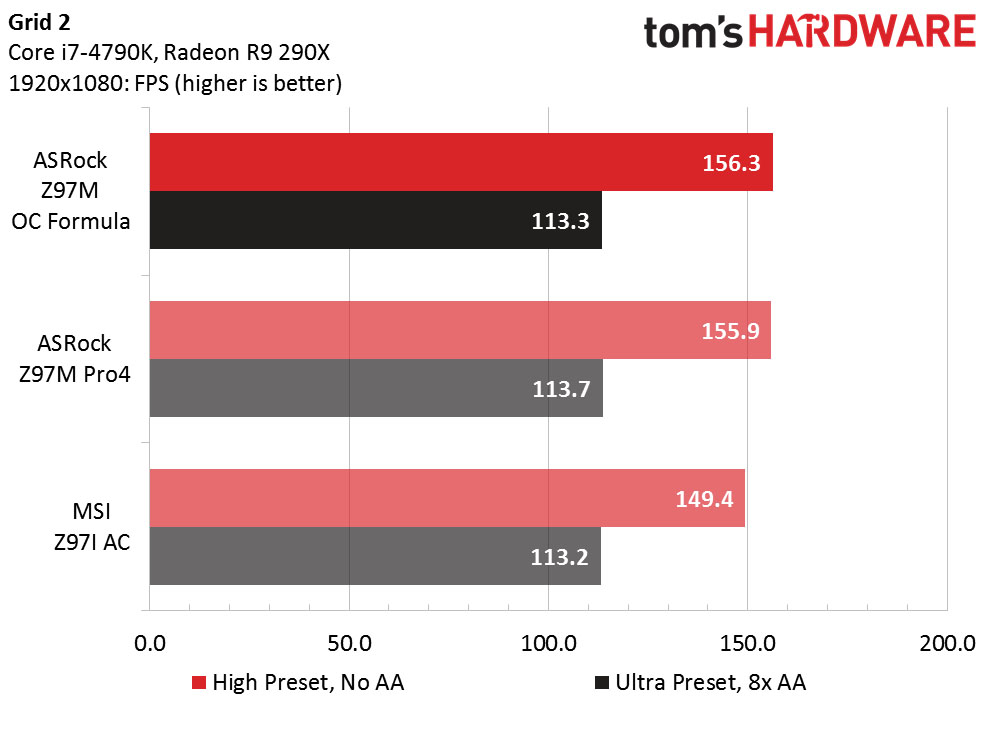
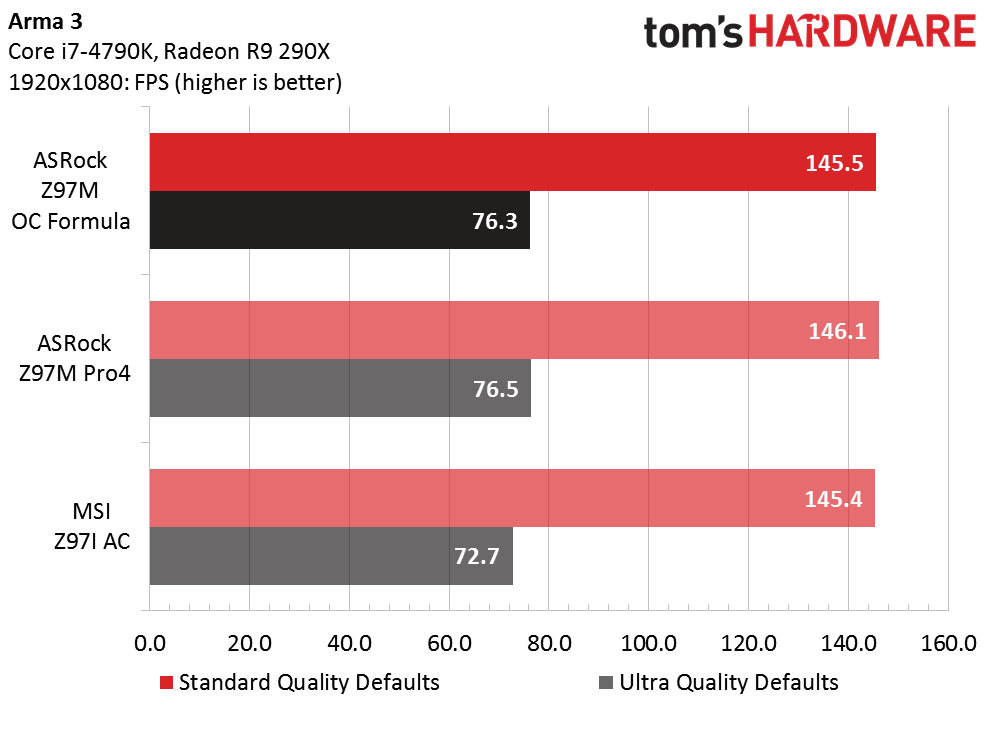
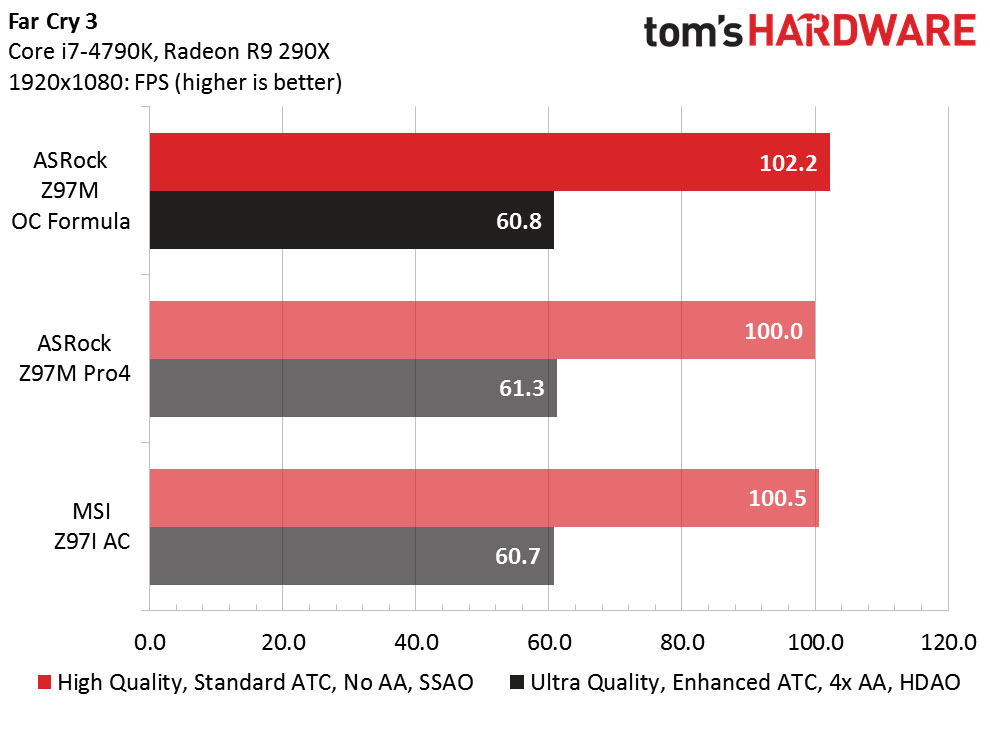
I saw some low scores originally in BF4 on Ultra during some early passes. This was due to a hot GPU. After fixing the air conditioner setting, framerates came back to expected settings. Everything else ran as expected.
Get Tom's Hardware's best news and in-depth reviews, straight to your inbox.
Applications
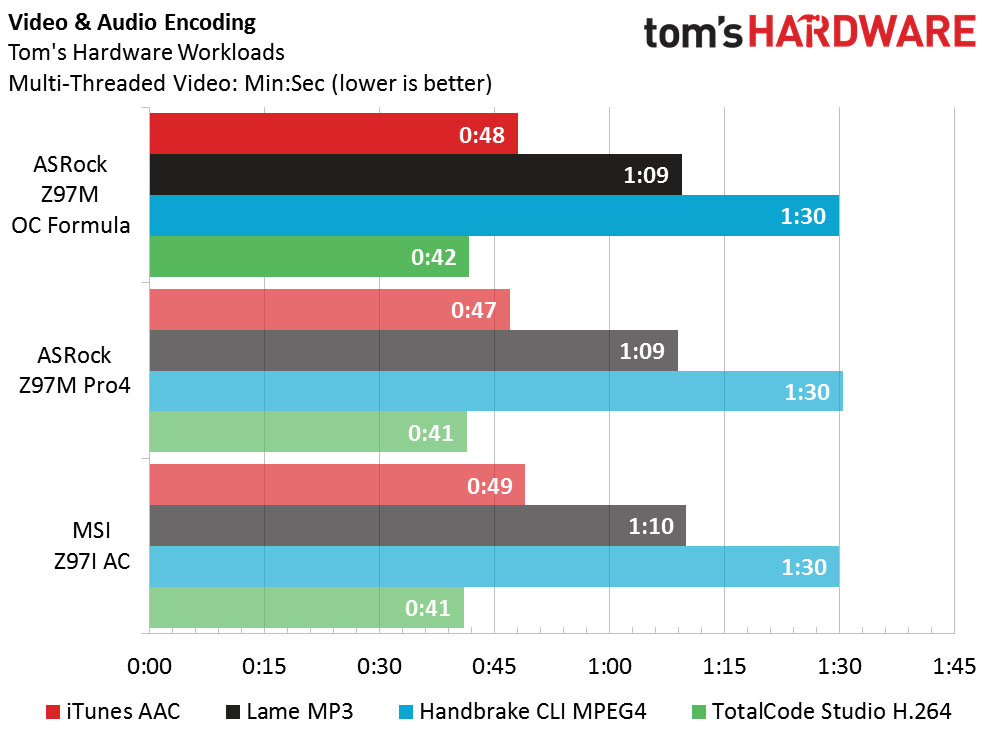
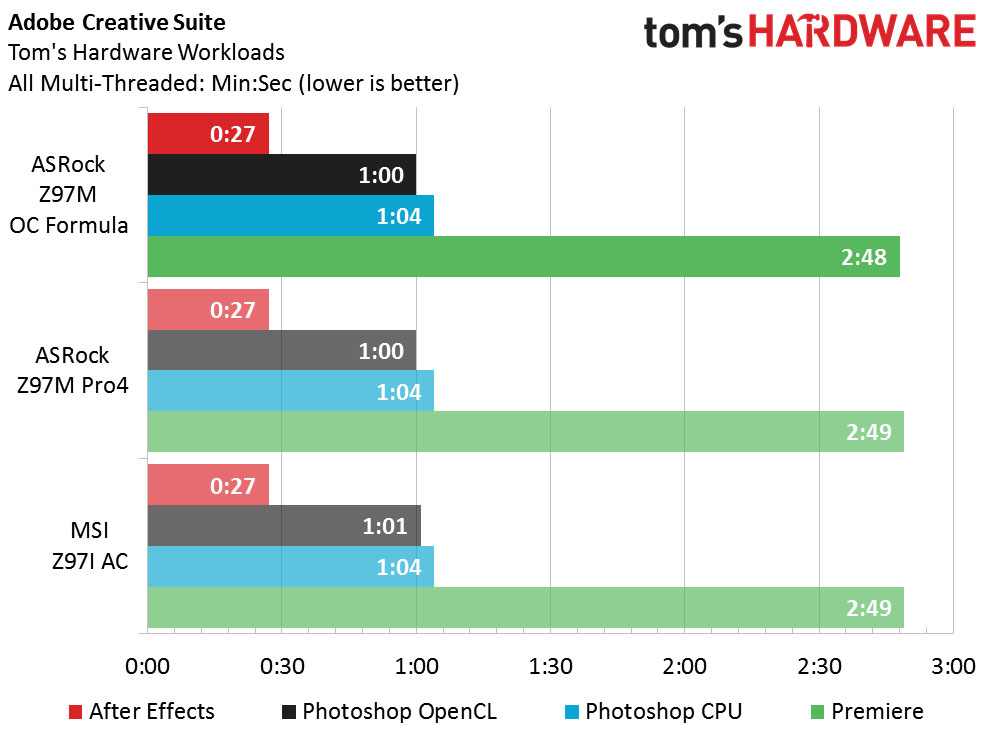
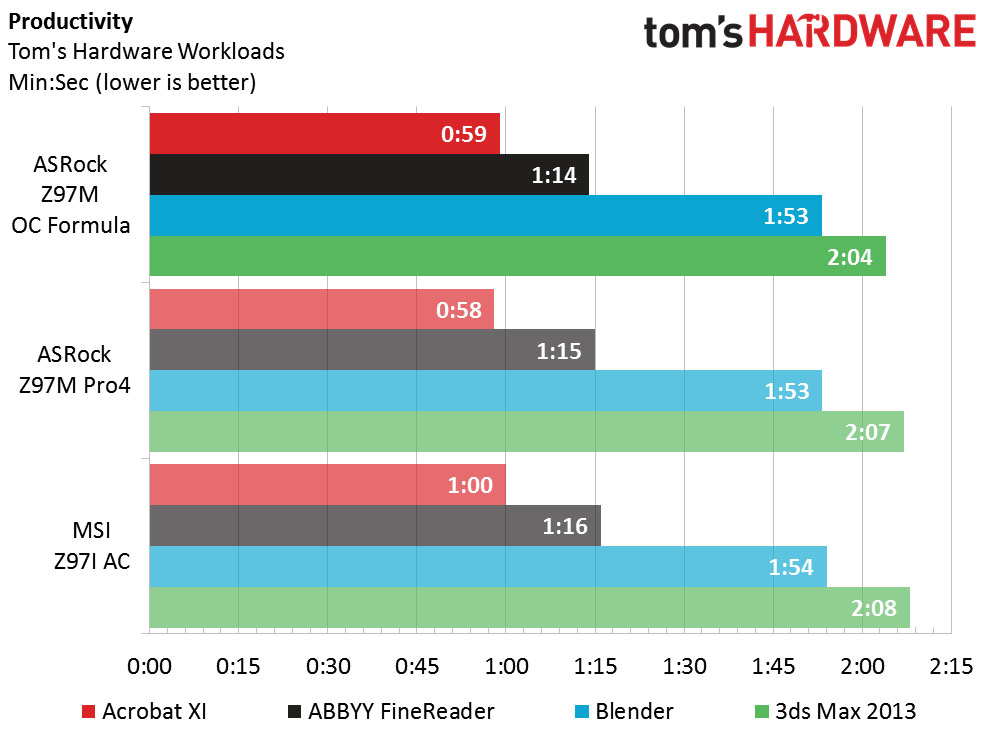
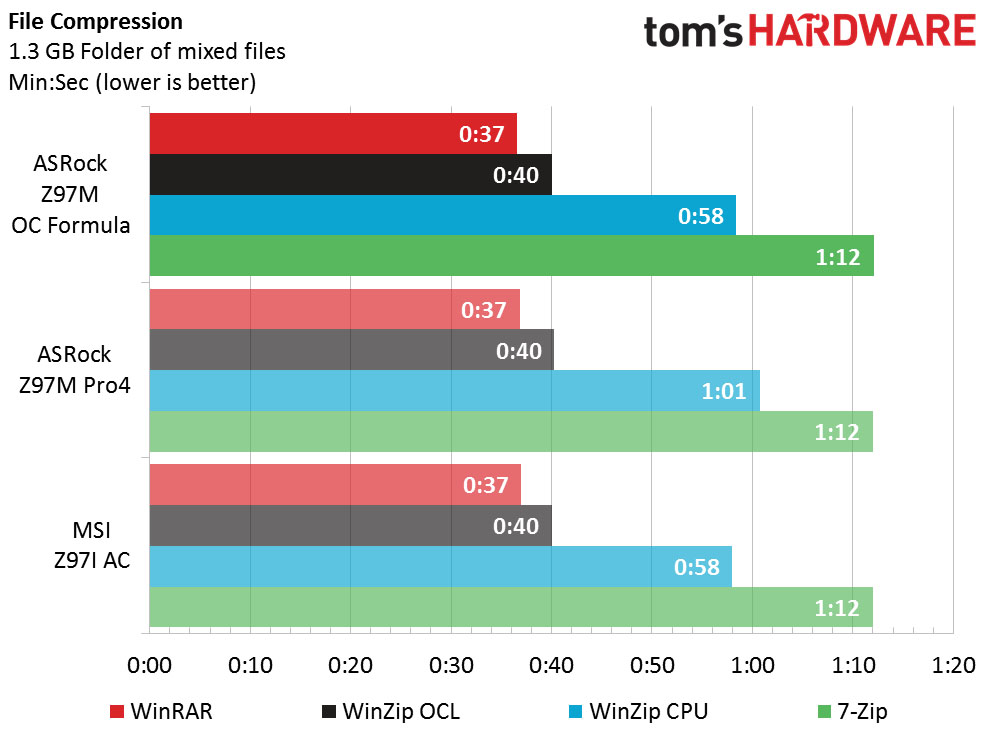
Differences of one second in these scripted bench tests are almost always due to rounding. Those larger gaps do warrant some investigation. A three second lead in 3DS Max might be indicative of something, except the OCF doesn't show a similarly notable lead in any other bench test. Also, the Z97M-ITX that I used in these charts last review scored the same time. It's the same as the Pro4's three second lag in WinZip. If we ran these benches multiple times and averaged the results for each board first, these differences would be unnoticeable.
Power & Temperature
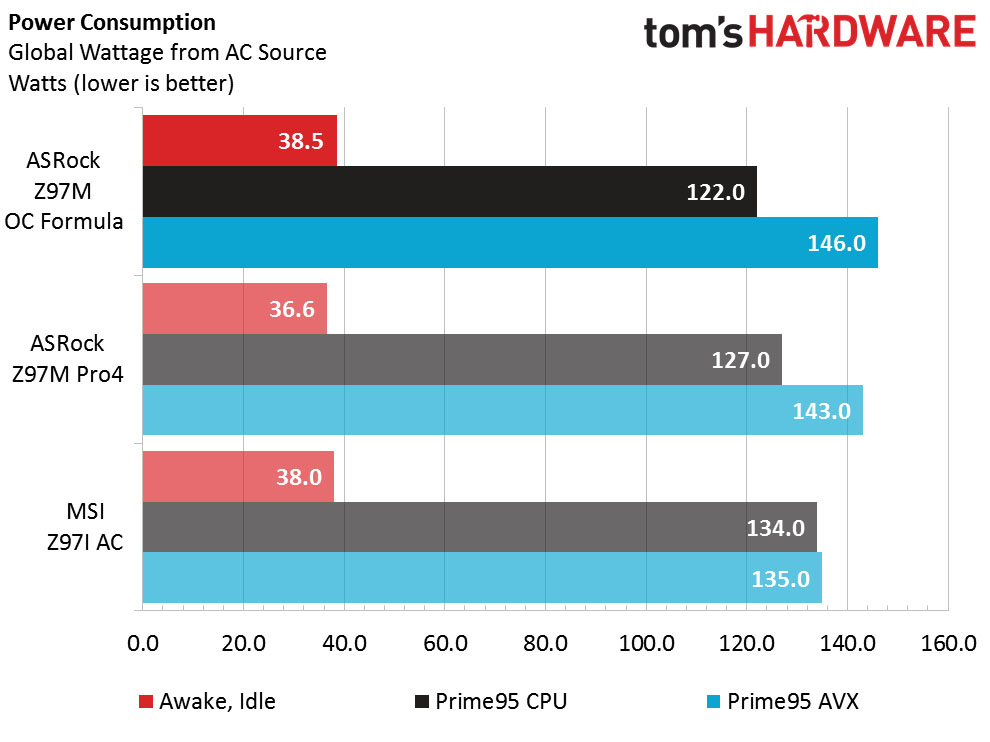
Time to explain the undervolting problems. With more hardware on the board, it's not surprising for the OCF to use more power than its competitors overall. However, that low 122W draw under non-AVX Prime95 tells a big story. The OCF rebooted a few times while I was running this test, though it had no such problem while running the rest of the bench suite. During these runs, the automatic CPU voltage didn't budge above 1.088V. This seemed a touch too low for me, considering it was an eight-thread load with all cores at the maximum 4.2GHz turbo. Manually bumping the voltage just a little solved the reboots.
The strange thing is that this behavior only manifests under the non-AVX load. The motherboard responds to the AVX version of Prime95 with a slightly higher voltage, 1.108V, and I couldn't get the board to crash when testing it this way. These two scenarios together point to conditional low voltage instability.
I contacted ASRock about this problem and they released the v2.30 BIOS. The v1.91 BIOS I used during my tests was specifically noted to improve power consumption. It's not unknown for a motherboard manufacturer to run automatic voltages dangerously low in order to win efficiency awards. If that were the case here, I would expect to see undervoltage problems in more than one situation. I think it's more likely that I found a point in the voltage curve that just doesn't agree with our particular test CPU.
It's also important to ask what impact this problem has on users. It's possible ASRock didn't spend as much time on the auto voltage since this board was never meant to be left at auto settings. That's not great, but it is understandable. Consumers in the market for the OCF want tweaking and overclocking support over almost everything else. Power efficiency doesn't just take a back seat to overclocking, it's in the trunk or possibly left at the curb.
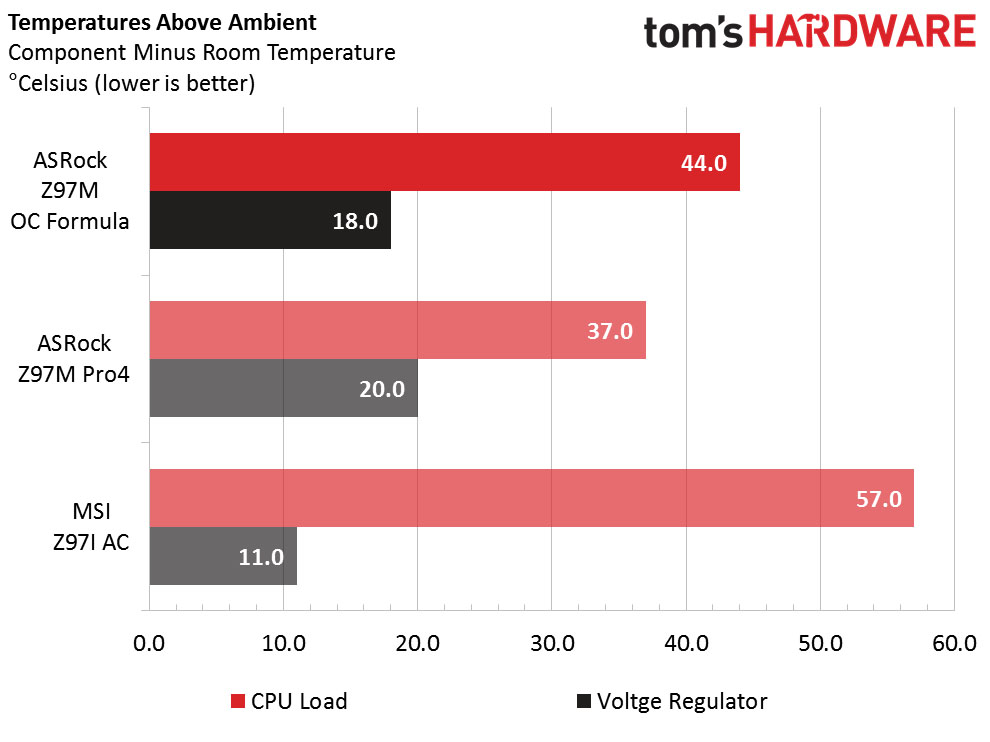
CPU temperatures are a little higher than the Pro4, though your experience of course will depend on your particular CPU cooler. The fatter VRM heatsink's effect is on clear display, however.
Overall Performance & Efficiency
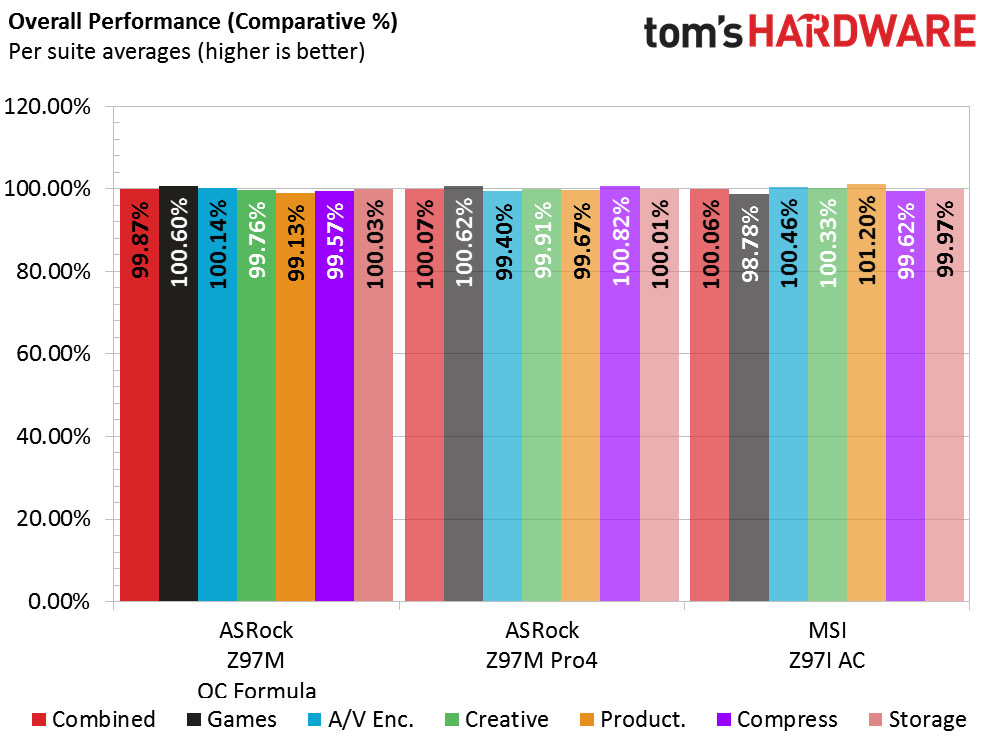
Like last time, fair reader, we see a little more variance than is typical. And I'll say the same thing as last time: we don't have completely "clean" data just yet. Even so, these results still don't scream problematic.
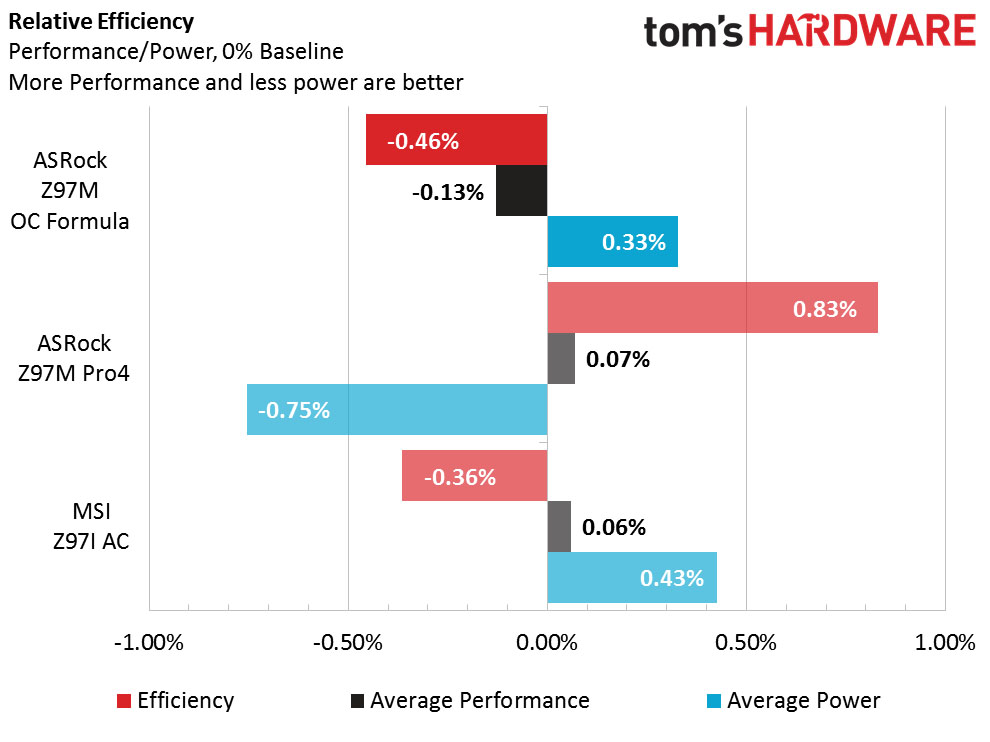
Burning more power is not the way to get an efficiency win in this contest. However, the results are not that far off the Z97I. The Pro4 looks even better in this light than it did last time. Luckily for the OCF, power efficiency isn't its endgame.
Overclocking Performance
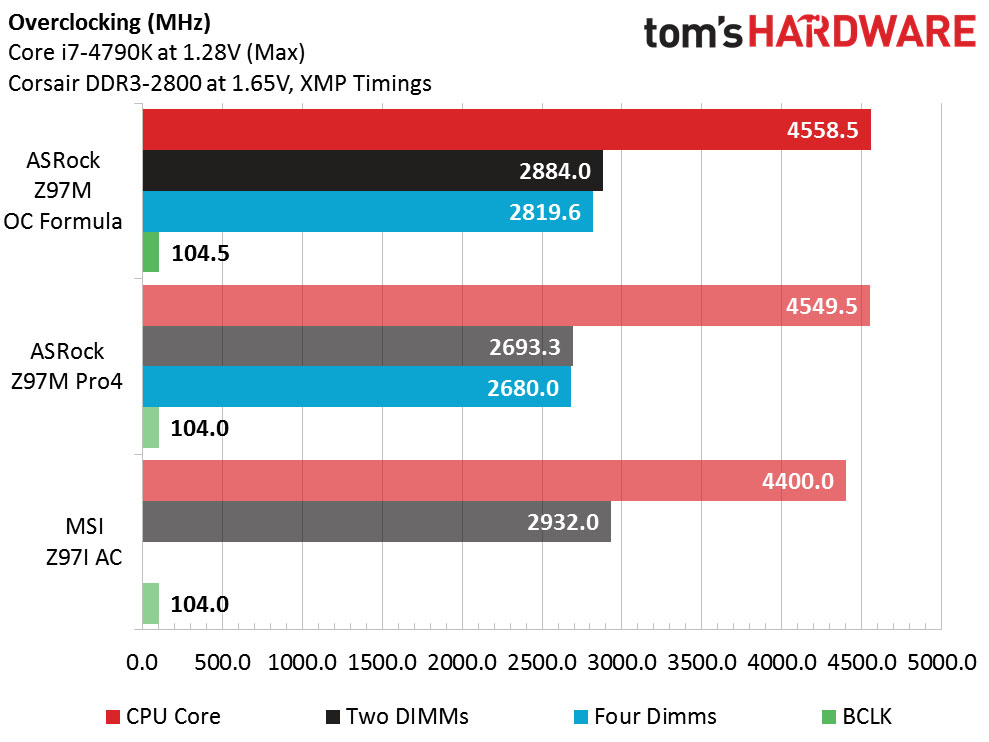
Finally the OCF gets a chance to show off its superior pedigree. It leads in just about every category, even if it's not by much. The MSI Z97I still has the edge in dual RAM module frequency, but upon further research it appears there's a caveat. The Z97I reached DDR3-2932 using looser CAS 13 timings instead of the XMP CAS 12 timings. The OCF is perfectly stable when using those settings. However that doesn't explain the OCF's lower memory bandwidth than the Z97I at DDR3-2800 and higher frequencies. Explaining that requires a waltz down amnesia lane.
When talking RAM performance, latency and transfer rate are the main factors. Latency is how long it takes the RAM to get your data ready to send. How low you can take this is mainly determined by the quality of your RAM modules. Transfer rate is how fast the RAM can transfer the data once it's ready. A lot of factors contribute to this, but since most are determined by Intel or AMD in their CPUs and chipsets, the main one consumers have control over is RAM frequency. Adding latency and transfer rate together tells you how long it takes to get your data to the CPU. Averaging this out over large workloads tells you the memory's total effective bandwidth.
In years past, we were told you couldn't have both low latency and fast transfers. Latency is calculated in clock cycles. Slower clock rates mean longer clock cycles and larger gaps between each CAS setting. Larger gaps make it difficult to hit the optimal latency for your particular RAM modules. Each CAS step at DDR3-1066 is 1.875 nanoseconds. Compare that to DDR3-2800 where each CAS step is only 0.714ns. Running RAM at higher frequencies not only boosts the transfer rate, it gives you finer control over your latency, yielding (potentially) tighter timings. The idea that you must pick either low latency or fast transfers for your memory largely doesn't apply now.
When testing motherboards for RAM overclocking, Thomas and I stick with the XMP timings of our 32 GB Corsair set (12-14-14-36-2N, if you're curious). This saves us time in reviews and ensures we get fair comparisons and consistent data across board reviews. But XMP doesn't specify all the secondary or tertiary timings. Most people leave these on auto settings, so the motherboard calculates and sets its own timings. These settings have a big impact on RAM stability and performance.
Thomas started using the memory bandwidth chart when he found some motherboards demonstrated lower RAM bandwidth at the DDR3-2800 strap than at DDR3-2400. This was largely due to a board using lax secondary and tertiary auto timings when set to 2800, which makes it easier to support faster RAM. Conversely, the auto timings for 2400 were better optimized. If you didn't want to manually tune every aspect of your RAM, it was actually better to use the 2400 multiplier instead of 2800, even if your RAM modules could reach the faster frequency.
So to test for these cases, I've redone the RAM bandwidth graphs a bit. Now they show bandwidth scores for each board at DDR3-2400, DDR3-2666 and DDR3-2800 with a straight 100MHz BCLK and XMP timings, both two- and four-modules. Please note this doesn't mean the board is fully stable under load at these settings. It just has to be stable long enough to run the bench. The idea is to show whether the board handicaps itself at faster RAM frequencies.
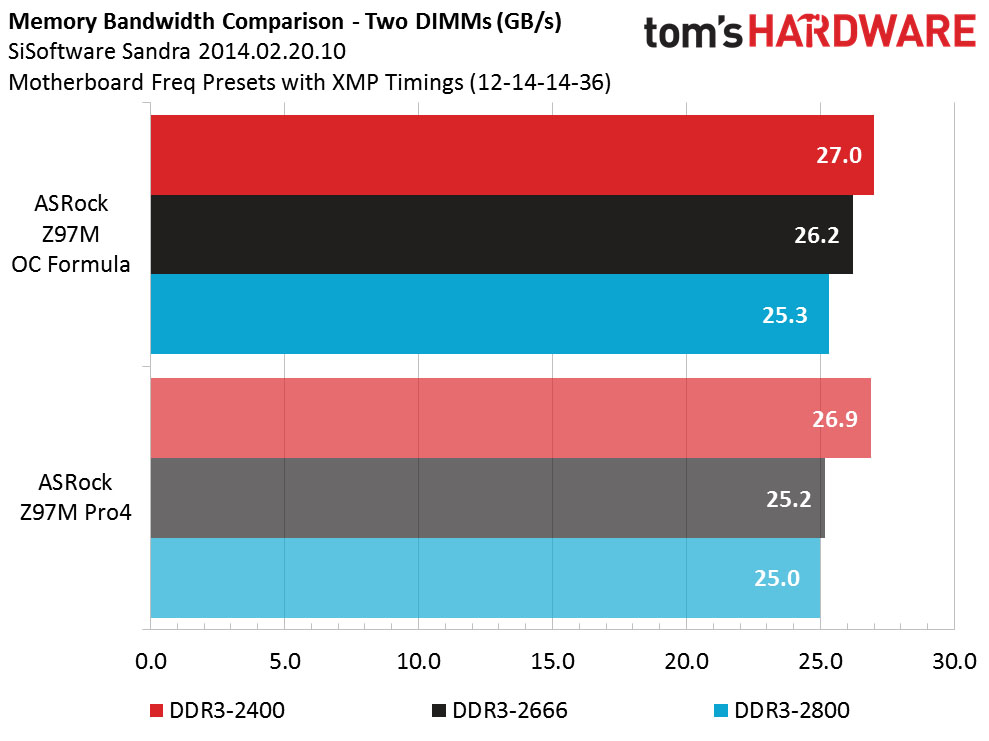
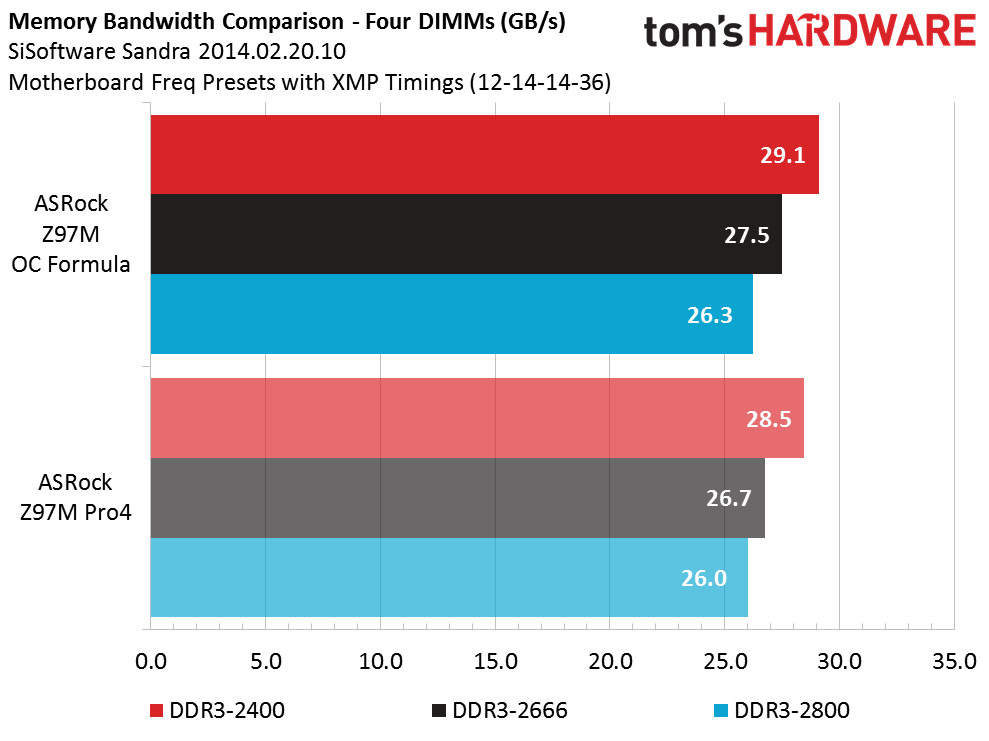
As we see, the OCF is slower across the board at DDR3-2800 than 2400. In fact, these rates are exactly opposite of what we would expect. All tests use the DDR3-2800 timings, meaning the RAM is running much looser at the lower frequencies than it could. Translating down to 2400 speeds, the 12-14-14-36 XMP timings would be roughly equivalent to 10-12-12-30. This also explains the Z97I AC's much higher bandwidth score. Looking back on other reviews, past MSI boards scored very well, indicating nicely optimized auto timings for DDR3-2800.
Value
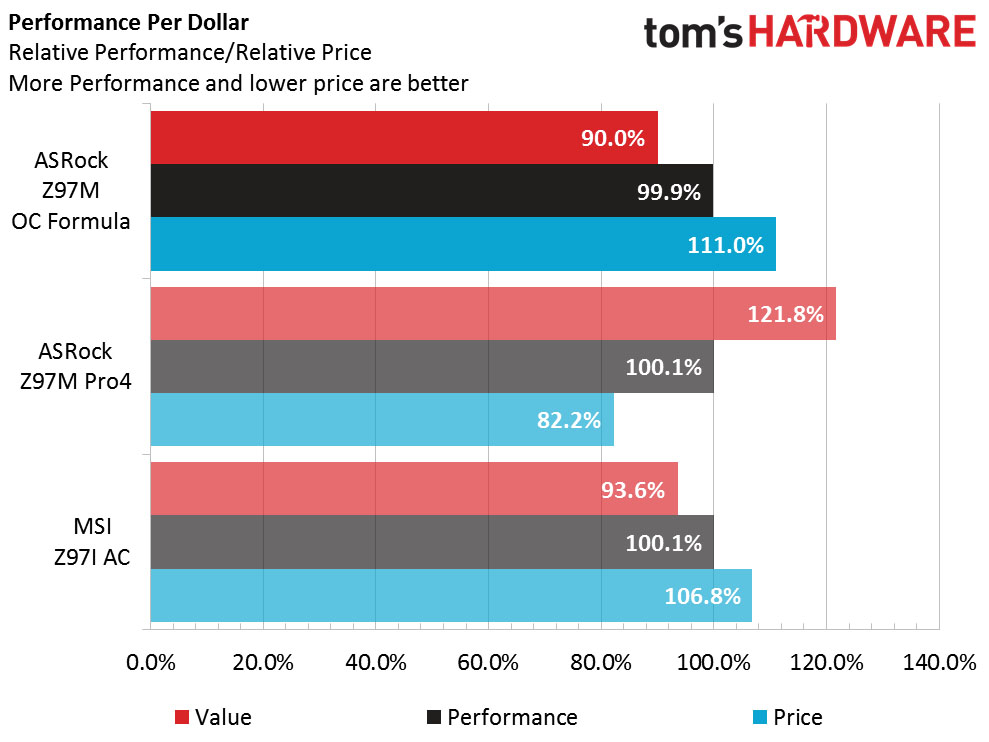
As happens many times with more premium boards, the value graph can be misleading. The OCF retails for $35 more than the Pro4 and doesn't offer a lot of measurable gain over its cheaper stablemate. But of course the OCF has a lot of features that can't be directly measured for performance value. So long as minimal power consumption isn't the biggest concern, the OCF matched the Pro4 at stock tasks and outperformed it in every way when it came to overclocking.
-
Blueberries This is one of my favorite motherboards. Extremely good quality and probably the best value you can get for the Z97 chipset.Reply -
DonkeyOatie I spent many hours of harmless fun over the Summer overclocking everything I could get my hands on on this board. I learned a lot and still have much pre to learn, especially about getting my Trident X past 2800Mhz.Reply
http://www.tomshardware.com/forum/id-2626627/build-log-middle-school-science-fair-project-system.html
I think this is the best price/performance board for SLI/Overclockng. It is often available at under $100 from Newegg, due to a manufacturer's rebate. Putting it in a Thermaltake Core V21 made the built and 'putzing' process -
RedJaron I'd recommend you test RAM bandwidth at each frequency strap to find the best actual performance. As I found with this board ( and others ), the auto-settings for secondary and tertiary timings can do weird things. It's not uncommon for a board to go with looser auto-timings just so they can say they support faster RAM. Even though I could reach DDR3-2900 on this board, it actually performed worse than 2400 because of looser timings. Now if you're the type of person that manually sets every single RAM timing, this may not be an issue. However I don't have that much time when reviewing boards.Reply -
DonkeyOatie Reply16776633 said:I'd recommend you test RAM bandwidth at each frequency strap to find the best actual performance. As I found with this board ( and others ), the auto-settings for secondary and tertiary timings can do weird things. It's not uncommon for a board to go with looser auto-timings just so they can say they support faster RAM. Even though I could reach DDR3-2900 on this board, it actually performed worse than 2400 because of looser timings. Now if you're the type of person that manually sets every single RAM timing, this may not be an issue. However I don't have that much time when reviewing boards.
I started auto, but needed to adjust things by hand. There are so many possibilities and combinations, it gets a bit mind-boggling. The whole thing was a great learning experience for me and something I would strongly recommend to anyone so inclined. -
Onus Nice review. I like the smaller size, but this is probably not the board for me, since I'm not a die-hard tweaker; I just want thing to work, although a little extra "go fast" is welcome.Reply -
DonkeyOatie Whereas for my Middle School student who is doing a Science Fair project on it investigating simple CPU and memory overclocking, it is just the right thing (and cheap enough in case things turn pear-shaped)Reply -
JacFlasche I am getting ready for my next build: waiting for the improved skylakes at the end of October, and hoping there will be more than one board that provides integral Thunderbolt 3 connections. I would really like to see a review on the Gigabyte Z170X-UD5 TH. Which is the only MB that has it at present. I gather that Asus is going to offer an expansion card with it, but not with an intel chip. I guess I would consider a board and a Thunderbolt 3 expansion card if everything else was right, depending on the brand and speed of the chip on the card.Reply
I am kind of surprised at the lack of interest in Thunderbolt 3. I move files of ten or more GB to external storage all the time, but beyond the unparalleled speed, the one connector to rule them all idea is great. My next board, gotta have it, along with USB 3b or whatever is the latest. Couldn't care less about SATA Express.
I am almost tempted to build another notebook and connect it to external video cards -- almost. Now if someone would just dump a bunch of the latest MSI whitebooks on ebay it would be a definite maybe, but only if they had a Thunderbolt 3 connection. At this point I would not even consider a notebook without it, and my guess is that when people realize the potential it provides they will wish they had it. Maybe I am just a victim of hype, but in this case I kind of doubt it. -
utroz To the author: Page 2 middle of the page.Reply
"Two modules were much more flexible and reached DDR2-2884 at a 103MHz BCLK."
Shouldn't this say DDR3-2884 not DDR2-2884?
Just trying to help..
