Beamforming: The Best WiFi You’ve Never Seen
Test Apps And Methods
I used two applications during testing, Zap and Chariot. These examine UDP and TCP packet performance, respectively. You don’t see UDP tested very often. Everybody simply loads up Chariot or iPerf, does some time tests, and that’s about it. For conventional file transfers and similar everyday tasks, this is an appropriate methodology. However, UDP is what you use for streaming video. It’s a faster protocol because the server system doesn’t have to sit around waiting for receipt confirmation from the client. With UDP, you simply blast out a stream of high-speed packets and hope they get to their destination, come what may.
You’ve probably never heard of Zap because Ruckus developed it in-house for testing video streaming performance. To the best of my knowledge, this is the first extensive use of the tool in a mainstream review. As it was, I was sworn to not let the application out of my sight, so apologies in advance for not making it available to readers.
With that said, there’s no dark magic to Zap. It simply takes a reference load of data and sends it between the server and client using UDP. The transfer is divided into percentages of the total work load, with each step being one-tenth of a percent. At each step, throughput rate is recorded and the number shown by the software is the lowest packet speed recorded up to that point in the transfer job. This is why Zap numbers look really fast at 1%, average at 50%, and very slow at 99 percent.
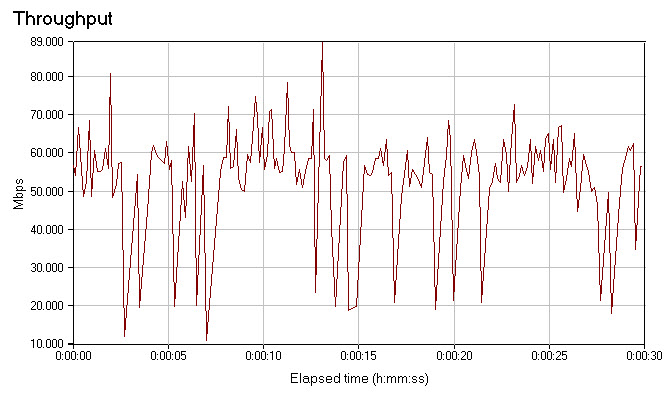
For our purposes, we’re most interested in the average and lowest numbers. When it comes to video, you don’t care what the fastest or average sustained rates are. You care about the slowest speeds, the weakest link in the wireless chain, because this will be the key factor in determining your video-watching experience. If you sustain a 70 Mbps connection 95% of the time but occasionally drop to 15 Mbps for whatever reason, then those drops are going to translate into dropped frames and hiccups if you’re watching an HD stream with a 19.2 Mbps data rate. You can see a real-world example of this in the chart shown here, which (spoiler alert!) is the Chariot throughput data for Cisco’s 1142 access point at short range.
As mentioned previously, many things can impact wireless throughput, including the orientation of the client. There are three antennas in most 802.11n-equipped laptops, and in three dimensions these work (once again) a lot like rabbit ears. So I actually ran each test four times, rotating the laptop a quarter-turn for each test. The results were then averaged together.
Additionally, since each access point has the ability to run at either 2.4 or 5 GHz, I ran all tests on both radio bands. It’s possible for a client that associates on one band to hop to the other if conditions deteriorate, but it’s not common. Client sessions tend to stay loyal to whichever band they first associate with. Hence it’s important to get a good idea of how both bands perform.
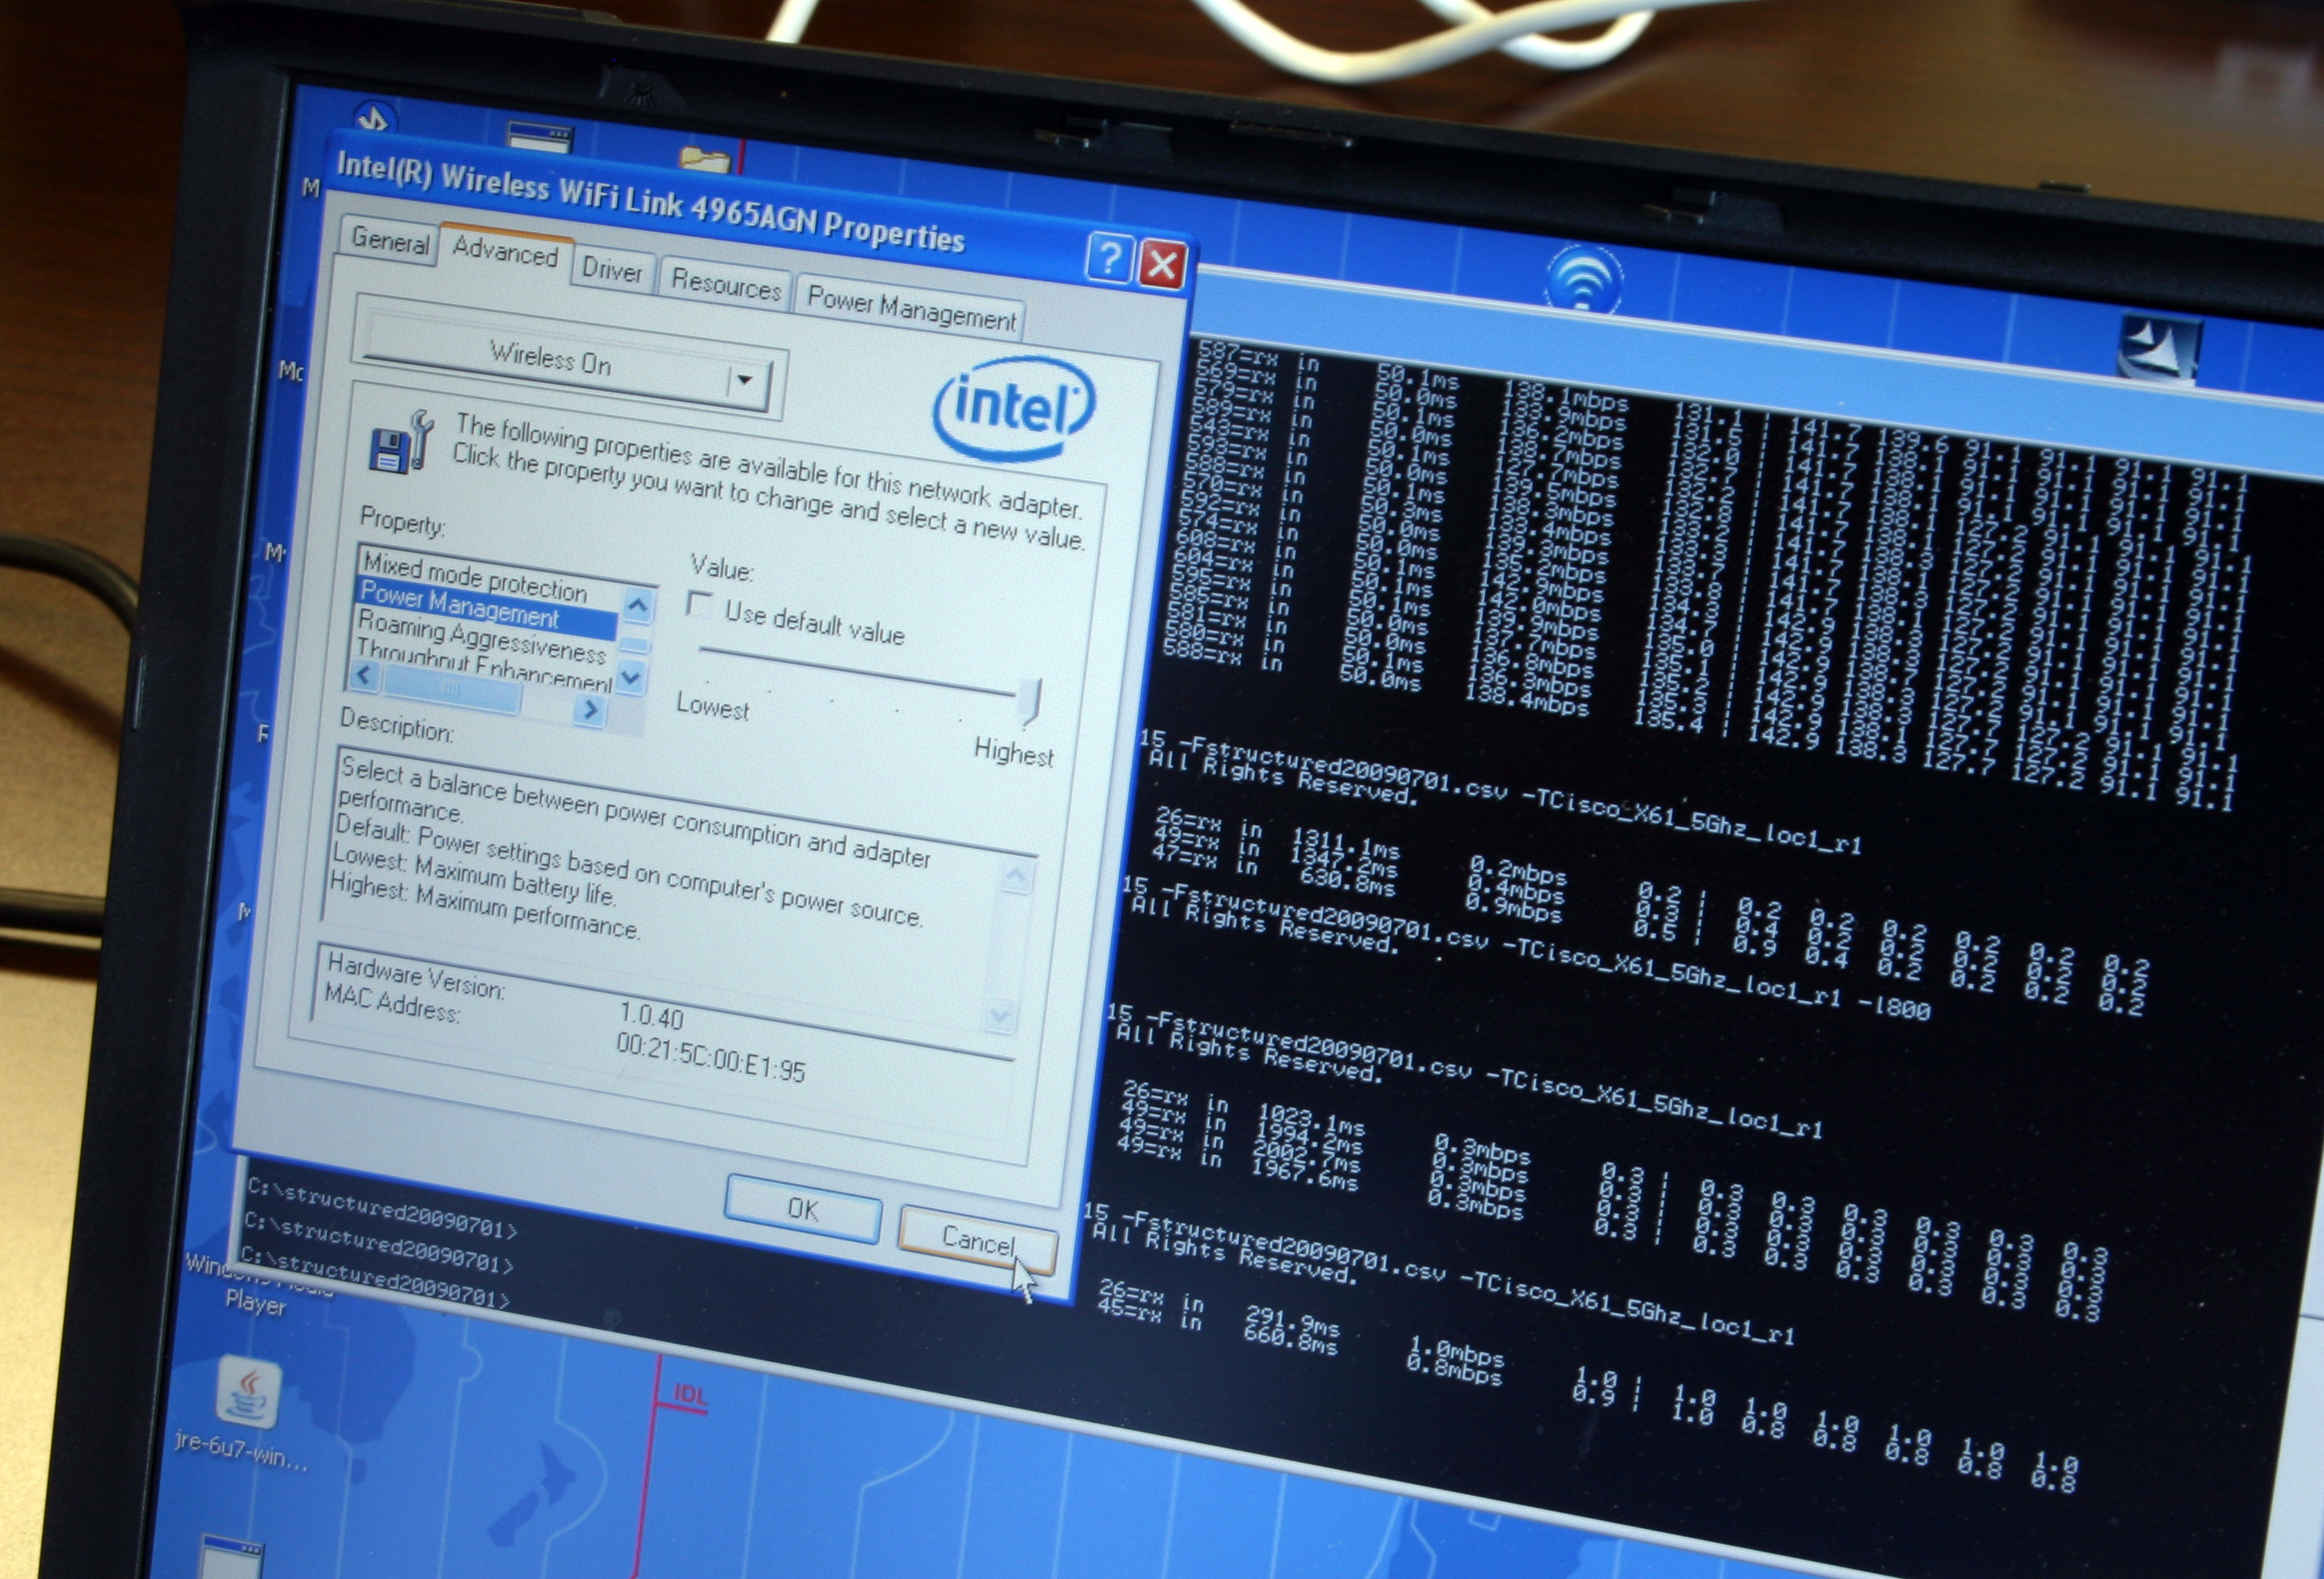
Not least of all, I made sure that power management in the Intel client driver was set to “highest.” Otherwise, when running on battery power, performance can be more prone to fluctuation. If you’re curious, that command line business sitting under the driver window shown here is Zap at rest.
Get Tom's Hardware's best news and in-depth reviews, straight to your inbox.
-
pirateboy just what we need, more retarded failnoobs clogging up the airwaves with useless braindead movieclips...yaayReply -
bucifer This article started up pretty good with lots of technical data and the beamforming technology in theory but after that the goodness stopped.Reply
1.You cannot compare two products by testing them with a in-house developed software. It's like testing ATI vs nVIDIA with nvidia made benchmark.
2.If you do something get it done, don't just go with half measures. I don't care if you didn't have time. You should have planned this from the beginning. The tests are incomplete, and the article is filled with crap of Rukus and Cisco. -
Mr_Man In defense of your wife, you didn't HAVE to use that particular channel to view all the "detail".Reply -
@Mr_Man: With a name like yours, I'd think that you'd sympathize with Chris a bit more :P Unless (Mr_Man == I likes men) :DReply
-
Pei-chen Both Tyra and Heidi have personal issues and would be pretty difficult friend/mate.Reply
The network idea sounds better. I couldn’t get my 10 feet g network to transmit a tenth as much as my wired network without it dropping.
-
zak_mckraken There's one question that I think was not covered by the article. Can a beamformaing AP can sustain the above numbers on two different clients? Let's say we take the UDP test at 5 GHz. The result shows 7.3 Mb/s. If we had two clients at opposite sides of the AP doing the same test, would we have 7.3 Mb/s for each test or would the bandwidth be sliced in 2?Reply
The numbers so far are astonishing, but are they realistic in a multi-client environnement? That's something I'd like to know!

