DDR3 Memory: What Makes Performance Better?
What makes one memory platform better than the other? In this article we go through benchmark testing and analysis to give you an idea of what you can expect from different DRAM sets running on Intel and AMD so you can get the best DDR3 performance.
AMD Test Results
Why you can trust Tom's Hardware
On the AMD side there were far fewer problems than I expected, and all of those problems were very likely to happen with various AMD CPUs/motherboards and DRAM.
WinRAR File Compression
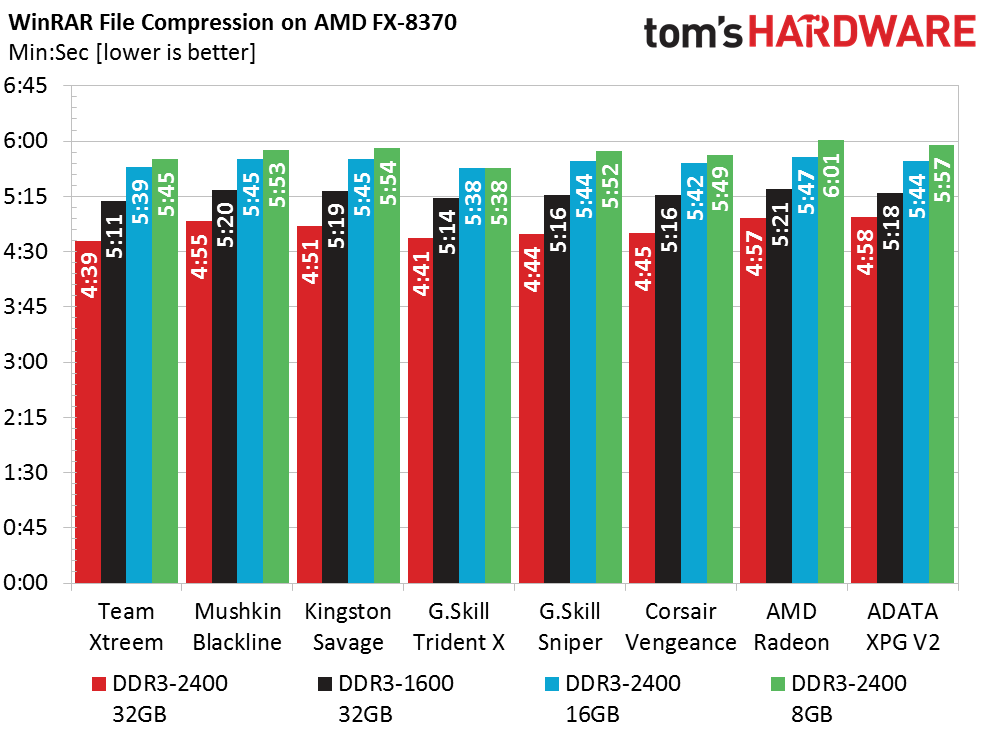
In the testing, using WinRAR, I compressed a video file that was 6.97GB in size. The time differential was minor across the sets. As would be expected, two of the CL10 sets came out on top, and were three of the top four sets. I also did the same with the DRAM at 1600/9.
While charts are nice, I'm more of a numbers guy. So to summarize a bit in the chart above, the time took compressing the file ranged from a top score of 4:39 by the Team Xtreem sticks to the slowest of 4:58. With the DRAM running at 1600, the range was from a fast time of 5:11 to a slow time of 5:21. Moving to 16GB of DRAM at 2400, the best time was more than a minute slower, at 5:38, and the worst was 5:47. Then, at the 8GB level, still at 2400, the fastest was 5:47 and the slowest was 6:01.
As you can see, there is little difference between the sets, though the time it takes rises with the lower frequencies. This is one reason when people multitask and use memory-intensive applications like those in video, imaging, CAD, GIS type work, VMs, etc. can see performance increases with higher frequencies. You can also see where it takes longer with reduced amounts of DRAM. As mentioned, these differences don't look drastic, but as an example, the difference between 2400 and 1600 DRAM here runs into about a 30-second difference in roughly 5 minutes, which is about 6 minutes per hour in time savings or about 45 minutes in a workday. Doing DRAM-intensive work all day, you would come close to doubling that savings by going from 8GB to 32GB.
Geekbench 3.2.2 Pro
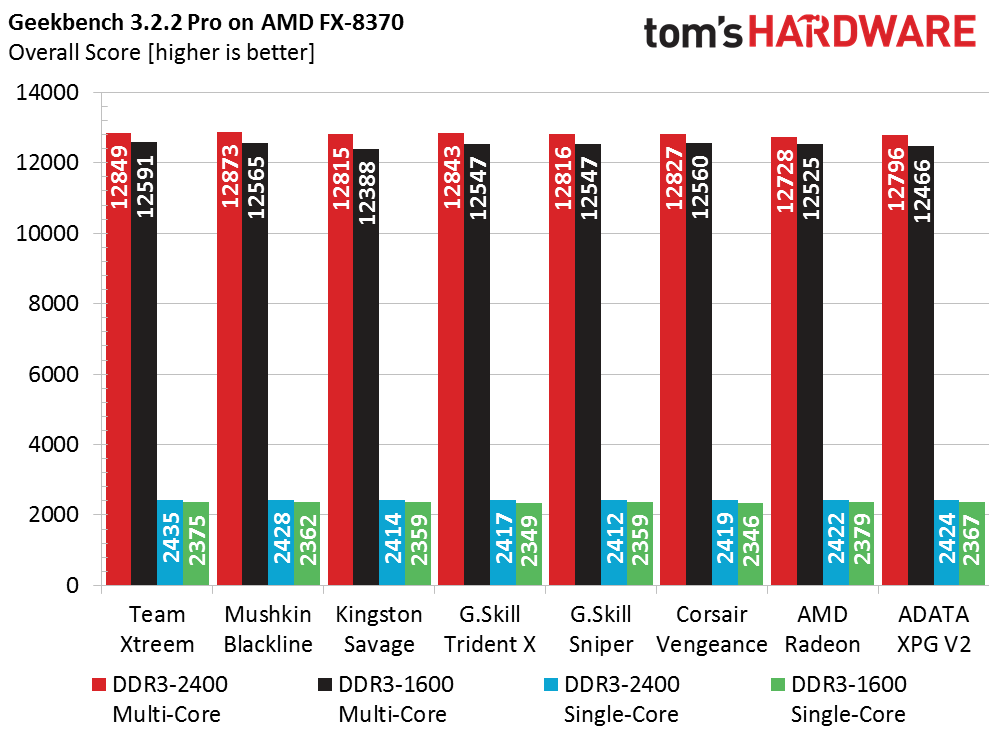
Geekbench, using the overall scoring for both single- and multi-core scoring:
Again, I got mixed results. I was really hoping for something definitive, but the numbers were all over. The following results are basically overall recaps I used to evaluate the individual sets of sticks, but I thought some people might find the results interesting. And again, I promised to keep the chart count down.
Latency And Bandwidth
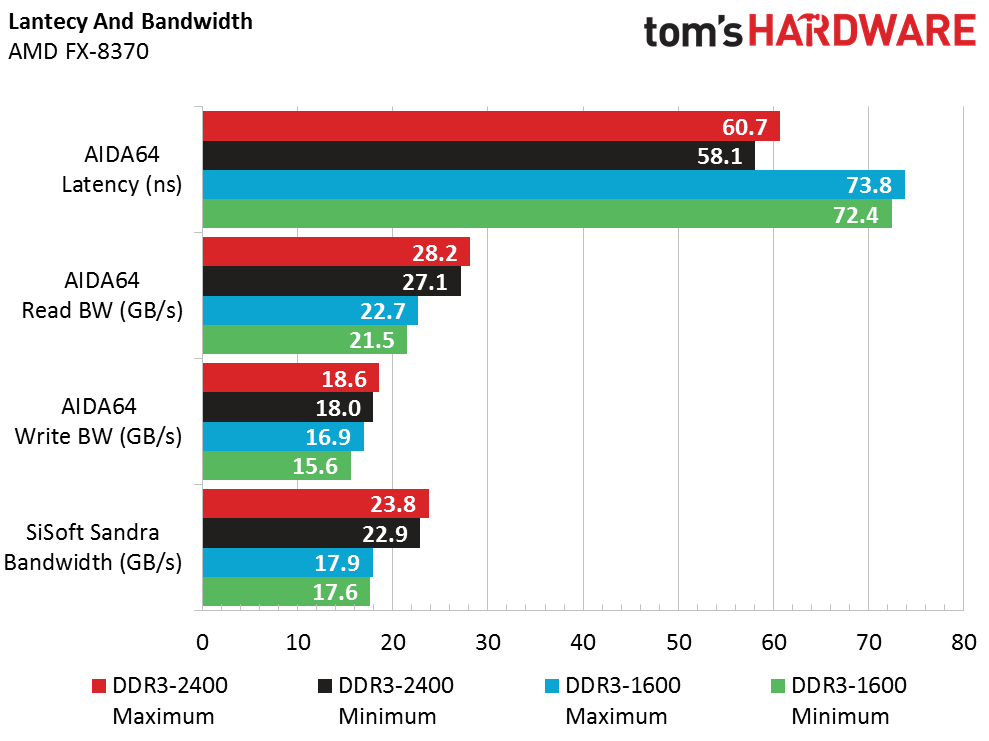
I used AIDA64 Engineer Edition to test DRAM latency as well as read/write scores. Again, the results varied, and I promised to keep charts to a minimum. So, to recap the scores:
Aggregated Memory
Si-Sandra was used to get an Aggregated Memory Score in MB/s
| DDR3-2400 | DDR3-1600 |
|---|---|
| 11.9 to 23.8 MB/s | 17.62 to 17.89 MB/s |
PassMark Performance
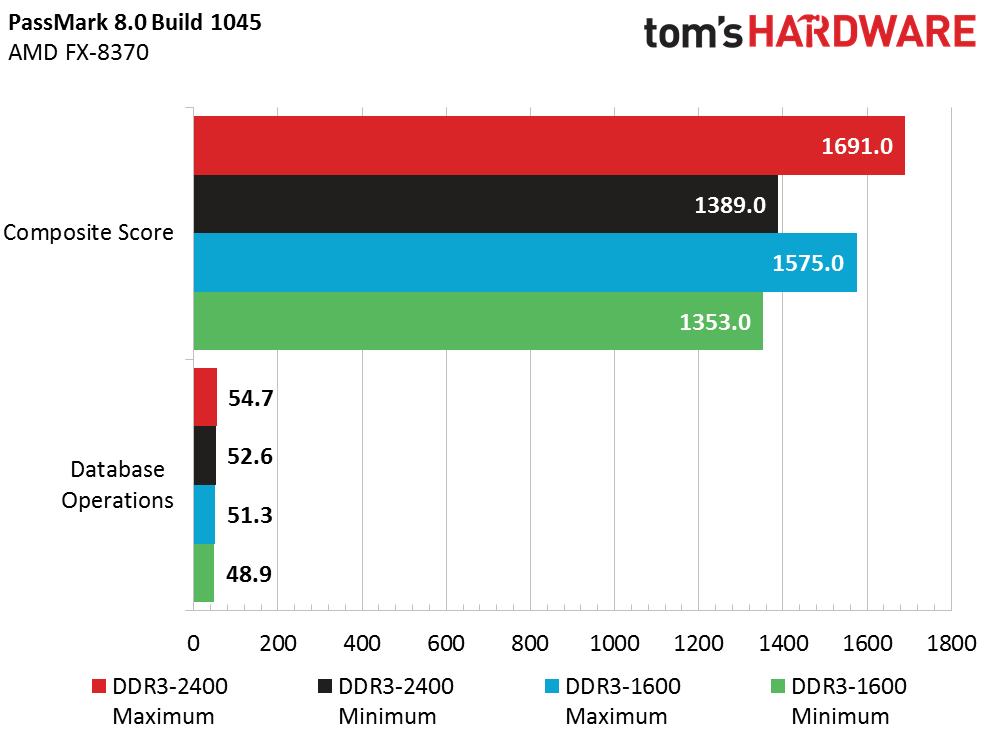
The PassMark Performance Test was used to provide scores for a Composite Memory score from all the tests, as well as what they call a Database Operations score:
Next, we'll look at the scores from the Intel side of the testing and compare. Then, we will head into what I found to be the most interesting.
Get Tom's Hardware's best news and in-depth reviews, straight to your inbox.
-
Damn_Rookie It's great to see you getting the chance to do some articles on here, Tradesman1 Jim :)Reply -
PaulBags Interesting. I'll be coming back here several times over the next several months, as I save up for & consider options for a new computer. Good to know 2x 2 stick kits arn't nessicarily equal to a 4 stick kit, and annoying since I don't see many 4 stick kits in local online stores.Reply
Also good to know frequency has such a measurable impact on compression, I probably don't need fancy high freq ram but now I'm going to be more annoyed my budget won't allow it.
Thanks for the ponderous read! :) -
Cryio This was such an eye opening read. Until now I though different ram frequencies really didn't amount to much. By those times in multitasking ? Wow.Reply -
Crashman Reply
Nope. Latency stays roughly the same while clock cycles speed up. DDR3-1333 CAS 6 and DDR3-2666 CAS 12 have the same latency in nanoseconds, the number of cycles doubles while each cycle occurs in half the time.15517997 said:Since the dawn of computer memory: Faster data rates=More access latency.
-
synphul Pretty good review, made for a fun read. I'm still amazed at the ram incompatibility when mixing different sets. I know it exists, it's not the first time people have experienced this. I've mixed various ram just on a roll of the dice and I guess I've been lucky. The brand mixing was random. When upgrading one system from ddr2 to ddr3 I threw 2x2gb of patriot in with 2x2gb of geil evo one without issue. When upgrading one of these systems and adding ram, I added 2x4gb of team zeus at 1600mhz with 2x4gb of geil evo corsa at 1333mhz and just let the motherboard configure it and match to the lower speeds/settings. No issues with either.Reply -
xFolterknechtx 1.65V sticks on Z87/97 boards? I think the upper limit Intel mentioned in their white paper for Ivy and Haswell was something around 1.55 - 1.575V for DRAM voltage.Reply
Do what you want with your hardware guys, but I ll stay clear of these voltages. -
Pierre Olivier Vidal I have 2 questions for future articles.Reply
1 - Why do memory control sugest no higher voltage then 1.65V yet my DRAM says it can handle up to 2.4V and why would they make a DRAM capable of handling 2.4V if no memory control can push safely over 1.65V? ( I'm runing on Kingston Beast 32GB 2400MHz )
2 - Why is there some DRAMs that are not compatible with some motherboards, what makes it compatible or not? -
Onus I would hate to risk shortening the life of an expensive Intel CPU by running more than 1.6V through its IMC. You raised it to 1.7??Reply


