Why you can trust Tom's Hardware
Comparison Products
We’re comparing the FuzeDrive P200 to some of the best SSDs available. For PCIe 4.0 competitors, we include the top-notch WD Black SN850 and the more affordable Silicon Power US70. We also threw in a Samsung 970 EVO Plus, Crucial P5, and Intel SSD 670p. Additionally, we have a few SSDs with the same hardware as the P200, but with full dynamic SLC caching instead — the Sabrent Rocket Q and Silicon Power’s UD70, two much more affordable contenders.
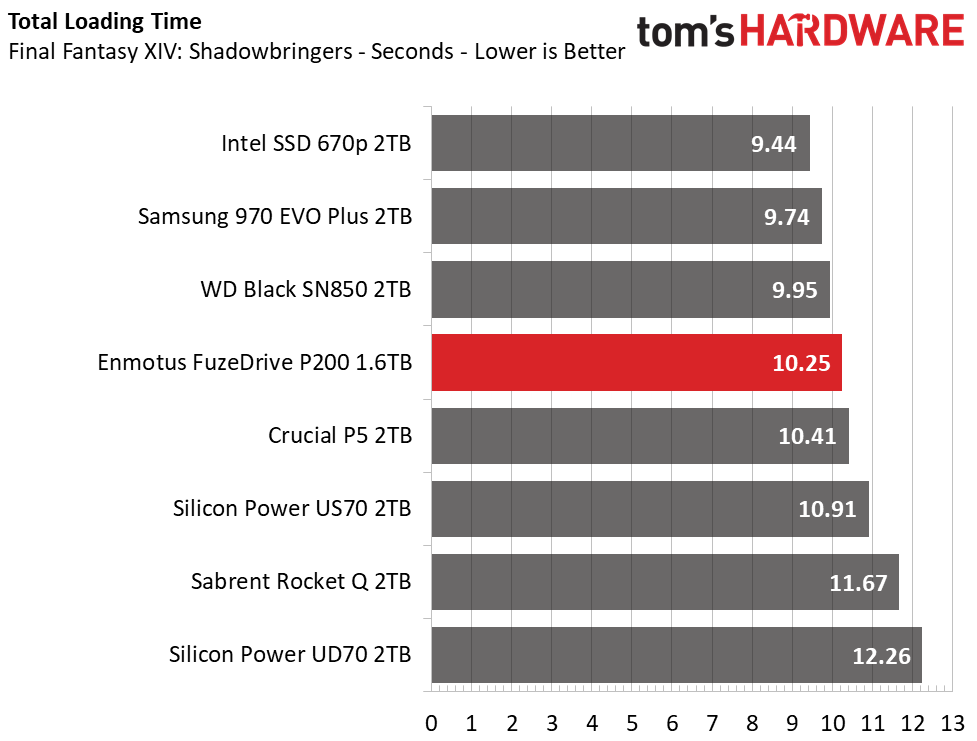
Game Scene Loading - Final Fantasy XIV
Final Fantasy XIV Shadowbringers is a free real-world game benchmark that easily and accurately compares game load times without the inaccuracy of using a stopwatch.
The FuzeDrive P200 delivers responsive game loads and rivals some of the faster SSDs on the market. It even outpaced the Rocket Q and UD70 this round, showing that the static SLC layer does its job well in this type of application.
Transfer Rates – DiskBench
We use the DiskBench storage benchmarking tool to test file transfer performance with a custom dataset. We copy a 50GB dataset, including 31,227 files of various types, like pictures, PDFs, and videos, to a new folder and then follow-up with a reading test of a newly-written 6.5GB zip file.
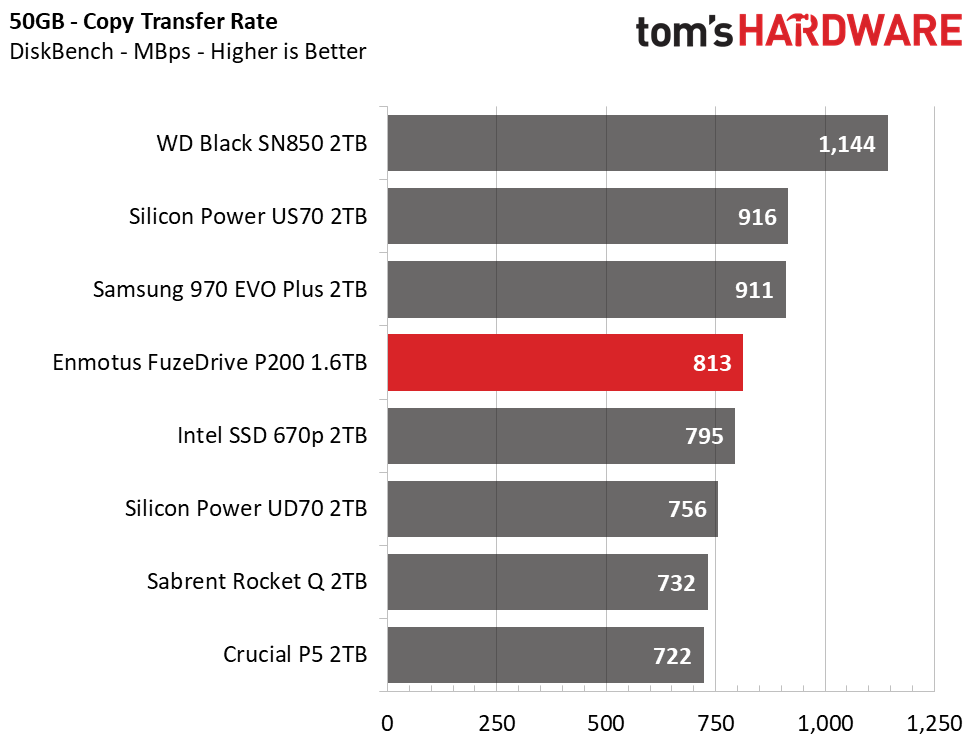
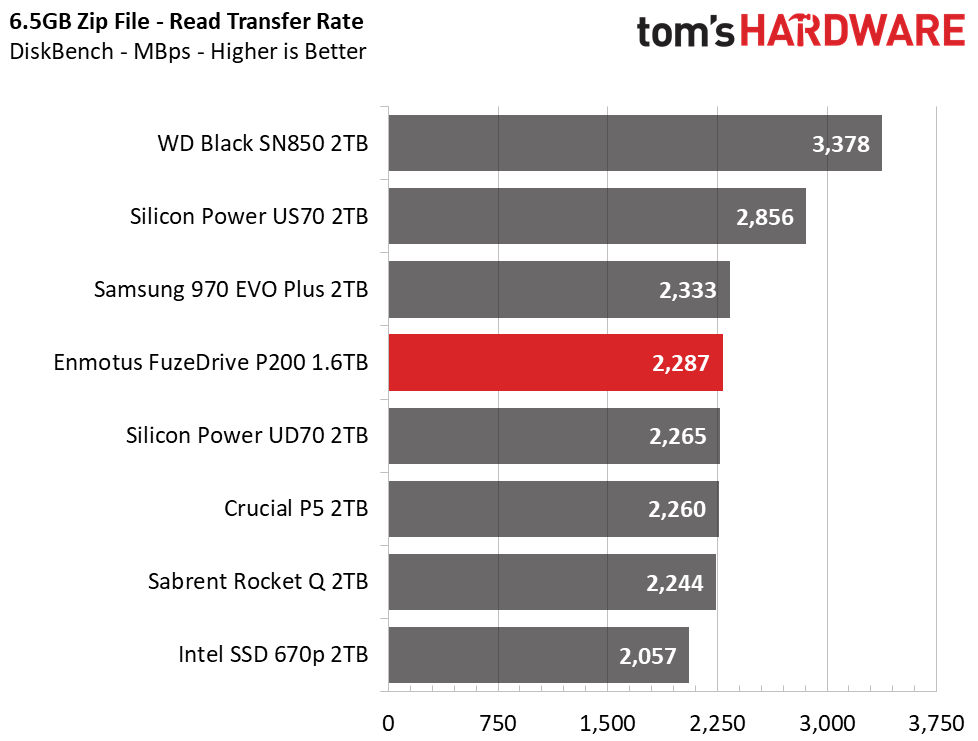
The FuzeDrive P200 is speedy during file transfer operations, outperforming the cheaper SSDs in the group, but it couldn’t quite keep up with Samsung’s 970 EVO Plus or the PCIe Gen4 competitors.
Trace Testing – PCMark 10 Storage Test
PCMark 10 is a trace-based benchmark that uses a wide-ranging set of real-world traces from popular applications and everyday tasks to measure the performance of storage devices. The quick benchmark is more relatable to those who use their PCs for leisure or basic office work, while the full benchmark relates more to power users.
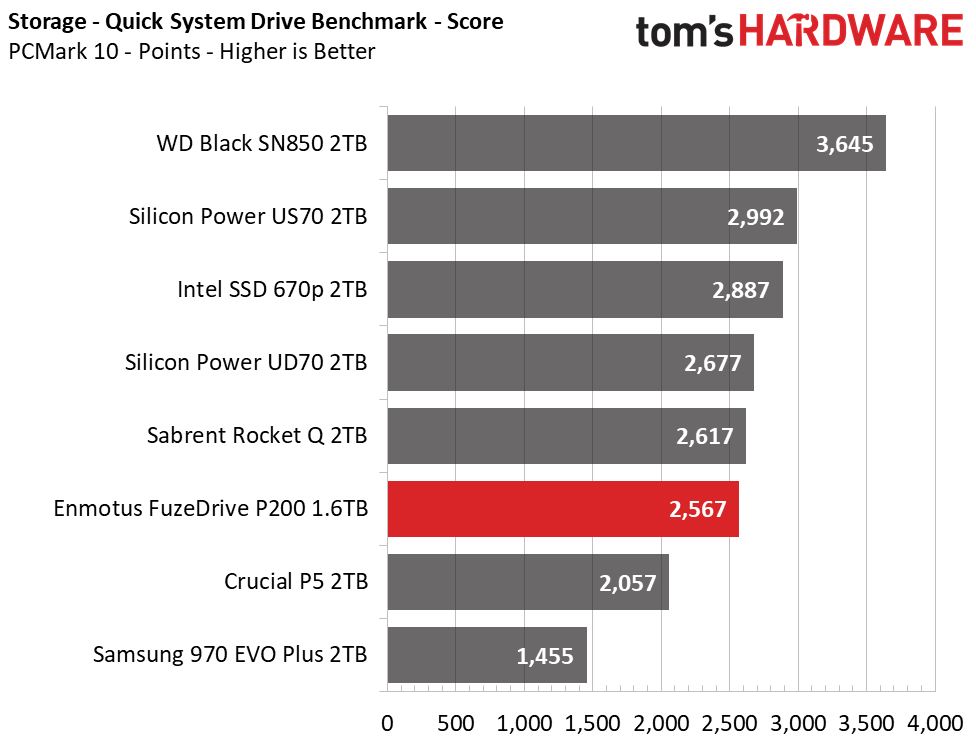
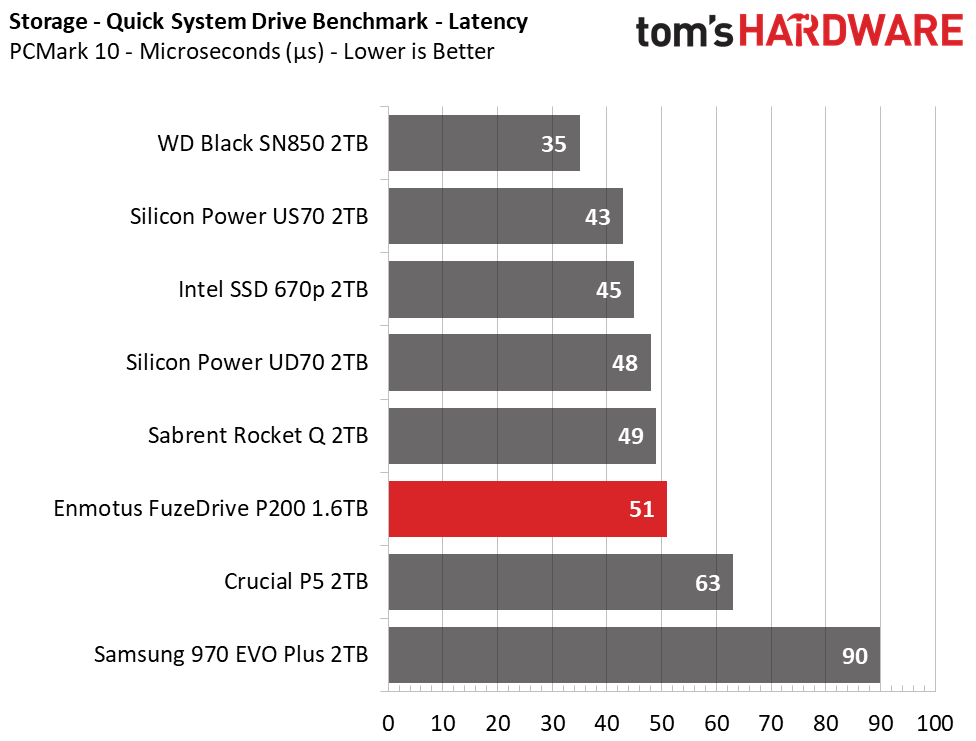
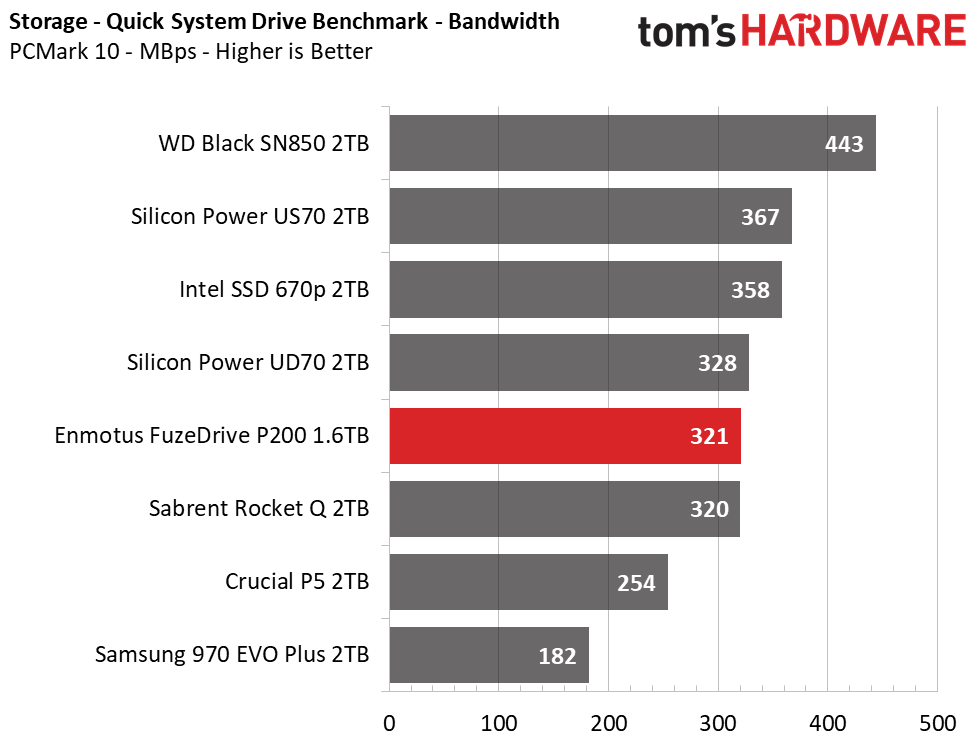
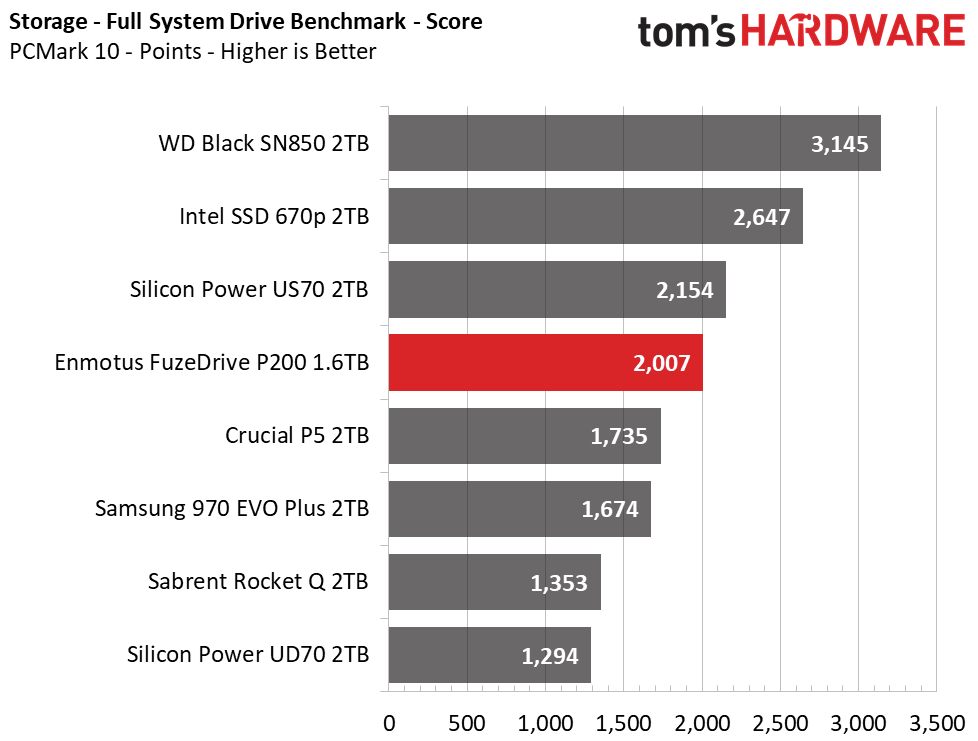
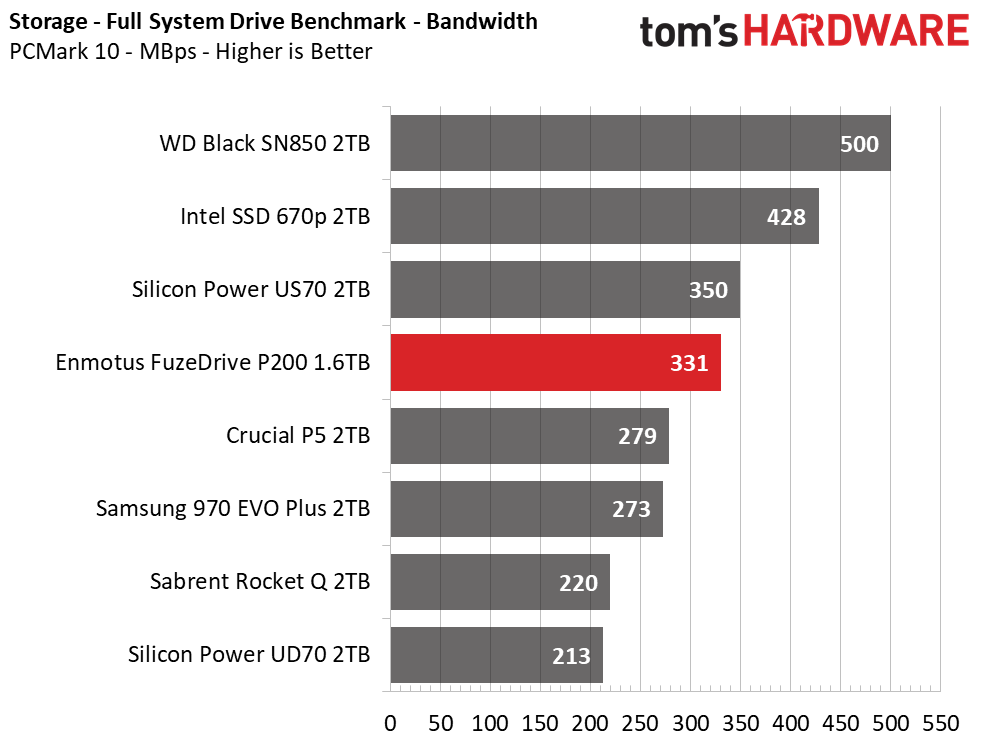
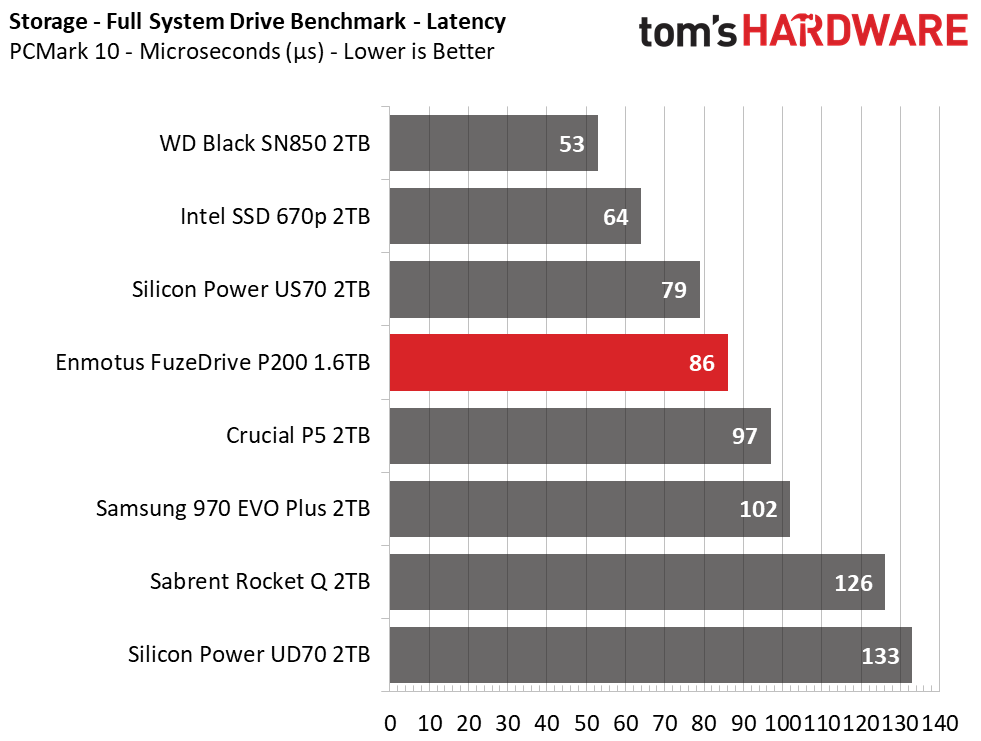
PCMark 10’s Quick System Drive Benchmark shows that the P200 delivers roughly the same user experience as the other E12S and QLC-based SSDs in the group, but the drive proved to be exceptionally impressive when we hit it with the heavier Full System Drive Benchmark. Not only did it outpace the Rocket Q and UD70, but it also outperformed the P5 and 970 EVO Plus. Intel’s SSD 670p and the PCIe Gen4 SSDs are still more responsive, though, due to aggressive tuning for this type of workload.
Get Tom's Hardware's best news and in-depth reviews, straight to your inbox.
Synthetic Testing - ATTO / iometer
iometer is an advanced and highly configurable storage benchmarking tool, while ATTO is a simple and free application that SSD vendors commonly use to assign sequential performance specifications to their products. Both of these tools give us insight into how the device handles different file sizes.
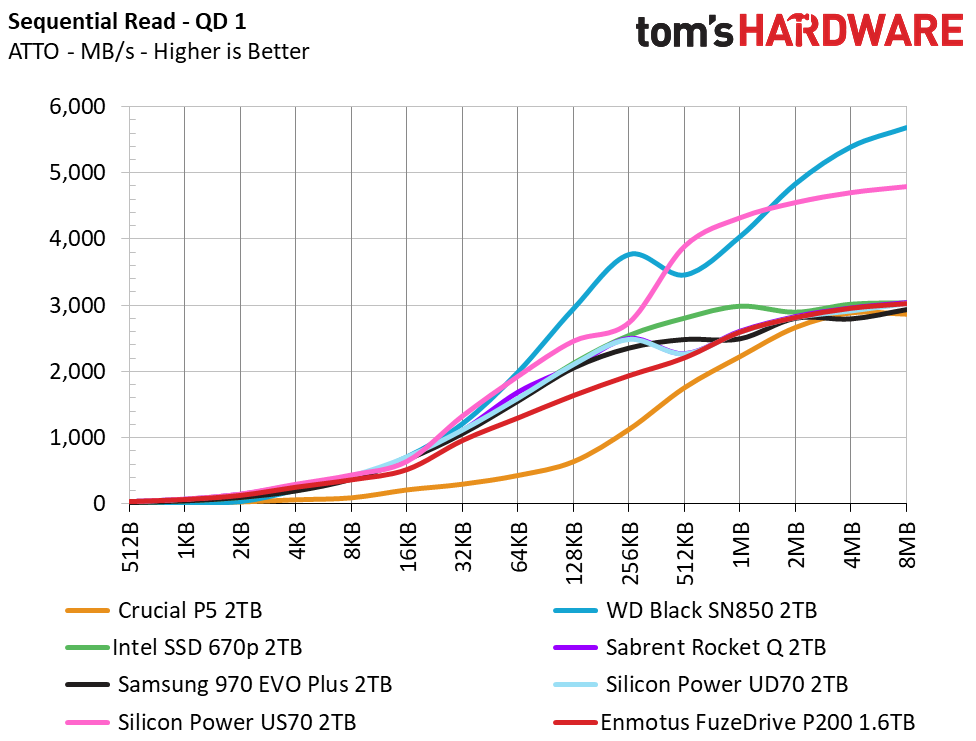
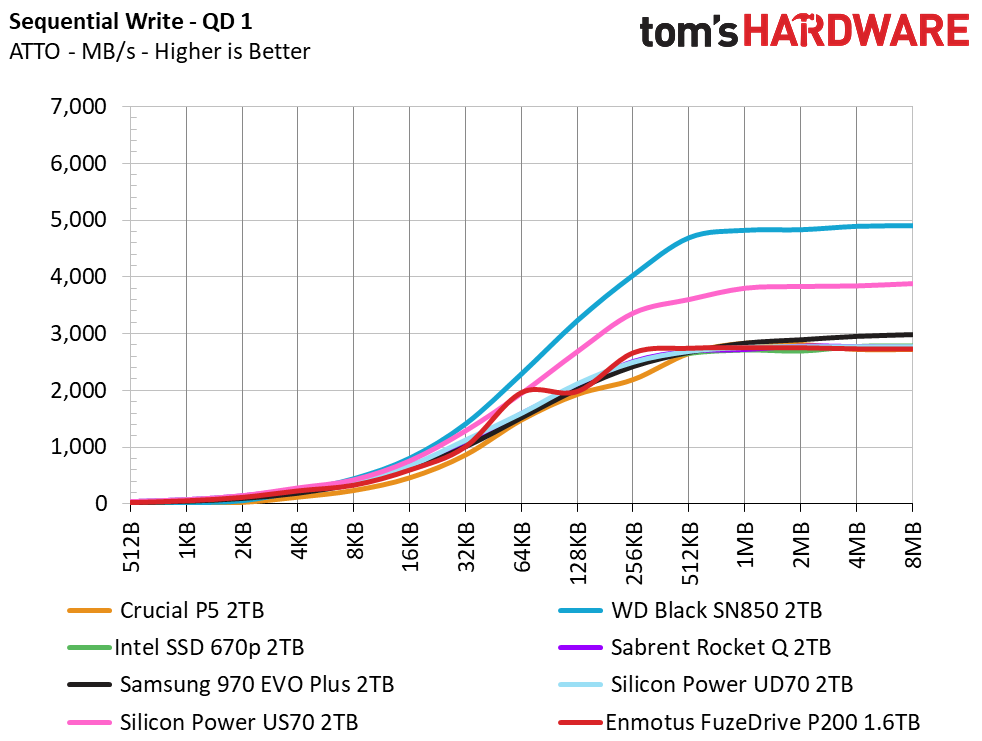
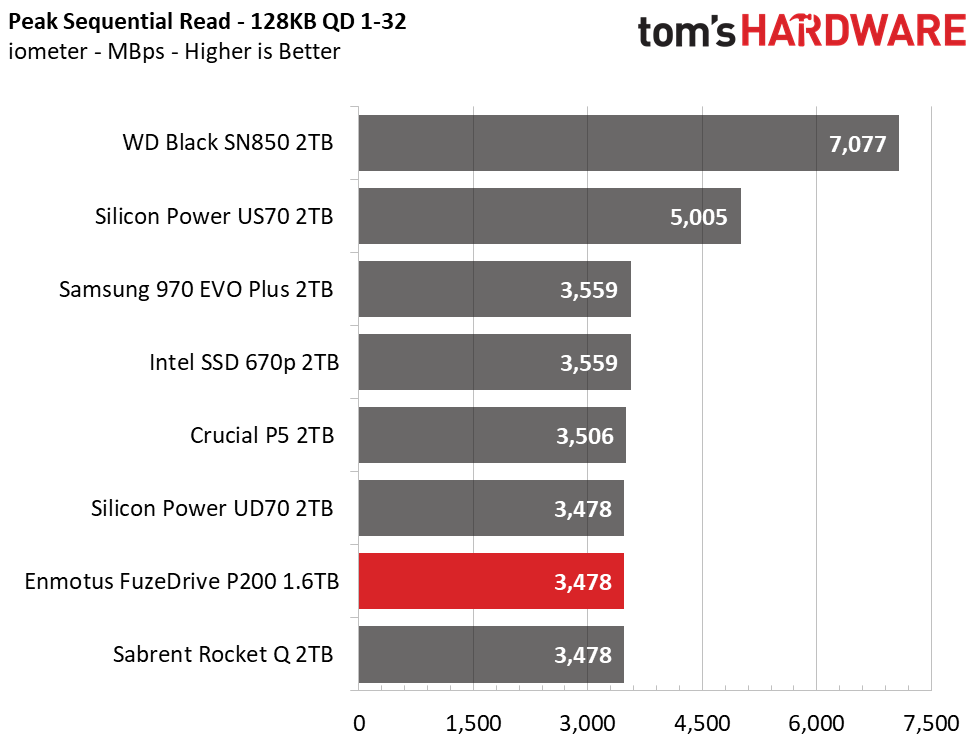
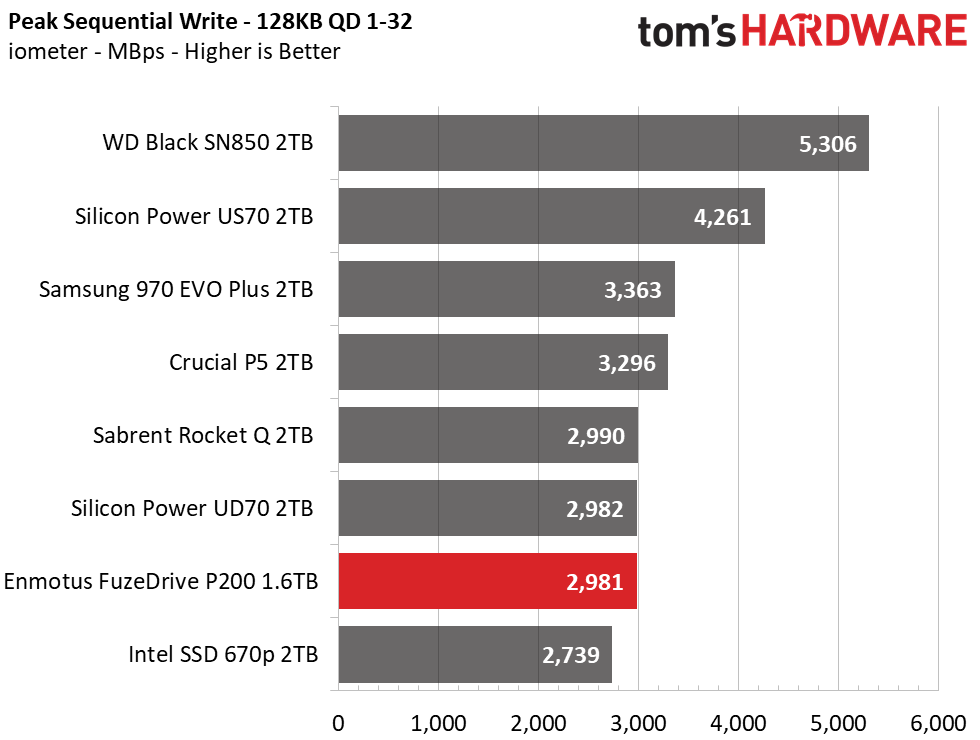
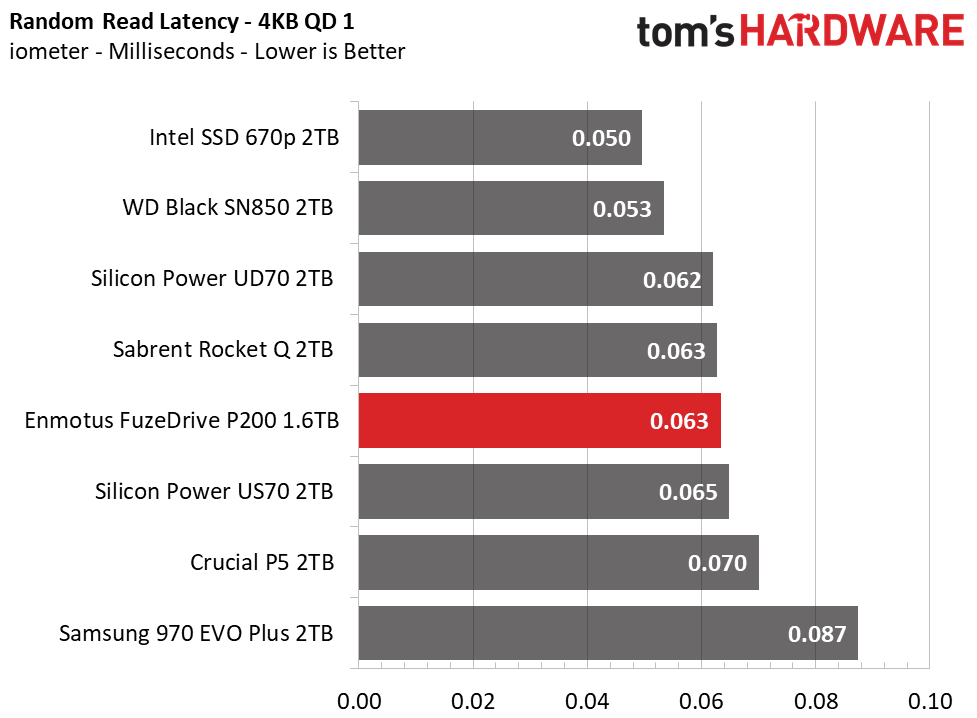
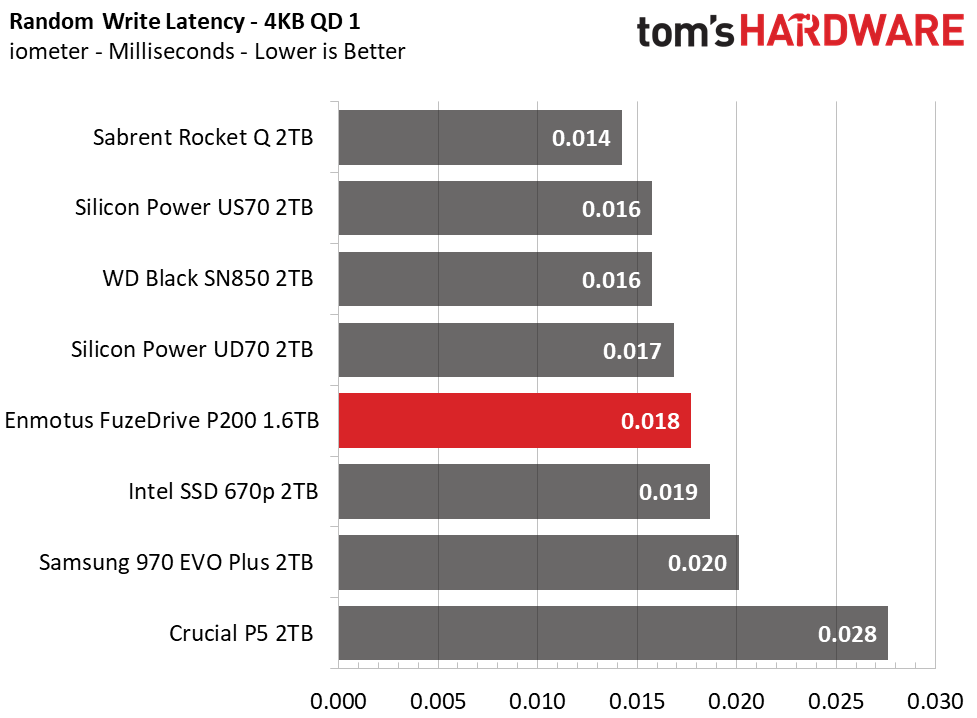
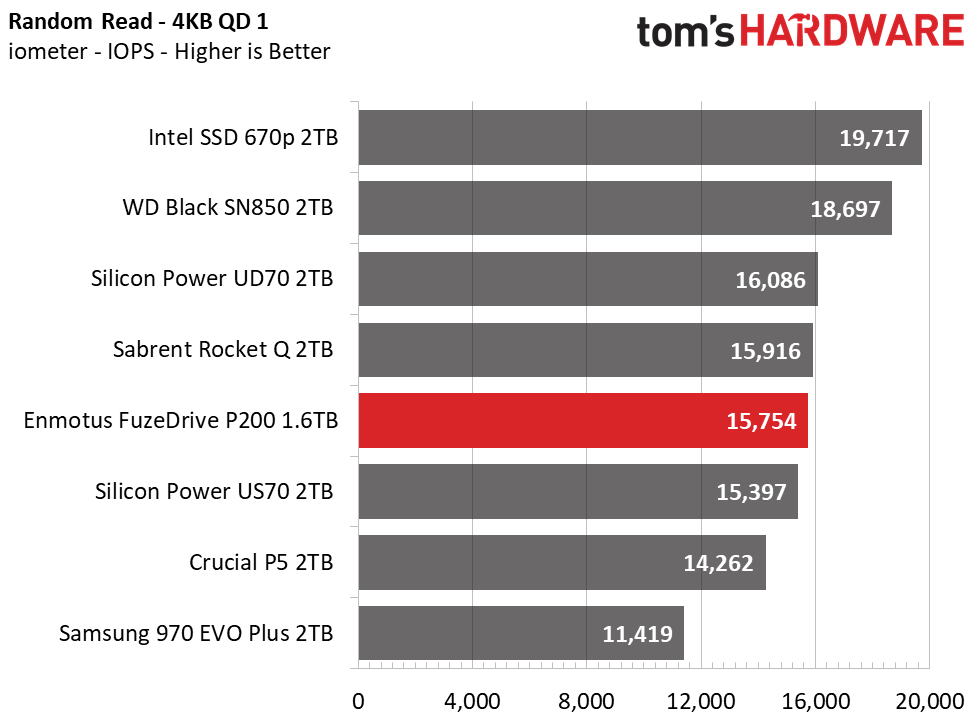
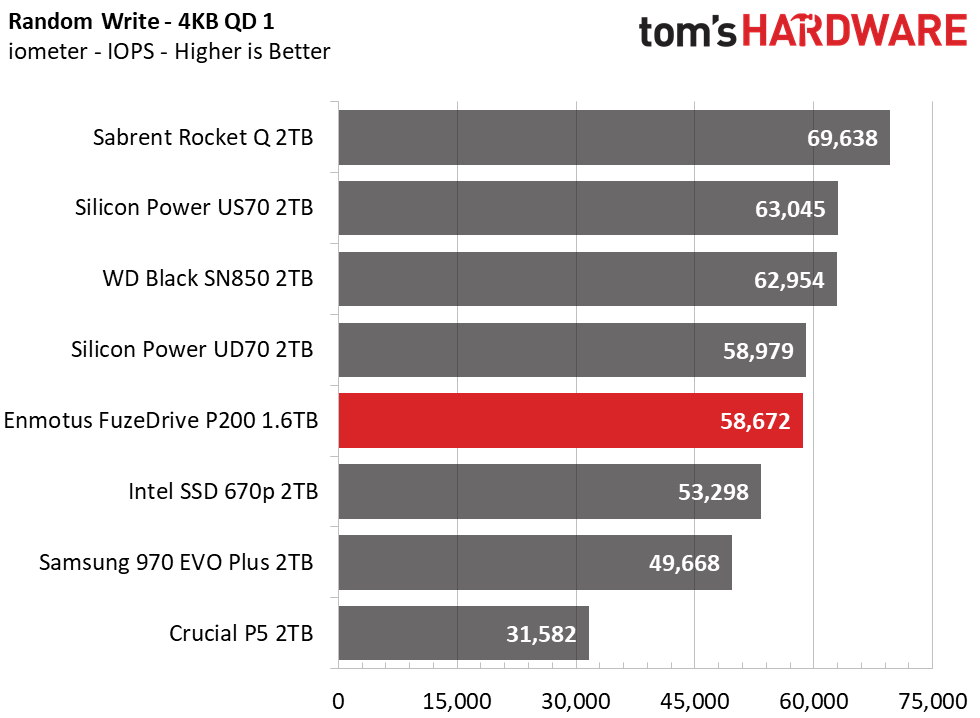
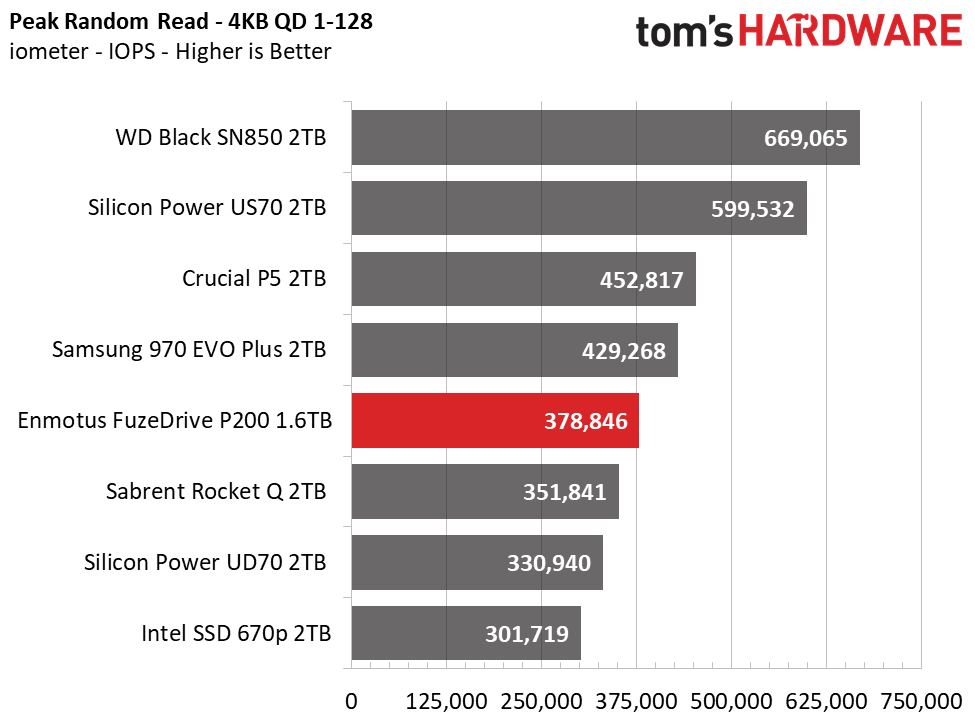
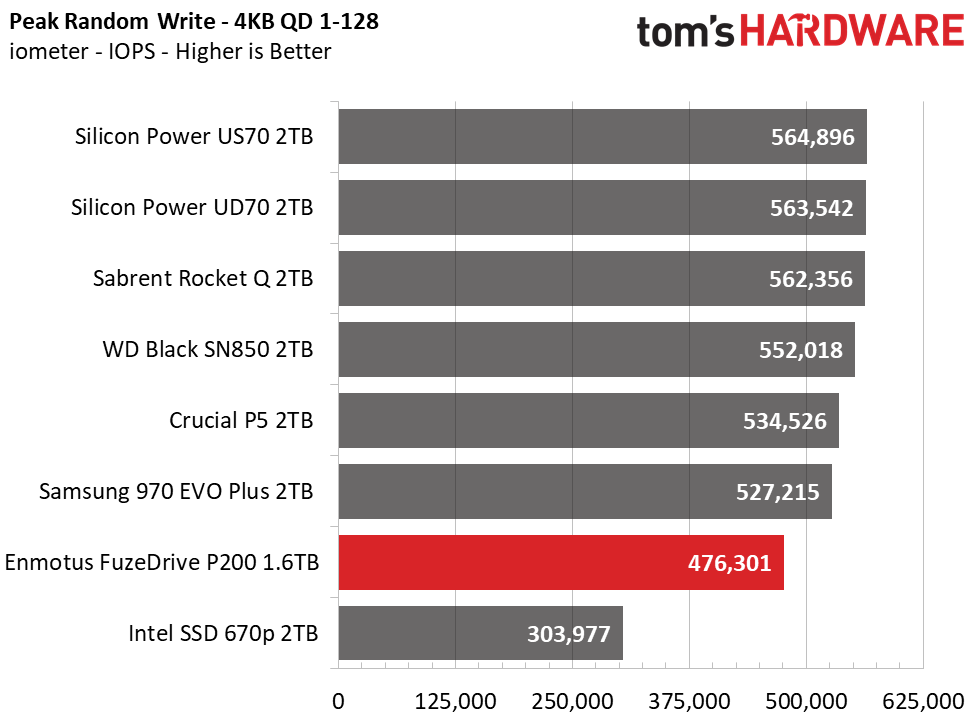
At a queue depth (QD) of one, which helps quantify the snappiness of the drive in everyday tasks, the FuzeDrive P200 lags slightly in sequential read performance with smaller chunks of data but ramps up to full speed from the 4MB block size. Performance increases once we ramp up to higher queue depths, with the P200 peaking at 3,478 / 2,981 MBps of sequential read/write throughput.
The P200’s random read and write performance is solid for a PCIe 3.0 SSD, rivaling many of the faster SSDs in the market. Peak random performance exceeds the company’s official ratings at a QD of 128, too. The P200 pushes out 378,000 / 476,000 random read/write IOPS when we hammer it with a ridiculously heavy workload, beating the Intel SSD 670p.
Sustained Write Performance and Cache Recovery
Official write specifications are only part of the performance picture. Most SSDs implement a write cache, which is a fast area of (usually) pseudo-SLC programmed flash that absorbs incoming data. Sustained write speeds can suffer tremendously once the workload spills outside the cache and into the "native" TLC or QLC flash. We use iometer to hammer the SSD with sequential writes for 15 minutes to measure both the size of the write cache and performance after the cache is saturated. We also monitor cache recovery via multiple idle rounds.
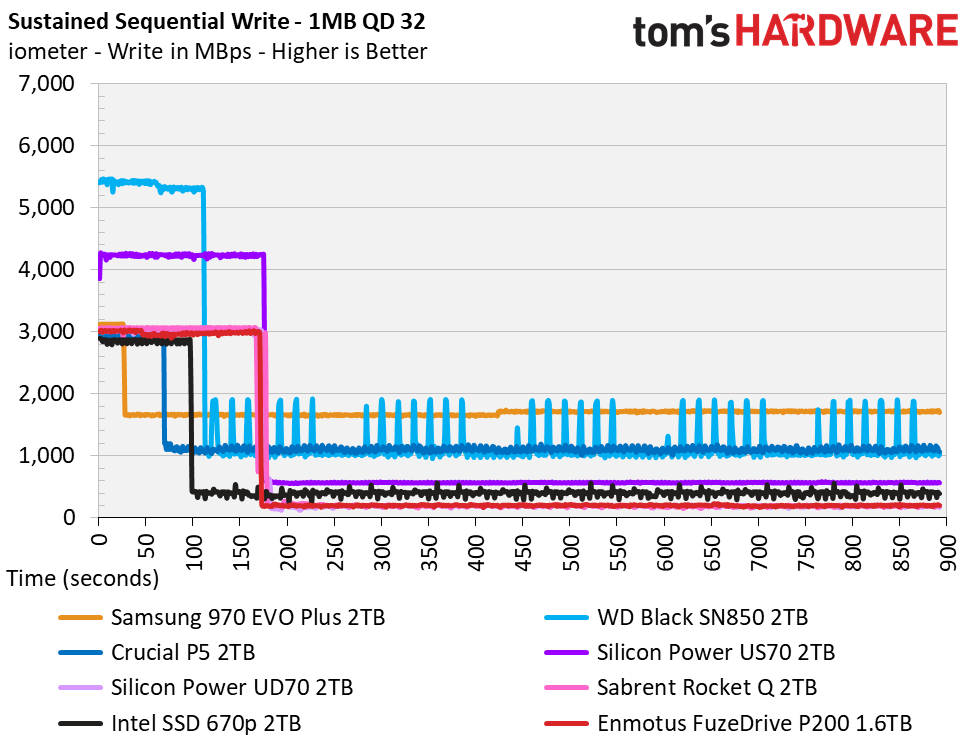
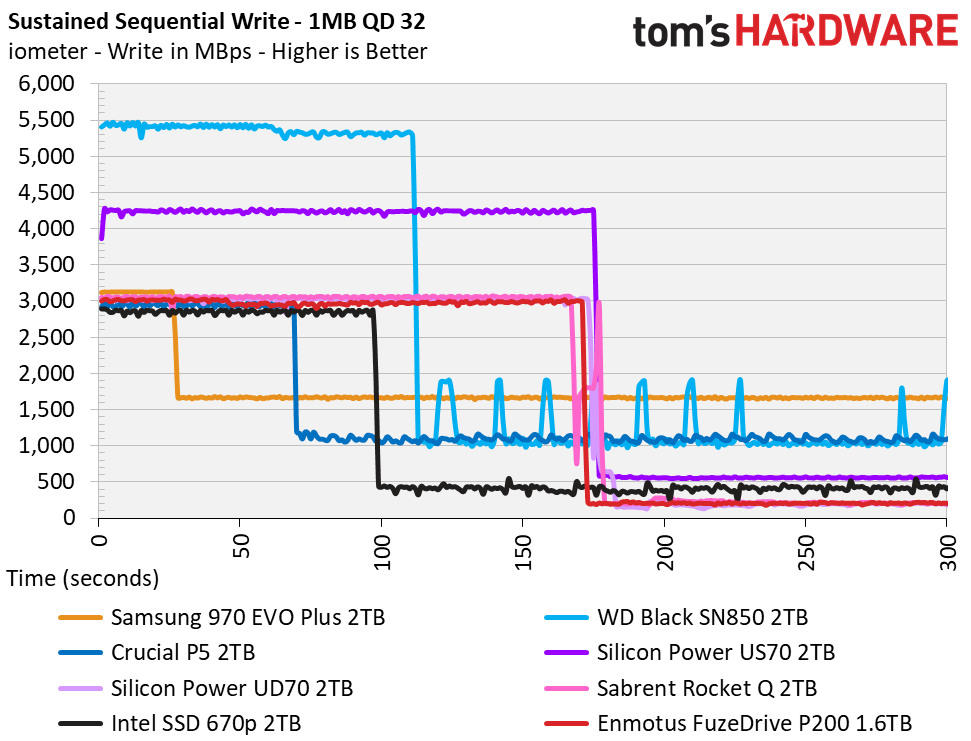
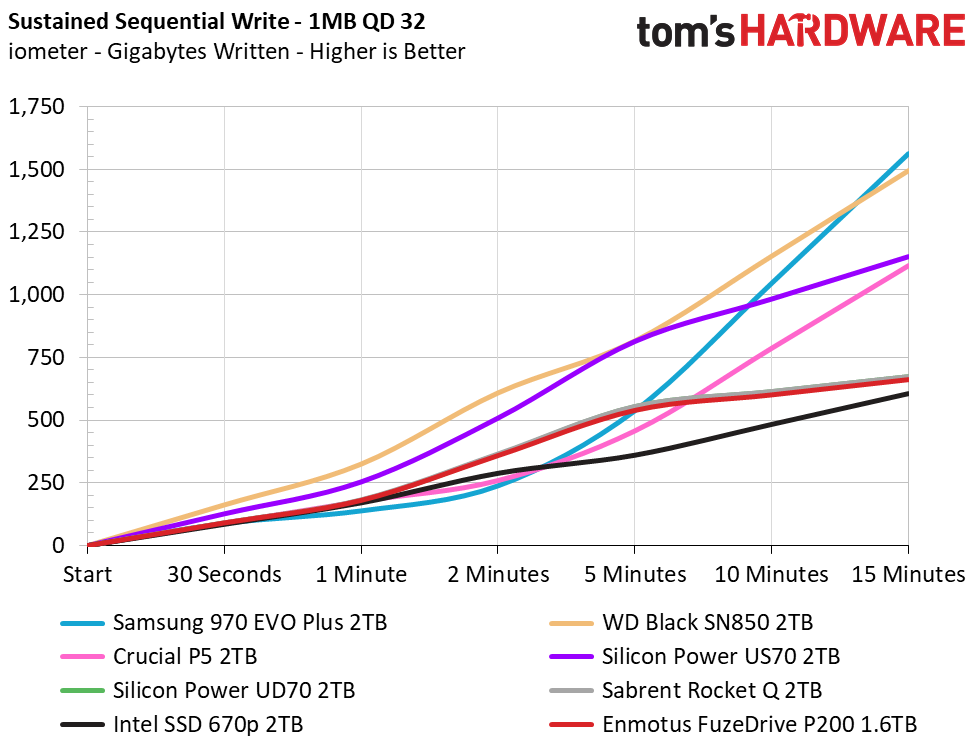
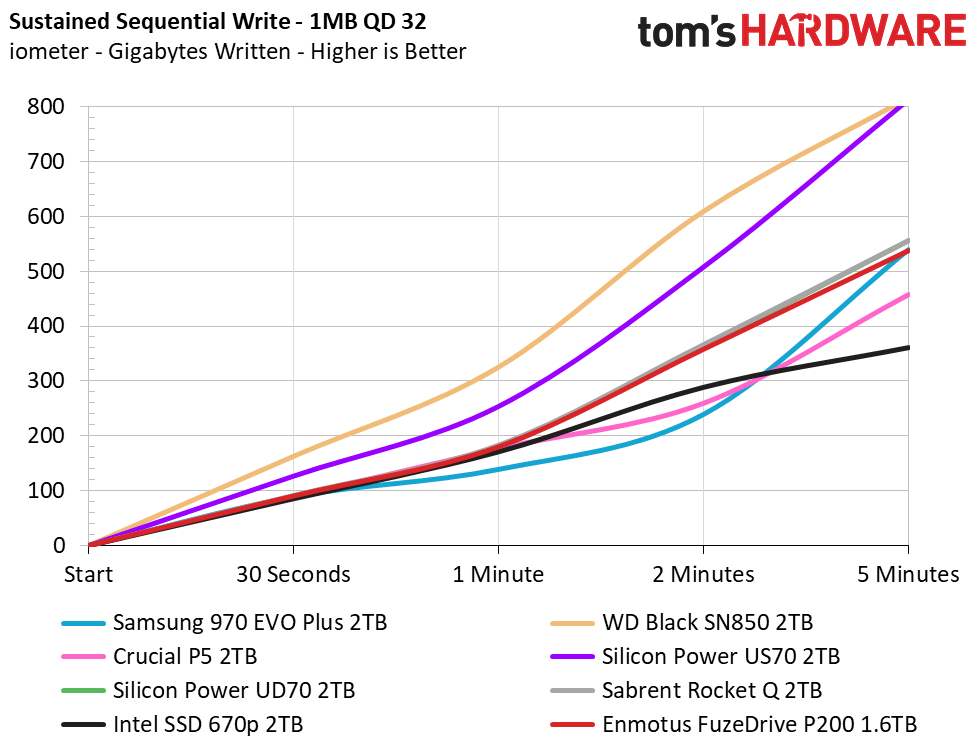
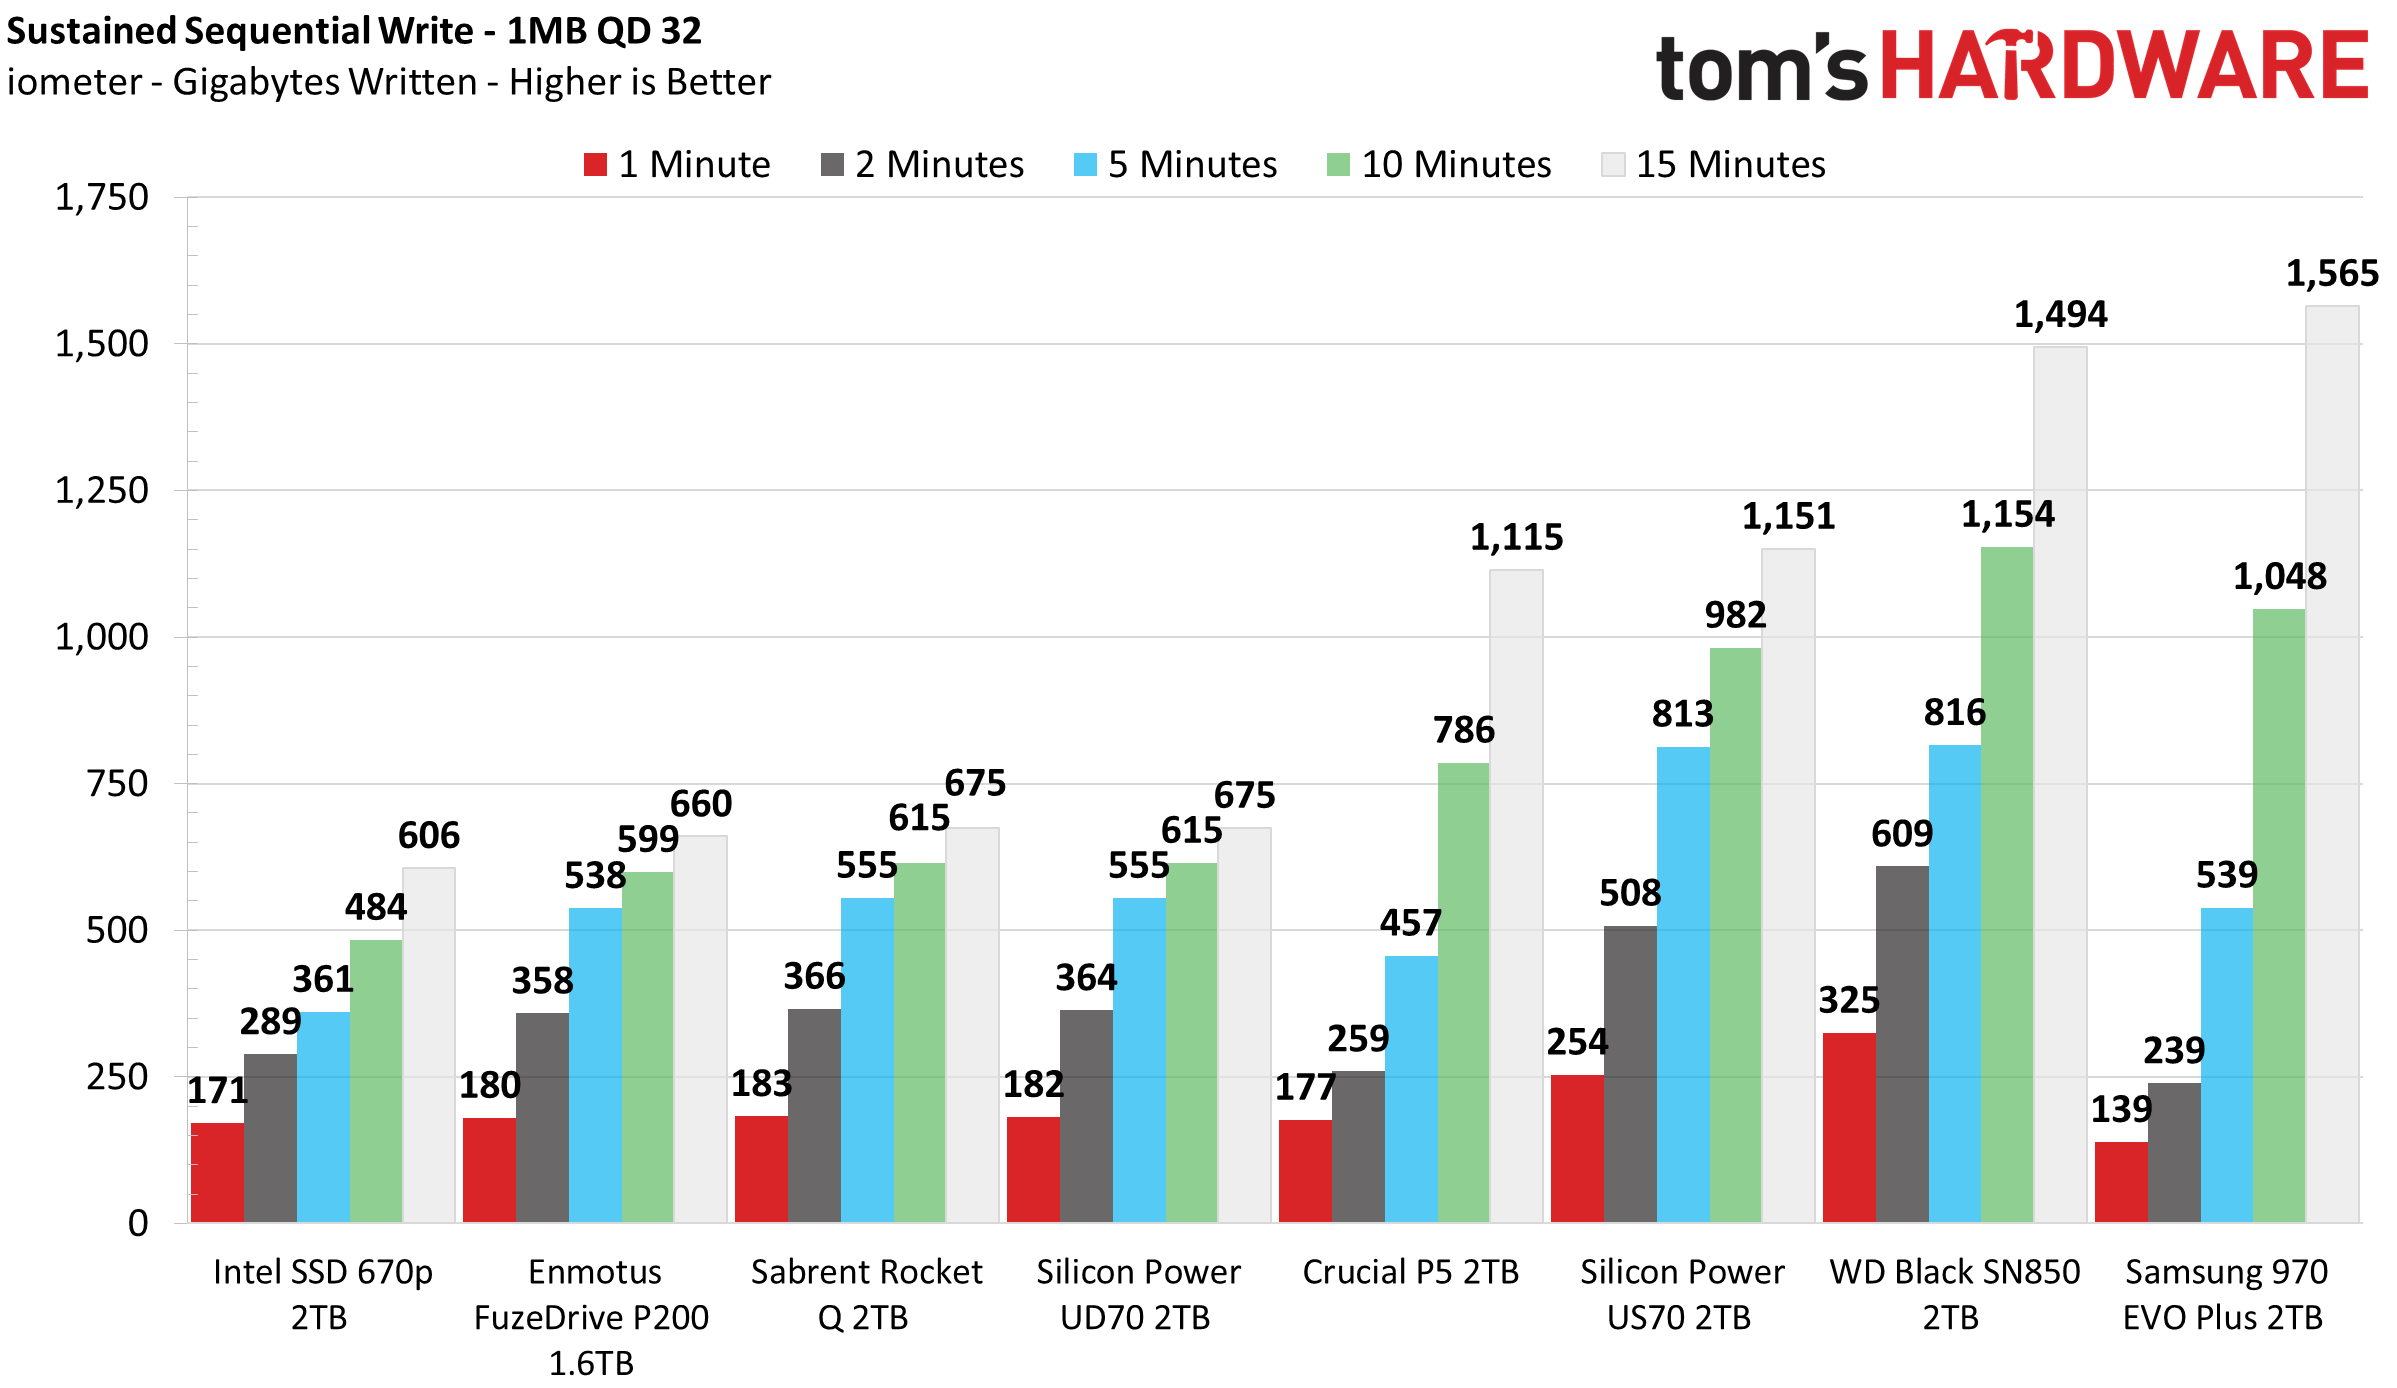
The FuzeDrive P200 uses some of its flash in static SLC mode while most of its flash runs in full dynamic SLC mode, so we expected it to come with a much smaller SLC cache than the UD70 and Rocket Q.
However, the P200’s cache absorbed 510GB of data at 3 GBps before performance degraded. After the cache filled, the average write speed fell to just 200 MBps. This makes for solid performance in most consumer applications but may not be up to muster for most power users and enthusiasts, even though the drive does rebound quickly. After just a minute of idle time, the SSD recovered 160GB of its dynamic SLC cache.
Power Consumption and Temperature
We use the Quarch HD Programmable Power Module to gain a deeper understanding of power characteristics. Idle power consumption is an important aspect to consider, especially if you're looking for a laptop upgrade. Some SSDs can consume watts of power at idle, while better-suited ones sip just milliwatts. Average workload power consumption and max consumption are two other aspects of power consumption, but performance-per-watt is more important. A drive might consume more power during any given workload, but accomplishing a task faster allows the drive to drop into an idle state more quickly, ultimately saving energy.
We also monitor the drive’s temperature via the S.M.A.R.T. data and an IR thermometer to see when (or if) thermal throttling kicks in and how it impacts performance. Bear in mind that results will vary based on the workload and ambient air temperature.
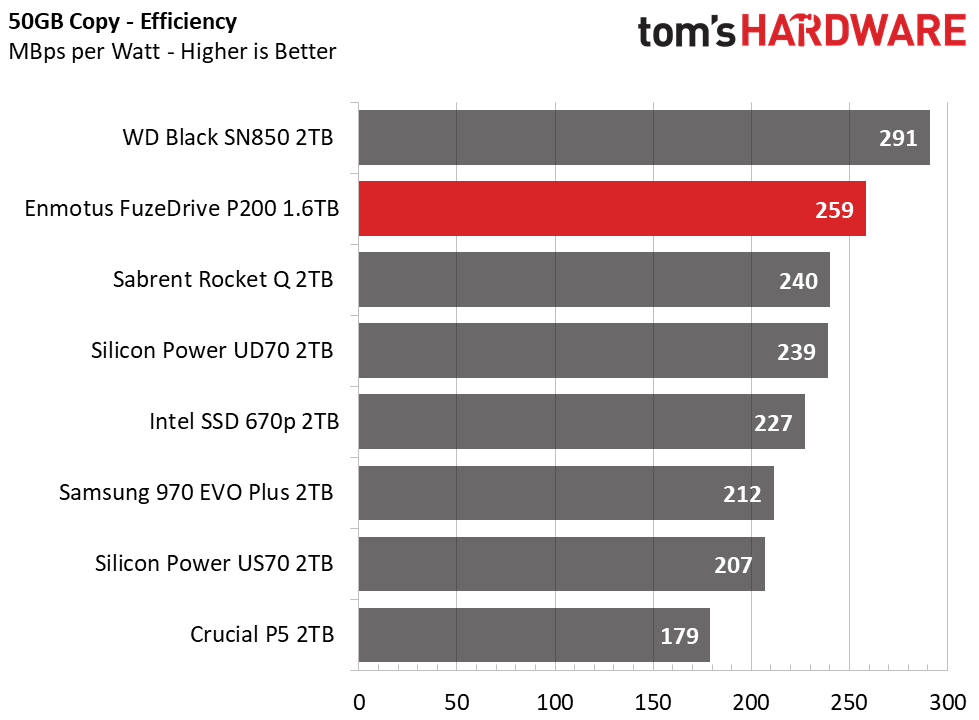
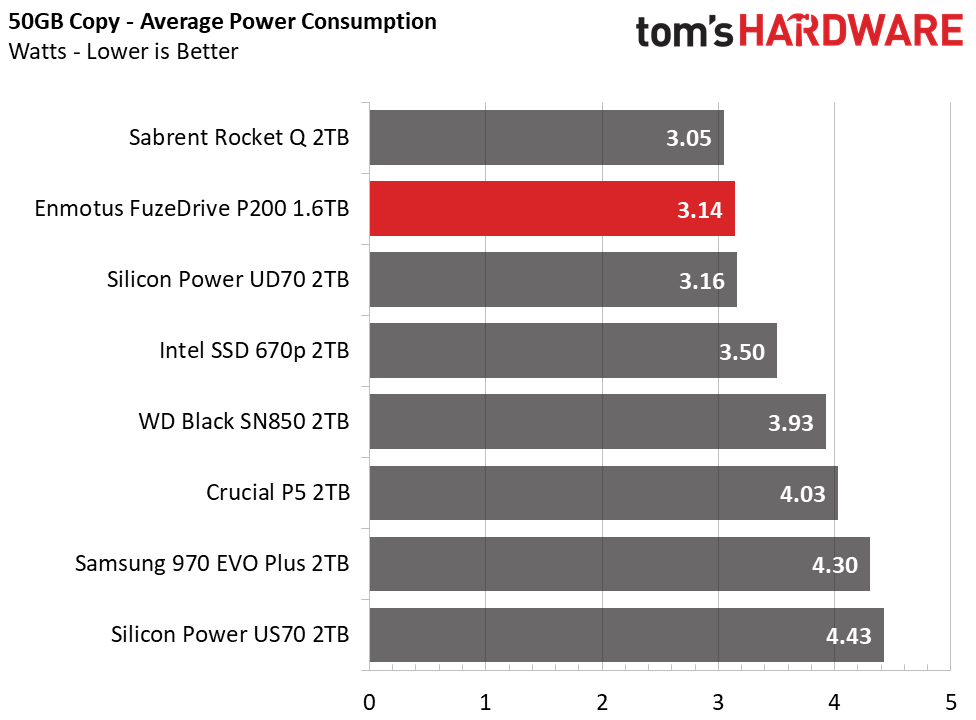
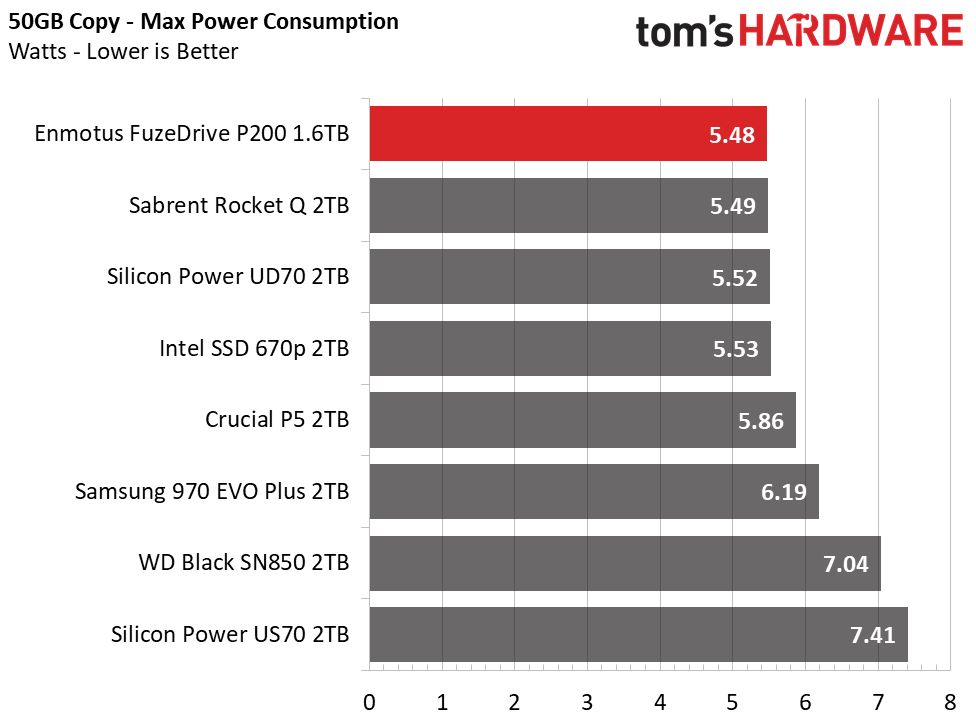
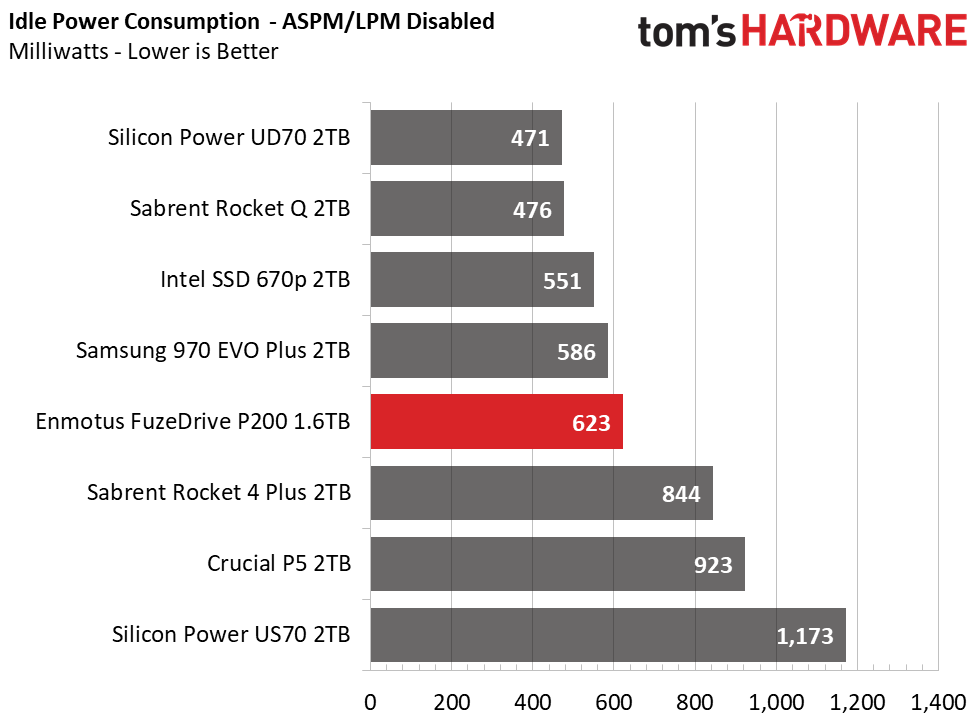
Enmotus’s FuzeDrive P200 is an efficient SSD that seems to run more efficiently due to its multiple namespaces. It sipped the least amount of power under load, and its peak power consumption was also lower than competing drives. While the vanilla Rocket Q and UD70 SSDs scored roughly 240 MBps-per-watt, the P200 led with 259 MBps-per-watt.
The drive also remained cool during testing. On our test bench with no airflow at 23 degrees Celsius, the P200’s temperatures were well within expectations. At idle, it hovered in the high 30 degree Celsius range. When taxed with a few hundred GB of drag n’ drop file transfer operations, the P200 peaked at 74-76 degrees Celsius temperatures and we didn’t detect any thermal throttling.
MORE: Best SSDs
MORE: How We Test HDDs And SSDs
MORE: All SSD Content

Sean is a Contributing Editor at Tom’s Hardware US, covering storage hardware.
-
waltc3 I make it a habit to never buy products that employ buzzwords in their advertising. AI = buzzword. AI = programming--just good, old-fashioned programming, and not one thing more. And write endurance is a big con these days--even my lowly 960 EVO 256GB NVMe drive will last 15 years at my present rate of usage- -and is sure to be replaced long before then...;) Endurance = 75TB . Also, endurance numbers have nothing to do with construction--an NVMe with 75TB write capacity is built the same as an NVMe with 300TBs write estimate, etc--it's not "sturdier," etc. If you are an aggressive user and write 6 TB's per year to an NVMe drive warranted for 5 years with an endurance estimate of 300TB, well, you warranty runs out somewhere after 30TBs...;) Likely, too, you'll buy something new to replace it before that five years is up.Reply
I love my NVMe drives--they're great. What I don't love is hype and other kinds of misleading advertising. -
cryoburner 1TB of QLC for $200? Considering drives with that amount of QLC and the exact same controller can be had for a little over $100, that's a huge markup for what amounts to little more than a better firmware implementation. It sounds like those $100 drives could theoretically implement similar firmware that would do the exact same thing if one were willing to give up around 10% of their capacity to act as a permanent SLC cache like this drive does. It probably won't be long before we see other manufacturers do something similar in drives costing almost half as much.Reply
While I'm not too familiar with the exact workings of how that internally operates, if data is accessed in a mostly random manner across the drive's entire capacity, then I would suspect this drive might have some trouble utilizing more than the size of its SLC cache for that purpose, as the caching algorithm wouldn't likely be able to predict which sectors are going to be written to otherwise. So, there might be less than 128GB usable for that purpose with the 1.6TB drive, or 24GB for the 900GB drive. If one were rapidly writing to random locations in a file much larger than that, I suspect you would burn through the QLC's endurance in no time. You might also end up seeing performance drop to those 200MB/s sustained write speeds, in which case you might be better off with a less expensive and higher capacity platter-based drive.InvalidError said:An SSD with lots of TBW endurance just in time for people to create Chia plots!
