EVGA SuperNOVA 750 P2 PSU Review
Another EVGA P2 is on our test bench today. The 750 P2 features 750W max power, modular cabling and Japanese caps throughout. This PSU promises high performance and increased reliability, so it looks to be a great choice for enthusiast PCs.
Why you can trust Tom's Hardware
Cross-Load Tests And Infrared Images
Our cross-load tests are described in detail here.
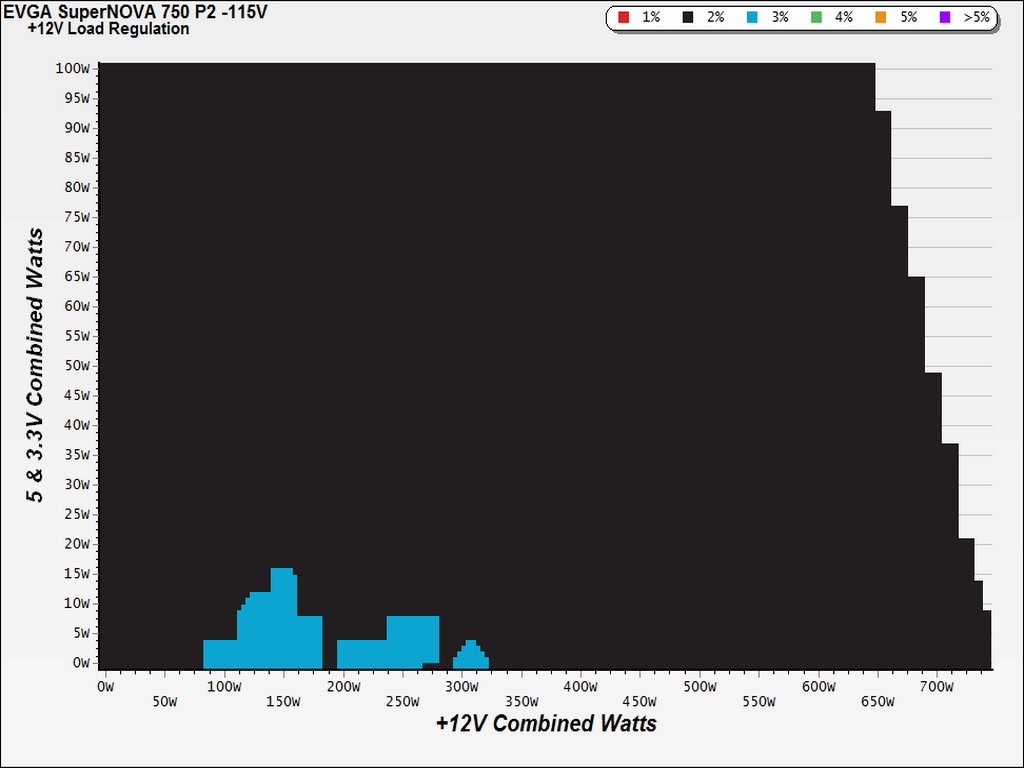
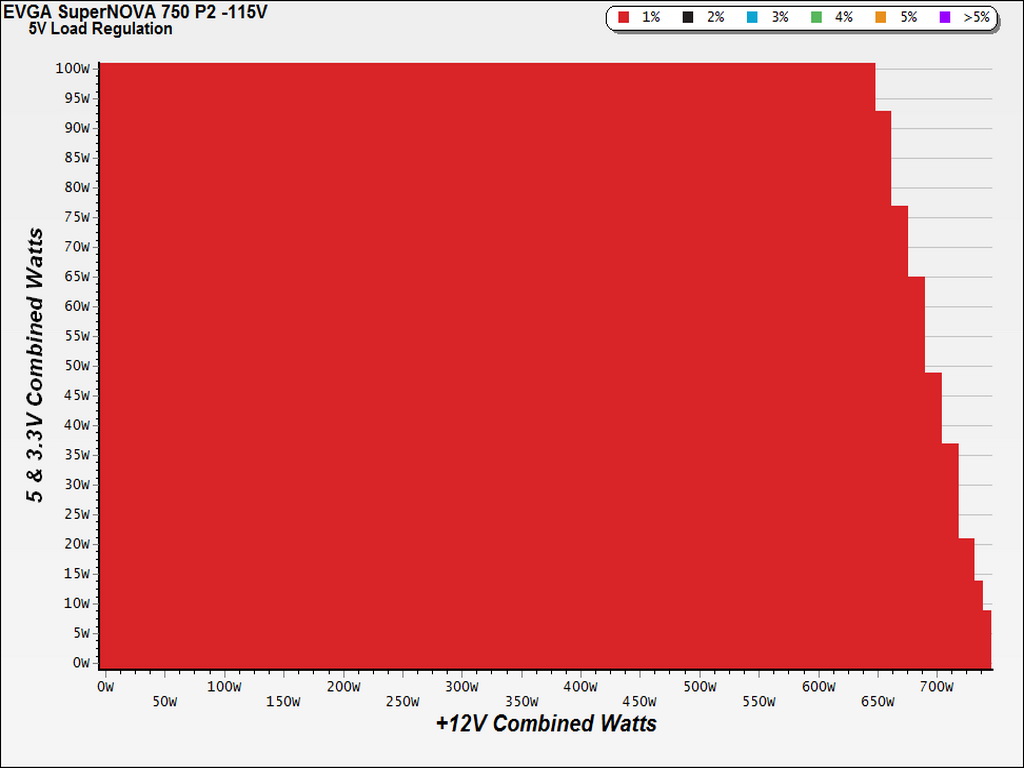
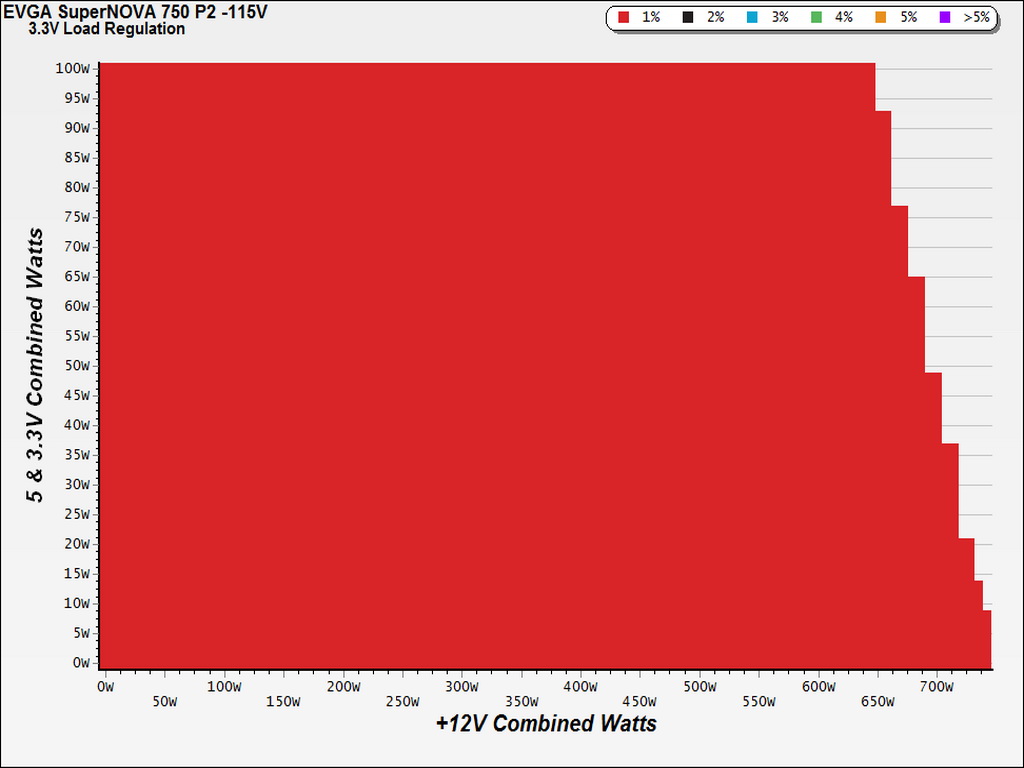
To generate the following charts, we set our loaders to auto mode through our custom-made software before trying more than 25,000 possible load combinations with the +12V, 5V and 3.3V rails. The load regulation deviations in each of the charts below were calculated by taking the nominal values of the rails (12V, 5V and 3.3V) as point zero.
Load Regulation Charts
Efficiency Chart
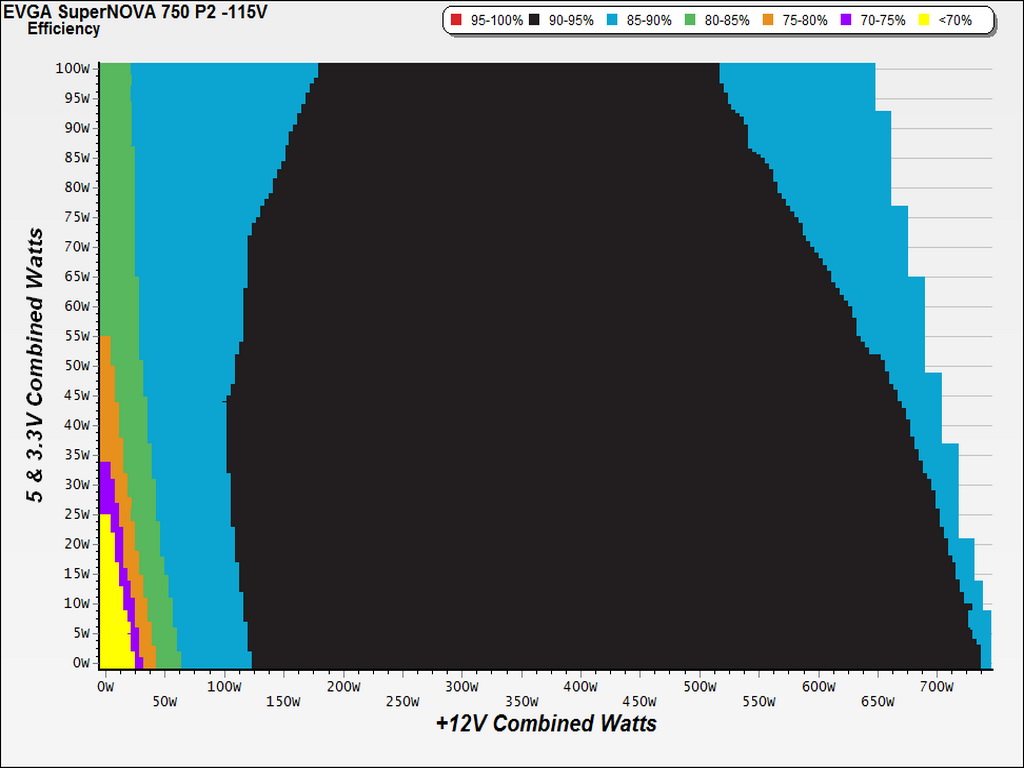
As you can see in the graph above, efficiency looks pretty good. Starting around 120W and nearly up to the PSU's full capacity, efficiency is higher than 90%, even with a significant load on the minor rails.
Ripple Charts
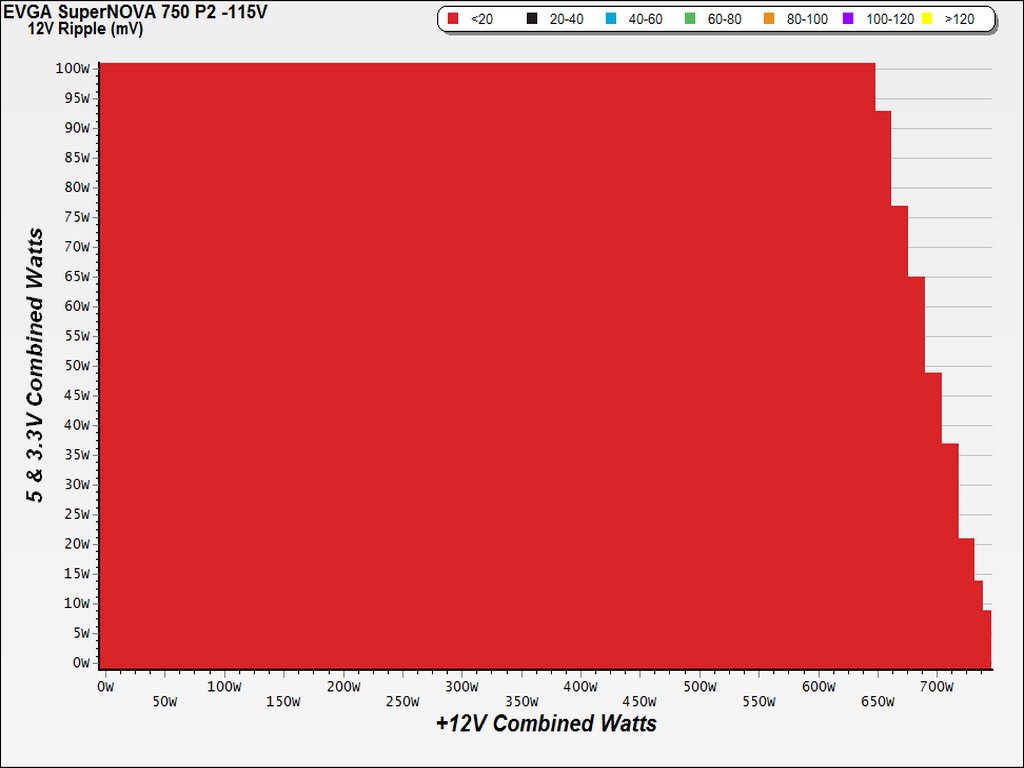
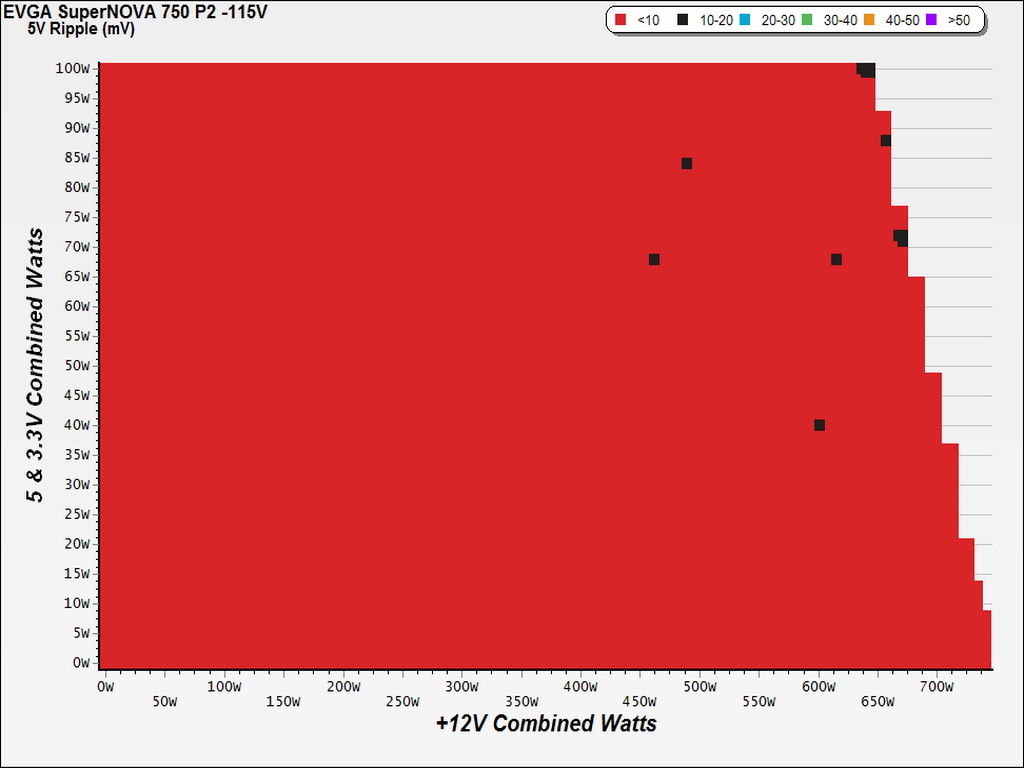
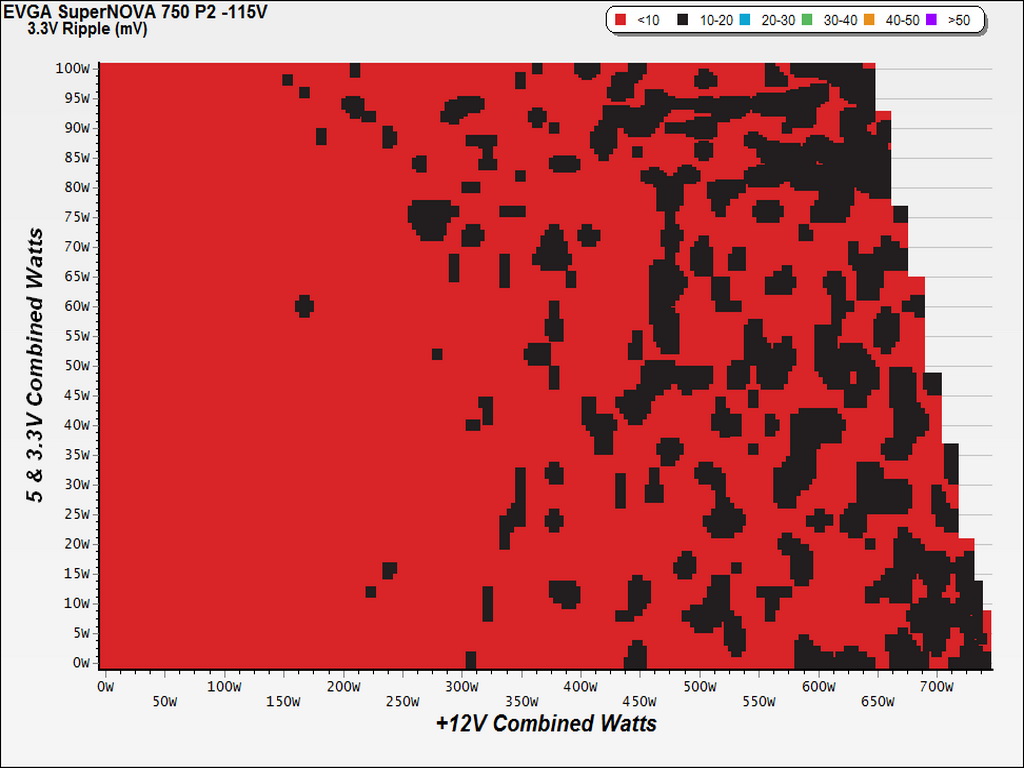
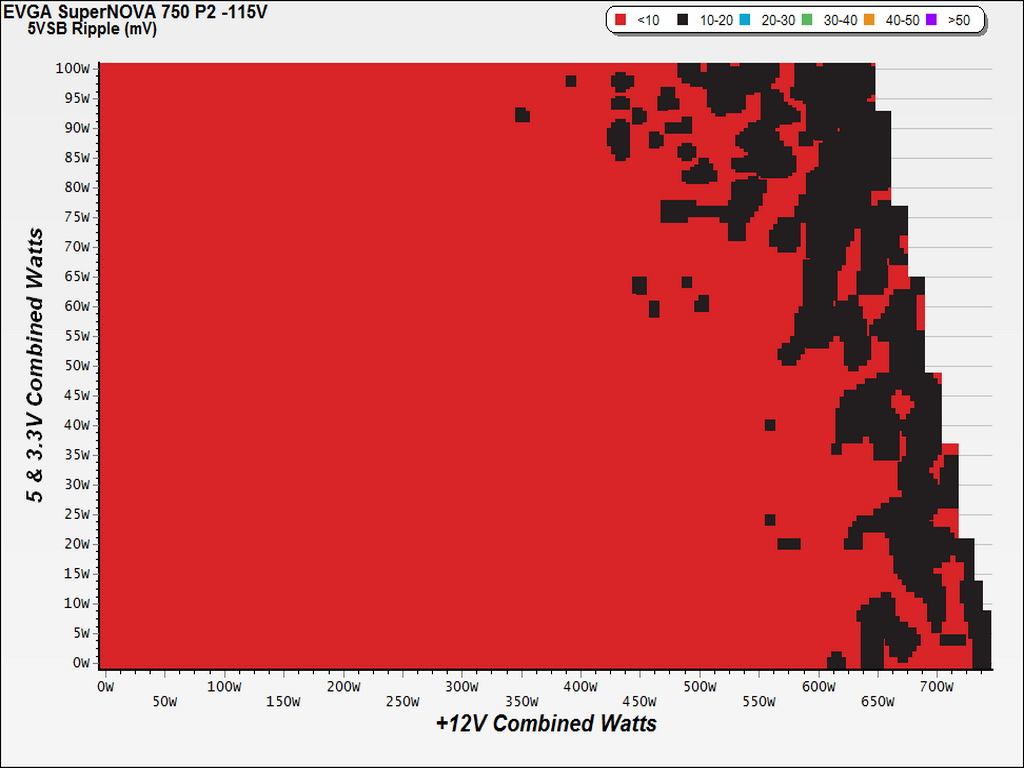
Infrared Images
We removed the PSU's top cover, along with its fan, and applied a moderate load for five minutes followed by full load for eight minutes. Right before we removed the load, we took some photos of the PSU's internals with our modified FLIR E4 camera that delivers 320x240 IR resolution (76,800 pixels).
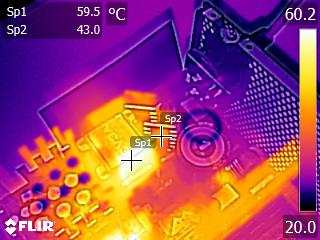
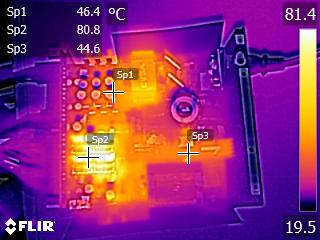
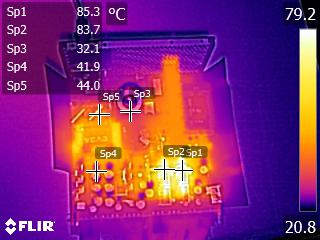
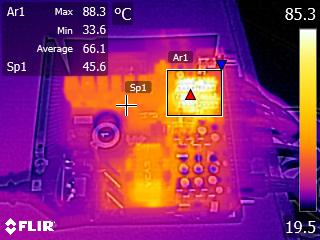
With a 10A load on each of the minor rails and around 56A on the +12V rail, the only parts that get hot are the DC-DC converters' FETs responsible for generating the 5V and 3.3V rails. Energy losses are low thanks to the highly efficient platform. As a result, the thermal load is pretty low, so it doesn't prematurely wear the PSU's components even under intense stress.
Get Tom's Hardware's best news and in-depth reviews, straight to your inbox.
Current page: Cross-Load Tests And Infrared Images
Prev Page Efficiency, Temperature And Noise Next Page Transient Response Tests
Aris Mpitziopoulos is a contributing editor at Tom's Hardware, covering PSUs.
-
Nuckles_56 Thanks for the review Aris. I'd have to say that I'm very impressed with the performance of this unit, it is excellent. It is also nice to see that it has no issues with holdup times either.Reply -
theyeti87 It was the P2 650 review on Tom's that helped me decide on buying that unit. Same as this, just 100 watts less powerful. Extremely happy with the stability and quiet operation. Very reliable units!Reply -
AfiliaSaga I have their G2 750W superflower unit, fantastic performance couldn't be happier with it.Reply -
refillable Another great product from EVGA. I regret belittling EVGA with their early PSUs. I also mistakenly said, "I don't like that EVGA PSU"...Reply
With SuperFlower, they're known to bring greatness now. Anyone looking for "Good PSUs" should go straight to these units and buy them. Exceptional value with excellent performance. Sadly, they're still not available in my country. -
dstarr3 Reply18119171 said:Another great product from EVGA. I regret belittling EVGA with their early PSUs. I also mistakenly said, "I don't like that EVGA PSU"...
With SuperFlower, they're known to bring greatness now. Anyone looking for "Good PSUs" should go straight to these units and buy them. Exceptional value with excellent performance. Sadly, they're still not available in my country.
Right on. Unless you need significantly more or significantly less power, there's no reason to buy anything else.
