Samsung ATIV Tab Review: A Tablet To Hold Your Breath For?
LCD Performance: The Subjective Analysis
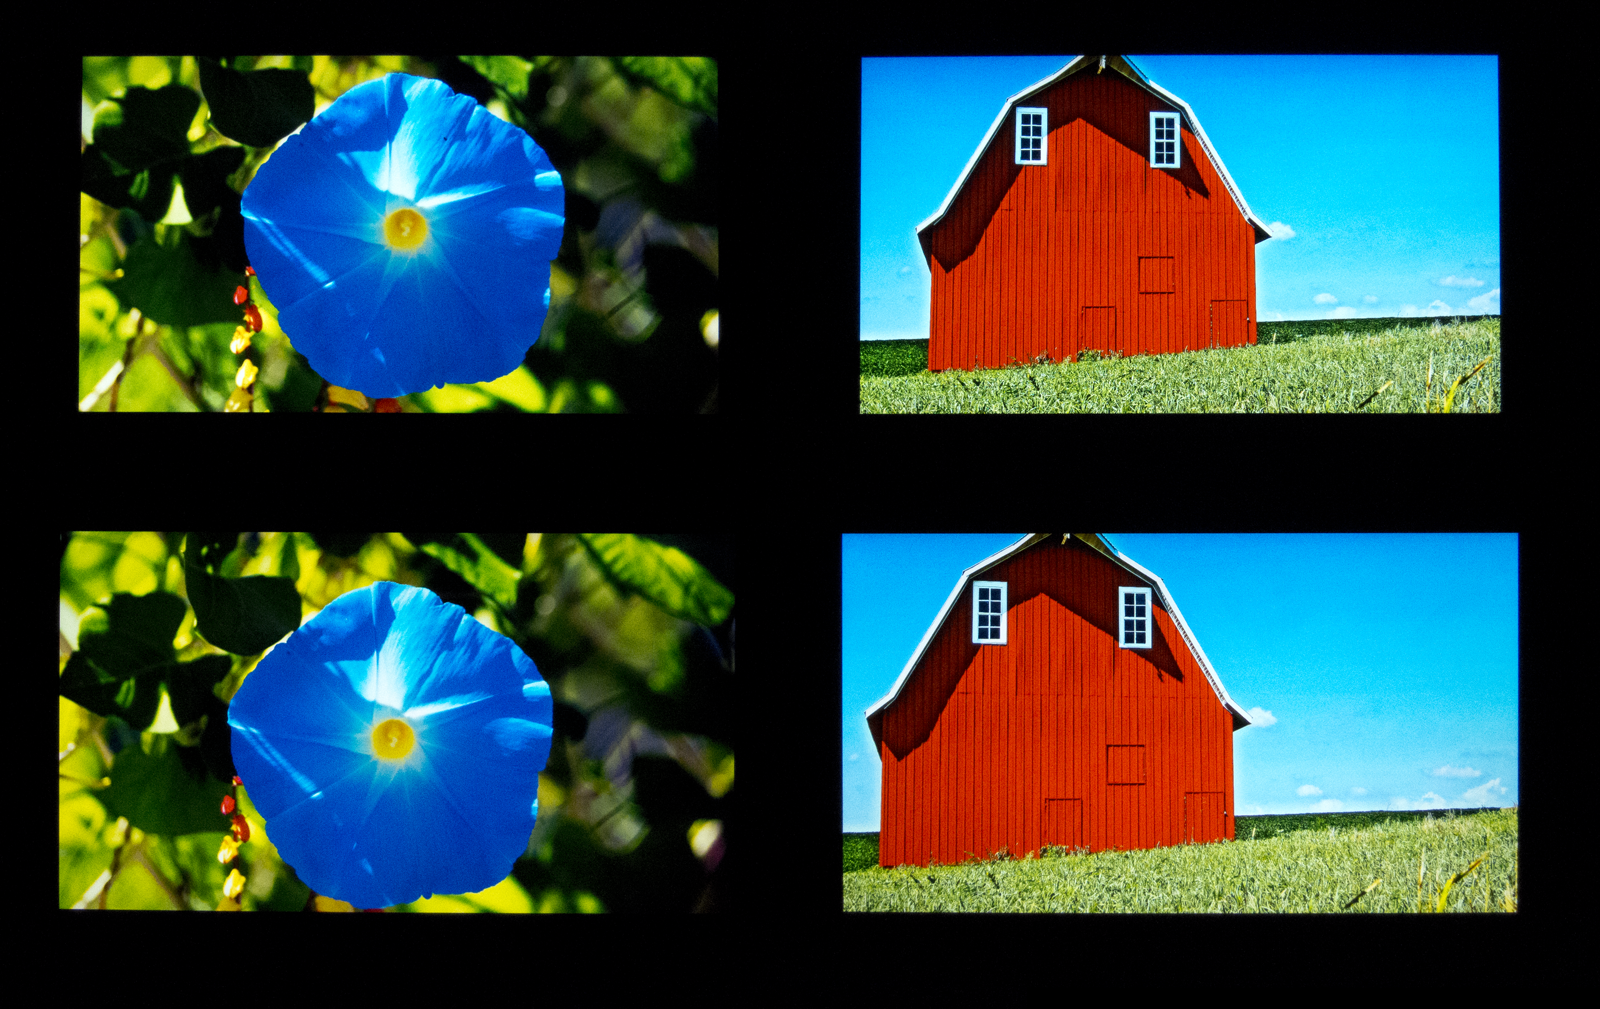
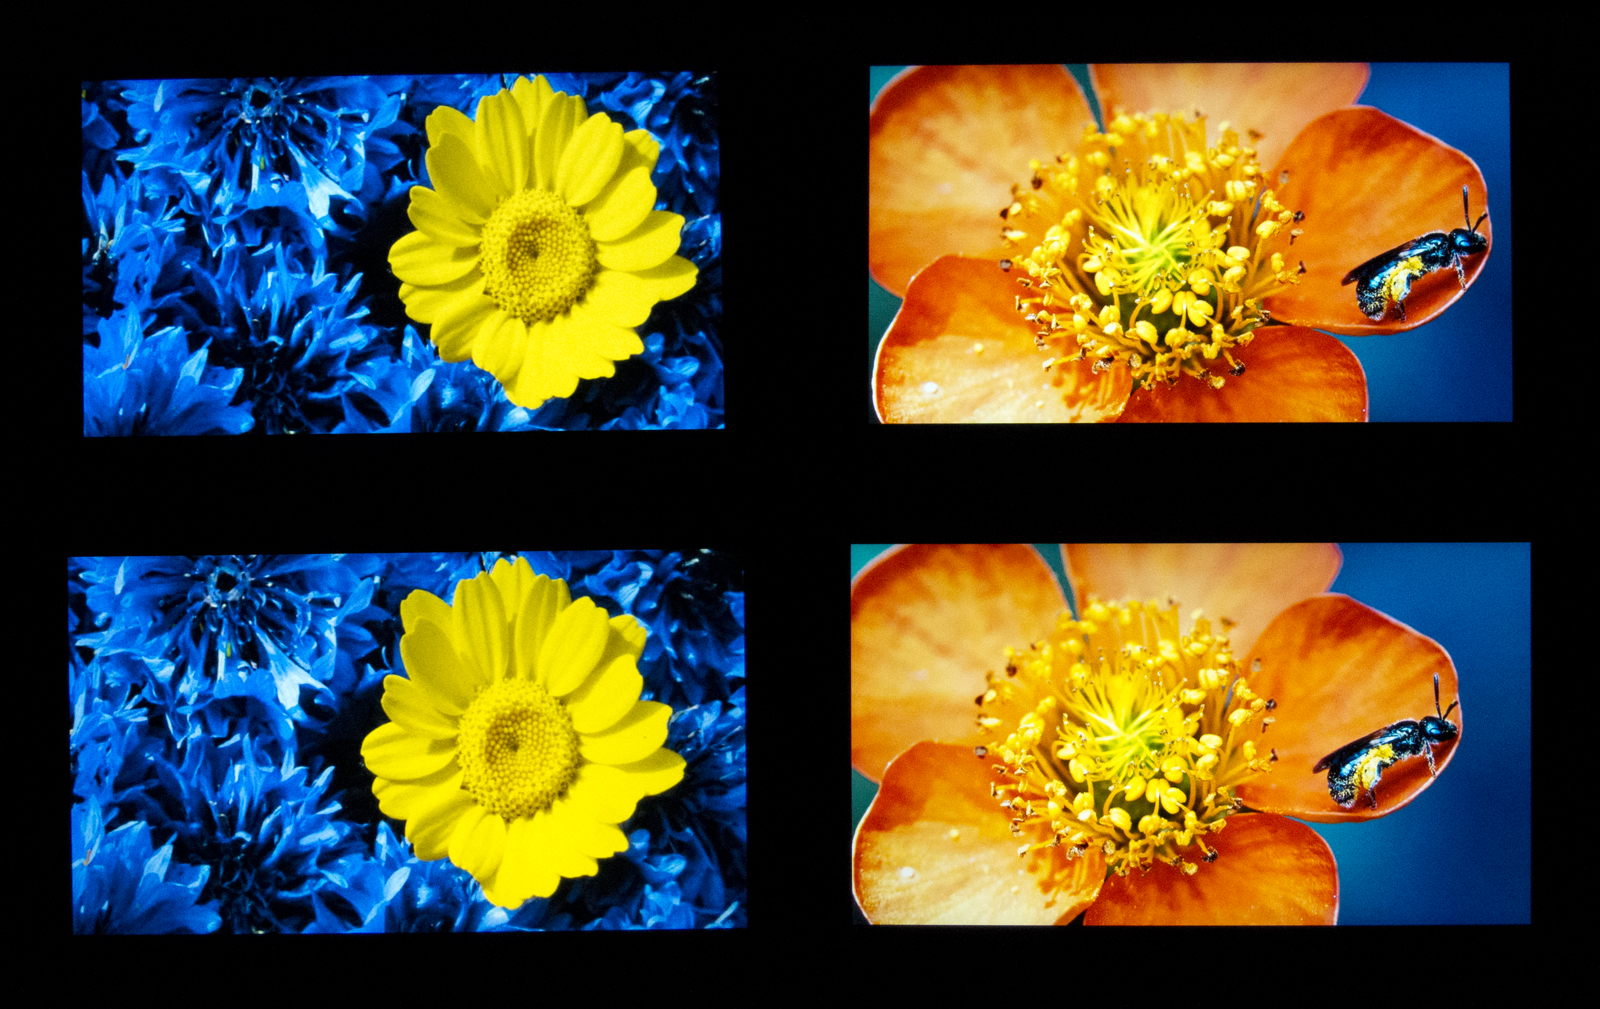
Numbers can only tell you so much. Based on reader feedback, we've toyed with the idea of introducing color accuracy tests using our spectrophotometer. It's not easy to derive meaning from those results though, since they're expressed in a distance metric for color space called Delta E. Instead, we chose to set up in a pitch-black room and capture images that reflect LCD performance.
But first, a couple of caveats. A camera is able immortalize the difference between two displays. If you were to rank hardware based on its color gamut performance, you'd see cameras, wide-gamut monitors, high-quality printer, and then mainstream monitors and printers, in that order. So, depending on the device you're looking at Tom's Hardware on, you may not see the differences in what we're about to present. If you're using a decent screen, though, you should get an image representative of what we're trying to show.
Further, these pictures haven't been optimized in any way. We're simply publishing them after converting RAW files to PNG, which means all six comparisons are made under the same conditions.
We want to avoid flavoring your own opinion, so the pictures are unlabeled. Which tablet looks the best? Take a look at the pictures and decide for yourself. Then, scroll to the bottom of the page and we'll identify each device for you.
This one is perhaps the toughest comparison we've ever set up. Even on my high-gamut monitor, it's hard to tell between Microsoft's Surface (on the bottom) and Samsung's ATIV Tab (up top).
The former has slightly better contrast and brightness. Yet, the latter enjoys a small advantage in color production. In the real-world, you're simply going to find it hard to distinguish between the two displays.
Get Tom's Hardware's best news and in-depth reviews, straight to your inbox.
Current page: LCD Performance: The Subjective Analysis
Prev Page Performance: Samsung's 10.1" LCD Display Next Page Performance: IE10 And Multi-Monitor Browsing-
kyuuketsuki ReplyWhile we were at CES, however, we met up with Lazslo Kishonti, CEO of Kishonti Informatics and the developer of GLBenchmark. He pointed out that Atom-based tablets running Windows RT are more likely to deliver different levels of performance.
Er, you mean Atom-based tablets running Windows 8? (Page 6, Paragraph 11)Power consumption graphs says this tablet has Z2760.Our setup is pretty basic: we set BrowsingBench to run in battery life mode, which prevents the browser from caching data. Instead of
Where's the rest of this paragraph? (Page 6, Paragraph 13) -
kyuuketsuki Also, I'm not sure what's up with the Futuremark Peacekeeper and Rightware Browsermark results, but we know damn well the Krait S4 in this tab is a better performer in every way to the Tegra 3. Not sure why go with the S4 Play with the dual-core Krait and Adreno 225 instead of an S4 Pro with quad-core Krait and Adreno 320, though, especially in a tablet form-factor.Reply -
mayankleoboy1 KyuuketsukiNot sure why go with the S4 Play with the dual-core Krait and Adreno 225 instead of an S4 Pro with quad-core Krait and Adreno 320, though, especially in a tablet form-factor.Because Win8 is already a battery hog compared to Android, and adding power hungry cores will make that worse.Reply
I dont see any issues with S4 pro and Android. -
cangelini KyuuketsukiEr, you mean Atom-based tablets running Windows 8? (Page 6, Paragraph 11)Where's the rest of this paragraph? (Page 6, Paragraph 13)Fixed!Reply -
dokterprio Why there is difference in power usage between ativ tab and ativ smartpc 500t. I think they are the same, except the screen size.Reply -
adamovera dokterprioWhy there is difference in power usage between ativ tab and ativ smartpc 500t. I think they are the same, except the screen size.Sorry, we had the charts labelled the same. The ATIV Smart PC 500T has an Atom and runs Windows 8, while the ATIV Tab has an ARM-based chip from Qualcomm and runs Windows RT - they are actually very different devices.Reply -
adamovera ojasBrowsingBench scores: are the ipads in correct order?Seems to be, I haven't used this benchmark yet myself, and I'd have to check with the author to be sure, but I'd guess that these results are inversely reflecting the resolution of the different iPads.Reply


